In today’s data-driven world, organizations rely heavily on the information they gather to make informed business decisions. However, not all data is created equal, and the quality of data plays a crucial role in the accuracy and reliability of the insights derived from it. This article explores the significance of data quality dimensions and their contribution to accurate analysis and decision-making. We provide scientific definitions of data quality dimensions and describe how they are measured on data.
Table of Contents
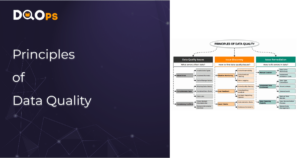
Understanding Data Quality Dimensions
Data quality dimensions are crucial to assess the quality of data. These dimensions provide a framework for evaluating the accuracy, completeness, validity, timeliness, consistency, and uniqueness of data. Let’s delve into each dimension to gain a deeper understanding of their importance.
Accuracy: Matching Information Across Sources
According to the scientific definition of the accuracy dimension, it measures how well data reflects the reality it represents. Accurate data ensures that information aligns with the actual events or objects described. For example, if a customer’s age is recorded as 32, but the true age is 34, the data is inaccurate. To improve accuracy, it is essential to verify the information against reliable sources and correct any discrepancies.
The accuracy applied to databases measures the alignment of information stored in different places within an organization. When data is accurate, it matches across multiple sources, such as databases or systems. If conflicting information is found, it indicates a lack of accuracy. Resolving inconsistencies requires a thorough review of data sets to ensure that information is synchronized across all relevant sources.
The accuracy dimension when used as a data quality dimension is measured by comparing tables. The table being tested for accuracy is compared to a reference table that serves as the source of truth. This reference table can come from the same database or a different data source that has the same information. There may also be a difference in the number of rows between the two tables, as the tested table may contain aggregated data.
For example, if the accuracy of a table that stores invoices needs to be tested, each row in the table represents one invoice. The tested value is the total sum on the invoice. The reference table to which we are comparing is a table that contains the line items. We have to apply grouping by the invoice id foreign key on the line item table to calculate the SUM(line_item_cost) of all line items related to the invoice.
The example above shows the biggest challenge with measuring the data accuracy. We can apply the scientific definition of the accuracy dimension only when comparing the values row-by-row between the tables. A row-by-row table comparison must take into account missing rows, not present in the other table. A row-by-row table comparison will not be able to compare detailed tables (such as the line items) with the aggregated tables, such as the invoice table.
The following table describes three types of table aggregation that could be applied to compare the tables:
Table comparison types
How it works
We are comparing every row in the tested table to every row in the source-of-truth table.
This type of data comparison could be measured on an SQL-compatible data source by joining the tested table and the source-of-truth table.
Both the tested table and the source-of-truth table are queried using a GROUP BY clause. Aggregated measures are calculated, such as SUM, MIN, MAX, etc. The data quality platform will compare aggregated measures for each group of rows between the compared tables.
It is similar to the table comparison using a GROUP BY clause in SQL. We are also calculating aggregated values, but without using the GROUP BY clause. We are comparing the total row count of the tested table and the reference table, or a total sum of a column.
Completeness: Fulfilling Expectations
Completeness refers to the extent to which data fulfills expectations of being comprehensive. For data to be considered complete, it should contain all the necessary information required for a specific purpose. For instance, if a customer’s name, address, and contact details are captured, the data is considered complete. Identifying missing elements and ensuring all required data is captured enhances the completeness dimension.
The data completeness is measured by counting the number or the percentage of rows with a null value in the tested column. It is also worth noting that not all incomplete (missing) column values could be recognized by a simple <column> IS NOT NULL expression. The column could contain also values that are considered as empty placeholder value that was unintentionally entered into the database due to a bug or because of the misconfiguration. Some databases allow storing an empty text “” in a text column, other databases would convert an empty string to a NULL value.
Missing values are not only stored as NULL values in the database. Quite often, the missing values are replaced with empty values placeholders. These placeholders, such as ‘None’ or ‘Undefined’, could be just caused by the conversion of an object to a text value. The most common strings that are equivalent to a missing value are:
- null
- undefined
- missing
- nan
- none
- na
- n/a
- empty
- #n/d
- blank
- “”
- ”
- –
- 0 or more white spaces
You can learn more about completeness in a separate blog post “What is data completeness and how to improve it”
Validity: Adhering to Standards
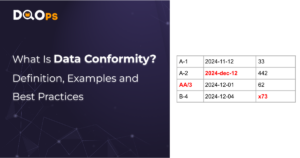
Validity focuses on whether data conforms to specific formats or follows defined business rules. It ensures that data is in a usable format and aligns with the required standards. For instance, if a system requires dates to be entered in a specific format and a different format is used, the data is considered invalid. Ensuring data validity involves validating data against predefined rules and formats. You can find more information about data validity and how to ensure it in a separate blog post.
Timeliness: Information When You Need It
The timeliness data quality dimension assesses whether data is available when it is needed. Having up-to-date and readily accessible data is crucial for making timely decisions. For example, financial information required quarterly should be available promptly to support decision-making processes. Timeliness can be improved by implementing efficient data collection and storage mechanisms. If you are interested in learning more about sources of timeliness issues and how to detect them, please check our dedicated blog post “Types of data timeliness checks.”
Consistency: Values Stay Within Usual Range
Consistency measures how much the data stays within expected ranges. When data is consistent, the range of values and the format of data stays the same over time. If a new value that is outside the regular boundaries is found, it indicates a lack of consistency. These unusual values are outliers within the data set. The Britannica Dictionary defines consistency as the quality or fact of staying the same at different times.
Data Observability platforms that are able to monitor data quality metrics over time are perfectly suitable for detecting consistency issues in data over time. The data observability platform captures metrics of data in regular time intervals. The most recent metric and all historical values related to the same metric create a time series that is perfectly usable to detect anomalies that are outside the usual range.
There are three types of consistency issues:
Consistency type
How it works
The data quality check configuration defines an expected range of valid column values. The minimum and maximum accepted value is known ahead of time.
This time of data consistency check can verify if all (or at least for example 95%) of values of the ‘age’ column are within 18-65.
- *_number_in_range_percent – at least a given percent of rows have a value in a column that stays within the given range
- *_max_in_range – the maximum value in a column aggregated from all column values stays within a given range
- *_min_in_range – the minimum value in a column aggregated from all column values stays within a given range
- *_sum_in_range – the sum of all column values stays within a given range
- *_mean_in_range – the mean (average) of all column values stays within a given range
The measure calculated from the data set, such as sum, min, max, or mean, stays within the dynamic range found from the historical values.
The data quality platform must capture the value of the monitored measure, such as the mean (average) value of a price column. In regular time intervals, the platform captures the most recent measure (the most recent mean of the price column) and compares the value to previously recorded mean values in the past.
Any anomalous values that are outside the usual range of values are outliers and are reported as consistency violations.
Many measures, such as the daily revenue, are affected by seasonability.
We cannot compare today’s total revenue to yesterday’s revenue because we will see sudden changes between some days of the week. In some regions, the revenue on Sundays would be zero, while the revenue on Saturdays and Mondays would be positive. Both the Sunday would be identified as a consistency issue (drop to zero) and the following Monday would be marked as another anomalous day with a huge increase in revenue after the Sunday.
DQOps supports non-seasonal consistency checks for comparing the current score to a value that is 7 or 30 days ago, overcoming weekly and monthly seasonability.
The second and third types of consistency issues are detected using a data observability platform such as DQOps. A data observability platform runs recurring data quality checks at regular intervals and collects statistics about data. All statistical information (such as the maximum value in a column) collected over a period of time becomes a time series for that measure.
The outliers in the time series are data anomalies and potential inconsistencies. The following chart shows a normal range of accepted values (the white area in the middle) and two data anomalies in the yellow zone.

Uniqueness: Avoiding Data Duplication
Uniqueness refers to the absence of duplicate data instances within a database. Duplicate data can lead to inaccurate analysis and decision-making. The dashboards would show higher values because duplicate rows are counted multiple times. Ensuring uniqueness involves regularly reviewing data to identify and eliminate duplicates.
The duplicate rows could be loaded into the database due to multiple reasons:
- the same data is loaded from different data sources
- duplicate data is loaded as a side result of data reload without the proper cleanup
- configuration issues in the data pipeline code load the same data multiple times
The uniqueness data quality dimension is measured by calculating the number of unique values in the column.

The Impact of Data Quality on Business
Now that we understand the significance of data quality dimensions, let’s explore the impact of poor data quality on businesses.
Higher Costs and Inefficiencies
Poor data quality leads to increased costs and inefficiencies within organizations. According to Gartner, organizations with poor data quality incur an average additional annual cost of $15 million. Flawed data requires additional resources and time to correct, leading to higher processing costs. The “rule of ten” states that it costs ten times more to complete a unit of work when data is flawed compared to when it is accurate.
Unreliable Analysis and Decision-Making
Inaccurate and inconsistent data undermines the reliability of analysis and decision-making processes. When data is of poor quality, organizations cannot have confidence in the reports and insights derived from it. This lack of trust hampers effective decision-making, potentially leading to costly mistakes and missed opportunities.
Governance and Compliance Risks
In today’s regulatory landscape, compliance is critical for business survival. Poor data quality can jeopardize compliance efforts, resulting in legal and financial risks. Compliant organizations rely on accurate and reliable data to meet regulatory requirements and avoid penalties. Maintaining good data quality ensures organizations can confidently navigate the complex landscape of governance and compliance.
Damage to Brand Value
Consistently making erroneous operations and decisions due to poor data quality can harm an organization’s brand value. Customers and stakeholders lose trust in a brand that fails to provide accurate and reliable information. Protecting brand value requires a commitment to maintaining high data quality standards and ensuring the accuracy and consistency of information.
Measuring and Improving Data Quality
To harness the power of accurate insights, organizations must measure and improve data quality. Data quality assessment can be achieved by evaluating each dimension and identifying areas for improvement. Implementing data quality solutions and best practices can help organizations enhance their data quality initiatives.
Data Quality Measurement
Measuring data quality involves assessing the accuracy, completeness, validity, timeliness, consistency, and uniqueness of data. Establishing metrics and benchmarks for each data quality dimension allows organizations to track their progress and identify areas of concern. By regularly measuring data quality, organizations can proactively address issues and make data-driven decisions confidently.
Data Quality Improvement
Improving data quality requires a multi-faceted approach. Organizations should establish data governance frameworks, define data quality standards, and implement data cleansing and validation processes. Data quality tools and technologies can automate these processes, ensuring consistent and reliable data. Additionally, training employees on data quality best practices and fostering a culture of data stewardship can further enhance data quality initiatives.

Data quality best practices - a step-by-step guide to improve data quality
- Learn the best practices in starting and scaling data quality
- Learn how to find and manage data quality issues
Conclusion
Data quality dimensions play a critical role in ensuring accurate insights and reliable decision-making. By assessing and improving the accuracy, completeness, validity, timeliness, consistency, and uniqueness of data, organizations can unlock the true value of their information assets. Investing in data quality initiatives, measuring data quality, and implementing best practices will enable organizations to make confident, data-driven decisions and gain a competitive edge in today’s data-centric business landscape.
Additional Information:
- Data quality dimensions provide a framework for evaluating the quality of data.
- Poor data quality can result in increased costs, unreliable analysis, compliance risks, and damage to brand value.
- Measuring and improving data quality is essential for accurate insights and effective decision-making.
- Data quality tools, data governance frameworks, and employee training contribute to data quality improvement.
Organizations need to invest in data quality initiatives if they are to make informed decisions and stay competitive in today’s data-driven world. Data quality tools, technologies, and frameworks can automate processes and ensure consistent and reliable data. Additionally, training employees on data quality best practices is essential for fostering a culture of data stewardship. By actively measuring and improving the accuracy, completeness, validity, timeliness, consistency, and uniqueness of data, organizations can unlock the true value of their information assets. Ultimately, investing in these initiatives will enable organizations to make confident decisions and gain a competitive edge.