
Data Quality Operations Center
Profile, automate, and monitor data quality
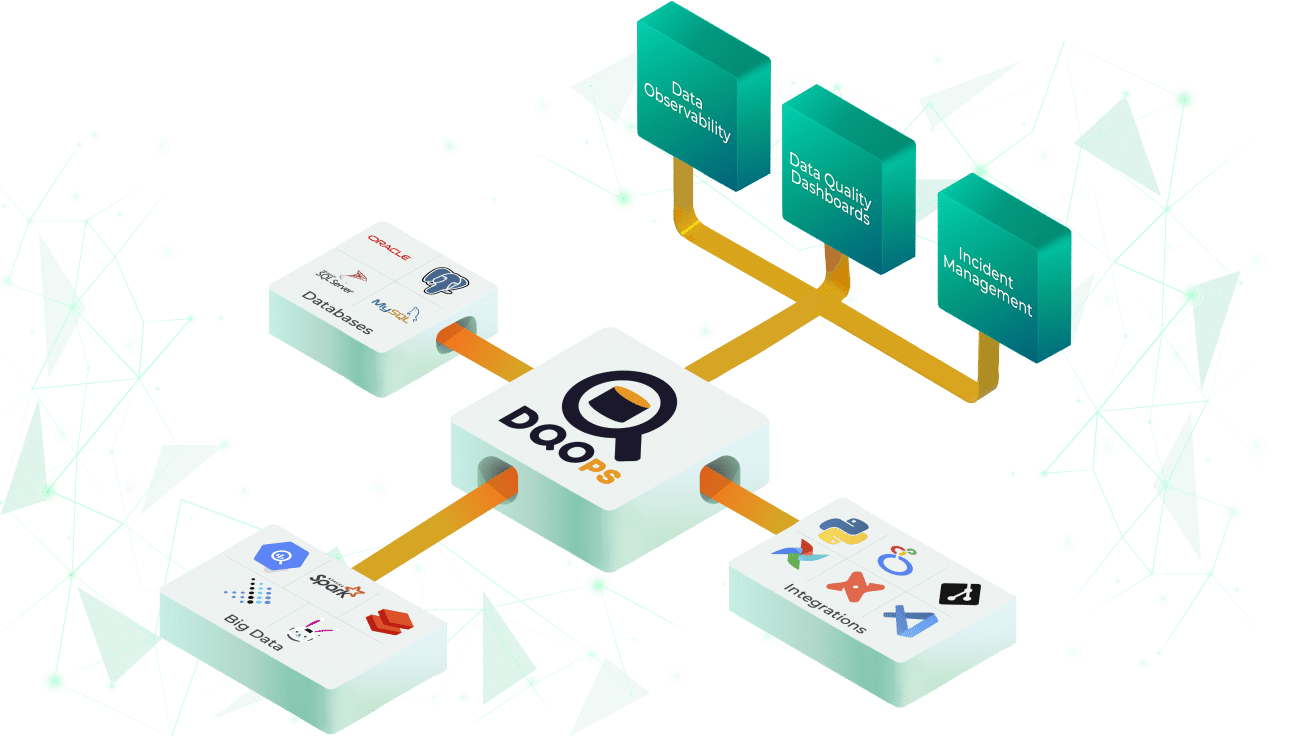
DQOps is a data quality platform for all stages, from profiling new data sources to automating data quality and detecting issues with Data Observability
End-to-End Data Quality Platform
Begin with data quality assessment and rule automation, integrate data quality checks into data pipelines,
and let data observability monitor schema changes, anomalies, and invalid data in your data sources.

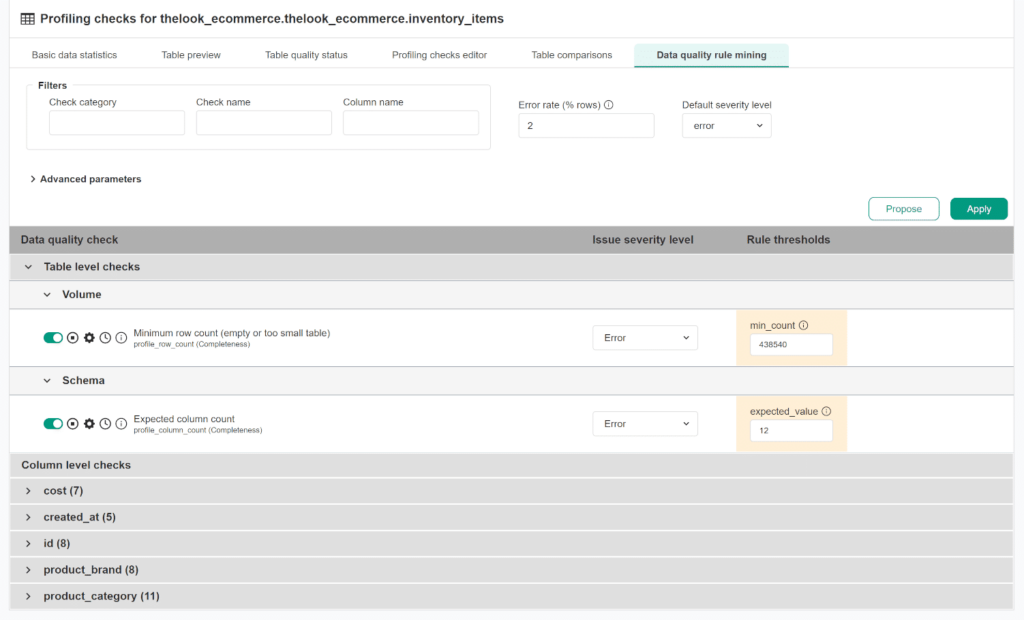
Data quality rule automation
Use the rule mining engine to automatically propose the configuration of data quality checks to detect the most common issues.

Integrate into data pipelines
Run data quality checks from data pipelines, verify data contracts of source tables, and prevent corrupted data from being loaded.

Detect and manage issues
Identify data anomalies and schema drifts.
Group issues into data quality incidents and assign incidents to the right team.

Measure data quality KPI scores
Measure data quality with KPIs that you can prove to business sponsors. Verify data quality SLAs for data domains and vendors.
How it works
Connect your data sources, start monitoring data, integrate data quality checks into data pipelines, and measure data quality with a data quality KPI score.
Data Contracts
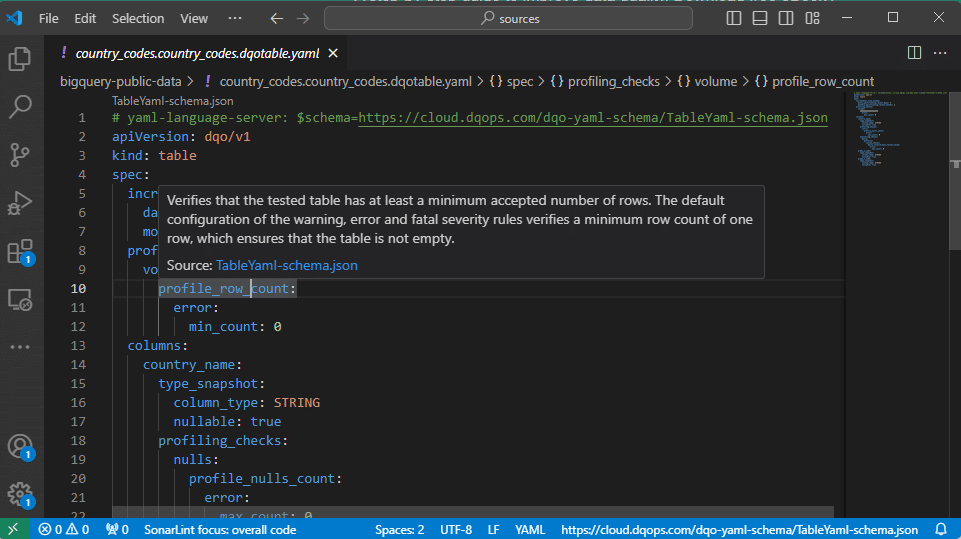
Data Contracts
Configure data quality checks in YAML files with full code completion and in-place documentation in Visual Studio Code.
Validate data quality for source and target tables:
- incomplete tables and columns,
- values outside of an accepted list of valid values,
- values not matching patterns,
- apply data quality checks automatically using policies.
Advanced Data Assessment
Start with a basic statistical analysis to get a quick insight into the data. Then, using a rule mining engine, automatically configure data quality checks to find the most common data quality issues.
- More than 150 built-in table and column data quality checks.
- Measure completeness, timeliness, validity, consistency, reasonableness, and accuracy.
- Create custom data quality checks and rules with Jinja2 and Python.
Data quality with AI-powered automation
Data quality with AI-powered automation
DQOps uses advanced machine learning algorithms to automate data quality processes.
- Automatically generate data quality checks based on the characteristics of your data.
- Validate categorical values and data dictionaries.
- Automatically create regular expressions from sample data to validate complex patterns.
- Automatic generation of SQL queries to validate issues.
Why DQOps
Custom Data Quality Dashboards
Create custom data quality dashboards using our data quality data warehouse.
Analyze
Partitioned
Data
Monitor tables at any scale using incremental data quality monitoring at a partition level.
Custom Data Quality
Rules
Define a custom inventory of approved data quality checks, shared by the data quality team.
DataOps
Friendly
Define data quality definitions in YAML files stored in Git, and run checks from your data pipelines.
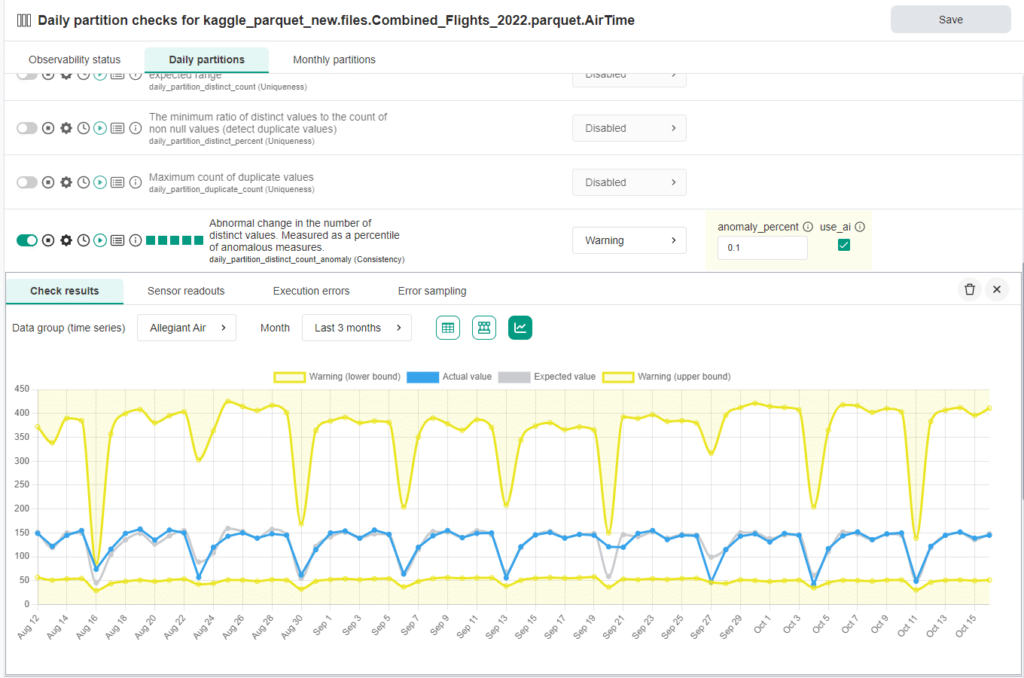
Anomaly Detection with AI
Automatically detect anomalies in your data before they impact your operations. DQOps uses an advanced AI algorithm that considers seasonality and accurately predicts anomalies.
Apply data observability to detect changes in:
- data volume,
- data characteristics min, max, mean, and sum,
- missing or not fresh data,
- schema drifts.
Manage Incident Workflows
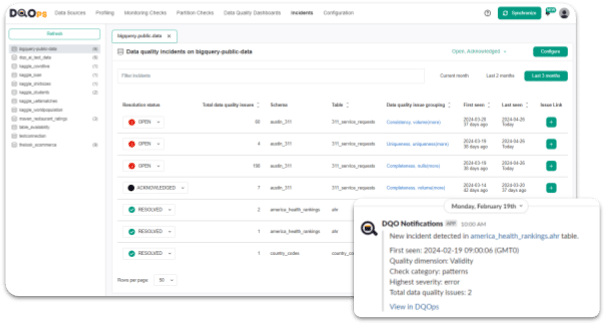
Manage Incident Workflows
Keep track of the issues that arise during data quality monitoring. Automatically group similar data quality issues into data quality incidents.
- View, filter and manage the incidents.
- Automate incident notifications.
- Create multiple notification filters to customize alerts for specific scenarios.
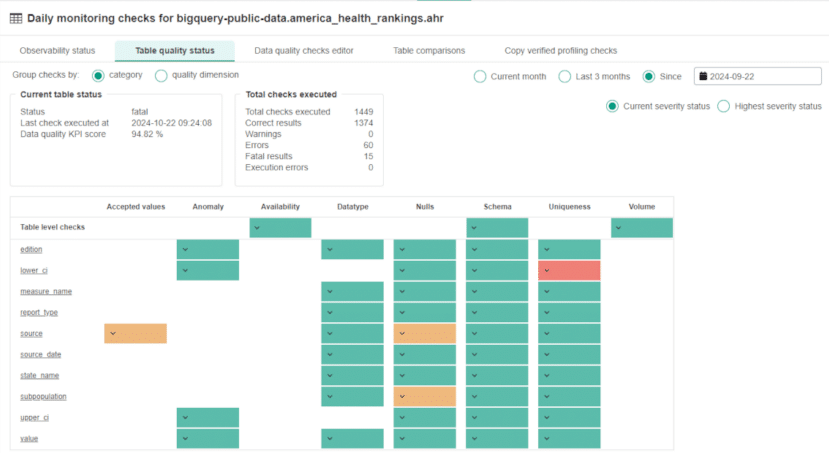
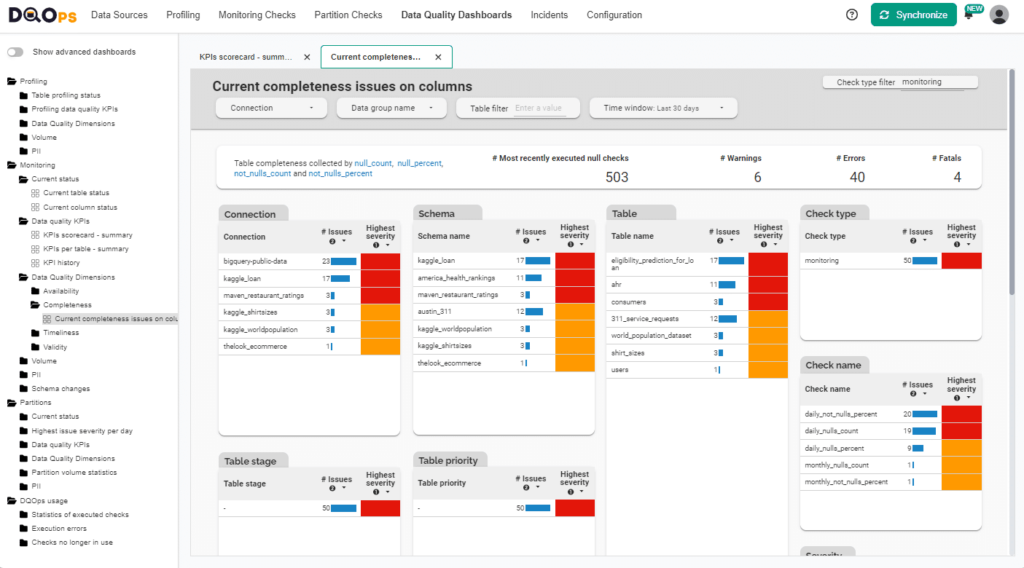
Measure Data Quality KPIs
Aggregate all data quality metrics in a dedicated data quality data warehouse. Calculate data quality KPIs as a percentage of passed data quality checks. Use 50+ data quality dashboards.
- Governance, operational, and detailed dashboards.
- Build dashboards with a custom Looker Studio Connector .
- Prove the quality of the data with numerical KPIs.
Aggregate all data quality metrics in a dedicated data quality data warehouse. Calculate data quality KPIs as a percentage of passed data quality checks. Use 50+ data quality dashboards.
- Governance, operational, and detailed dashboards.
- Build dashboards with a custom Looker Studio Connector.
- Prove the quality of the data with numerical KPIs.
Monitor Various
Data Sources
Run data quality checks as customizable SQL query templates.
Query the results of your existing custom data quality checks and import them into the data quality warehouse to integrate them into the data quality KPI.
Design any data quality check that can detect business-relevant data quality issues.