
Data quality monitoring for data stewards
Continuously monitor the quality of the data
Stakeholders rely on data you steward for critical decisions. Inconsistent data can lead to misleading insights, wasted time fixing errors, and lost trust.
DQOps allows you to monitor the quality of data in all the tables that you are responsible for. You can track the quality of your data every day or after each data refresh. Keep an eye on data quality KPIs to get answers to any questions you may have about the quality of your data.

Manage data quality with ease
One place for data quality
DQOps offers automatic data monitoring and a user-friendly interface for managing both built-in and custom data quality checks.

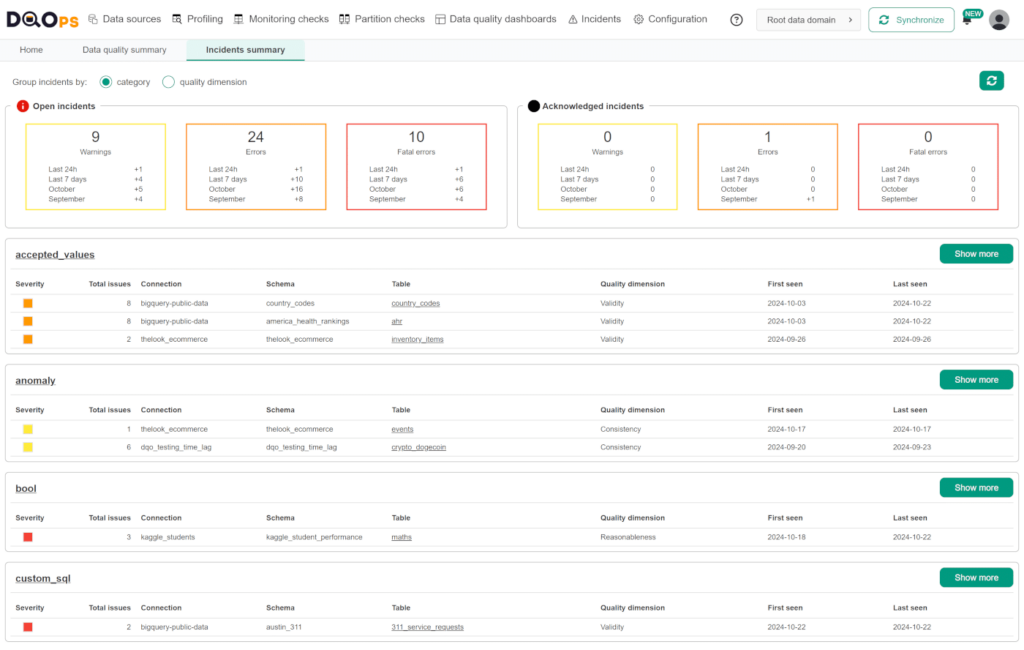
Quality issues notifications
DQOps implements grouping similar data quality issues into data quality incidents. Assign incidents to the support and engineering teams for assessment and resolution.
Ground truth checks
DQOps allows comparing tables for data integrity and identifying discrepancies with other trusted sources.
Data quality under control
Monitor and detect data quality issues before users notice any problems with your tables.
- Schedule the execution of data quality checks at different levels, such as data source, table, column, or individual checks.
- Integrate notifications about issues with Slack or other platforms using webhooks.
- Monitor data quality results using data quality dashboards.
Track multiple data quality dimensions
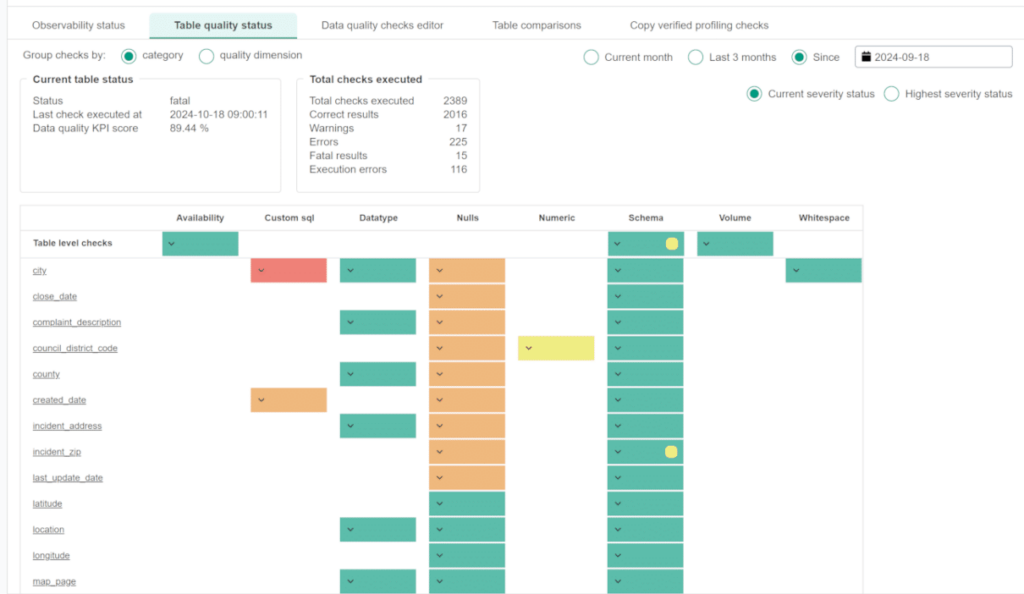
Track multiple data quality dimensions
Each data quality check in the DQOps platform has an assigned data quality dimension that can be modified. Using data quality dimensions, you can identify and prioritize improvements in different areas, ensuring reliable insights and data-driven decision-making.
- Asses current data fitness according to dimension.
- Filter data quality results by a data quality dimension to prioritize data cleansing initiatives.
- Track data quality improvement for each data quality dimension on data quality dashboards.
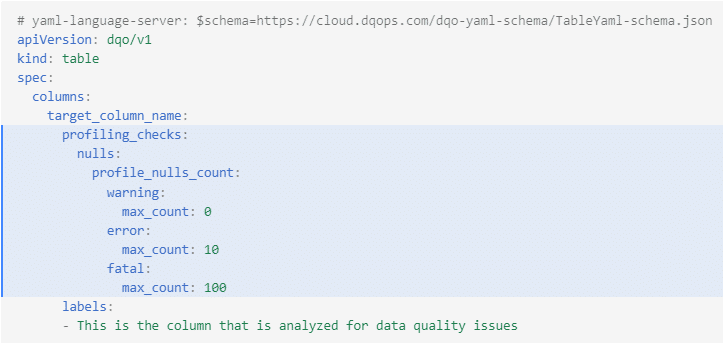
Data source documentation
The data quality definition YAML files are simple and self-descriptive. All data quality check names and alert thresholds are written as easy-to-understand names.
- Share the data quality definition files without revealing the database credentials.
- Data quality checks can be used as documentation.
- Data quality checks are validated daily, keeping the documentation up-to-date.