Data timeliness measures the age of data and tells us if it is up-to-date. It is divided into data freshness, which measures the age of the most recent record, and data staleness, which tells us when the data was loaded.
It is a metric of major importance since out-of-date information can lead individuals to make poor decisions. As a result, companies lose time, money, and their reputation. This article will guide you how to measure it and detect outdated data.
Table of Contents
You can monitor data timeliness for free
Before you continue reading, DQOps Data Quality Operations Center is a data quality platform that monitors data timeliness. You can integrate data quality steps into data pipelines, or let data stewards configure the checks.
Please refer to the DQOps documentation to learn how to start tracking timeliness.
What is the timeliness data quality dimension
Timeliness refers to the expected availability and accessibility of data within a reasonable timeframe. It is a crucial metric as outdated information can lead to poor decision-making, resulting in loss of time, money, and reputation for companies.
Data timeliness can be interpreted in various ways and can address many different questions.
- Is the data up-to-date?
- How fresh is the data?
- What is the most recent record in the table?
- Do we have the most recent data?
- Have we had data quality incidents related to timeliness recently?
- How long does it take to load data through our data pipeline?
- On which days of the week do we receive updated data from suppliers, business partners, or any other type of data providers?
- When did we load the data into the database?
- What is the average lag between records?
Some timeliness-related questions refer to the current state of data. Simply asking if the data is up-to-date, and could be used for decision-making. Other questions need to apply continuous data quality monitoring, commonly referred to as data observability.
By checking the timeliness of data in regular intervals, such as daily, we can count the data quality timeliness issues raised when the data freshness exceeds the longest delay. If timeliness issues are very rare, we can trust the data source and our data platform that the data used for analytics is always fresh and up-to-date.
Various types of data timeliness measures are shown below.
The source of data timeliness issues
In order to fully understand timeliness, we have to consider why data might not be timely. Delays can be caused by technical reasons, such as misconfiguration of the data platform. They are easy to fix and fully under the control of the data engineering group.
Other delays are caused by external parties, such as external vendors that are sharing data. Fixing those issues may require involving the legal department in renegotiating data-sharing contracts.
In order to fully understand the timeliness, we should understand technical issues that cause data delays.
Data timeliness issues caused by technical issues depend on the architecture of the data platform.
Assume you have an ETL pipeline that loads data into your database. Many configuration issues may break the data loading process, skipping the most recent data.
- Credentials to the data source or the target data platform expired
- The source table has significantly grown since the data pipeline was set up, and the data loading process takes too long to finish
- The data pipeline jobs are failing due to a change to the data schema
- Reading, transforming, or loading bad records (values in a wrong format) breaks the data-loading process
Let’s analyze another issue. Imagine that you are using a scheduler like Airflow to upload data to your database at the end of each day. If we do not define a timeout for a specific task in DAG, or if we choose a timeout that is too short, the process may fail. It’s possible that one task will crash and the next won’t start. As a result, we don’t have data for today, which puts us in a bind.
There are many more examples of what could go wrong, but usually, the solution is the same in each situation: perform regular timeliness checks.
Data timeliness issues caused by external parties
We listed common sources of data timeliness issues when they are caused by the data platform that is under our control.
The world is highly interconnected, and companies depend on other companies to work together on a common goal. Manufacturers depend on suppliers to optimize manufacturing performance and efficiency across the whole supply chain process. Retailers receive data from suppliers. Marketers delegate campaigns to external marketing agencies.
The end-to-end process monitoring requires sharing data across collaborating business partners, not only delivering goods and services. For that purpose, collaborating companies decide to share data. When the data is shared between different parties, they play two types of roles in the process.
- The data publisher is the business party that provides data. The publisher follows the agreed-upon data contract, ensuring that the data is prepared and delivered on time. However, the publisher may face technical issues in its own data pipeline, delaying the data delivery.
- The data consumer is the business party that receives the data. Because data timeliness issues are cumulative, like a snowball, the consumer can be affected by two types of timeliness issues. The consumer’s own data pipeline can be affected by timeliness issues, or the data publisher may not provide the data on time. Those two root causes must be identified to avoid raising a complaint to the data publisher when the issue is caused internally.
Data delays caused by external parties may require careful handling. Asking the data publisher to speed up the data delivery may require additional costly work.
We will discuss measuring data timeliness KPIs later in this article and show how they are calculated on timeline dashboards in DQOps.
Data timeliness issues in a Data Mesh
The growing complexity of data platforms and the need to achieve agility in data analytics are often solved by decentralizing the data stack. Independent departments expose their data to other departments for consumption. The data-sharing contracts are loose, based on oral agreements. Even when issues in timely data delivery are detected, the department that is consuming the data can only escalate the incident up the management ladder to a common leader. For the interest of both the publishing and consuming parties, it is better if the timeliness issues are identified early, and both department heads discuss how to solve the problem in the most efficient way.
Agility in data delivery is a crucial competitive advantage for the company, but it causes issues. When two departments trust each other, the data publisher releases data before finishing extensive testing of the data delivery platform. Technical issues on the data publisher side now flow downstream to the department consuming the data.
All technical issues on the way that caused failures in the data pipeline on the way will be visible as errors in logs on the publisher side. The department that is consuming the data will notice them after a delay, as data timeliness issues occur when the new data is not received within an agreed time window.
Source columns for data timeliness
Before we can discuss the definition of timeliness data quality checks, we must first understand how to determine whether the data is up-to-date.
The only types of datasets for which timeliness could be measured are tables that contain some kind of business events that are identified at a point in time.
- Sales facts have a sales date
- Business transactions have a transaction timestamp
- Logs have the timestamp when the entry was generated
- Clickstreams have an impression timestamp
Before we can track the timeliness of each dataset, we must identify the column in the table that is filled with the event (or transaction) timestamp. It doesn’t matter what type of date or date/time type it is. For a DATE type, we will be limited to measuring delays at a whole-day scale, but that could still be acceptable for daily delivered data. We are referring to the event timestamp column as the event_timestamp column in the following article.
Another important column that is often added to a target table that is loaded is an inserted_at column, which is filled by the ETL engine with the current timestamp when the row was loaded. The exact name of the inserted_at column may differ because it depends on the naming convention applied in the data platform. The simplest way to fill the inserted_at during the data loading is to skip it in the column mapping. Instead, configure the default value as a call to the database engine’s function that captures the current system time.
Given that the monitored table has both the event_timestamp column and an inserted_at column, we can now show how to measure the timeliness, including the current system time returned by an SQL function NOW(), which is common in all database dialects.
Types of data timeliness measures
Once we have both the event_timestamp and the inserted_at columns in a table, we can calculate all types of timeliness measures, as shown below. We will use the MAX function to find the timestamp of the most recent record by calculating MAX(event_timestamp) and the last time the table was loaded by calculating the MAX(inserted_at). The timeliness measures are just the difference between those two most recent timestamps and the current system time, captured by calling the NOW() SQL function.
The types of data timeliness measures are shown as the time ranges between timestamps.

What is Data Freshness?
The most important data timeliness measure is data freshness. It is the age of the most recent row in the monitored table.
Data freshness is measured by calculating the difference between the most recent event timestamp in a table to the current system time at the time of observing the freshness.
The SQL query that can calculate freshness used by DQOps on the PostgreSQL database is shown below.
					SELECT
    EXTRACT(EPOCH FROM (
        CURRENT_TIMESTAMP - MAX((analyzed_table."event_timestamp")::TIMESTAMP)
    )) / 24.0 / 3600.0 AS actual_value
FROM "your_postgresql_database"."<target_schema>"."<target_table>" AS analyzed_table
The query calculates the time difference between the current system time and the most recent timestamp of the event timestamp column. The result is the number of days between now and the most recent timestamp in the table.
The documentation of the daily_data_freshness data quality check in the DQOps shows data timeliness examples for other databases.
What is Data Staleness?
Data staleness is a similar data timeliness check, but it measures the time since the target table was recently loaded. The data staleness also measures the time interval between now, and the most recent timestamp of writing the row to the table. The inserted_at column used in this check should be filled by the data pipeline at the time of loading rows.
Data staleness is useful when the data pipeline performs a full refresh of the target table or incremental reload of the last several days of data. Even if no new data was received from the data source and the data freshness is long, the short data staleness proves that the data pipeline is working and constantly reloading the target table.
The SQL query that can calculate data freshness used by DQOps on PostgreSQL database is shown below. It is the same as the query for calculating data freshness, except that a different column is used.
					SELECT
    EXTRACT(EPOCH FROM (
        CURRENT_TIMESTAMP - MAX((analyzed_table."inserted_at")::TIMESTAMP)
    )) / 24.0 / 3600.0 AS actual_value
FROM "your_postgresql_database"."<target_schema>"."<target_table>" AS analyzed_table
The query calculates the time difference between the current system time and the most recent timestamp of the last data load. The result is the number of days between now, and the time when the table was refreshed.
It is important to mention that not all data lakes and data warehouses are designed to store the most recent row insertion timestamp in a dedicated column, filled by the data transformation logic.
However, some database engines are returning pseudo-columns that are generated on the fly by the query engine.
- Google BigQuery has a pseudo-column named _PARTITIONTIME which is the partition date of ingestion-time partitioned tables. This fake column could be used for measuring the data ingestion up to an hourly precision.
- Databricks has a hidden column _metadata.file_modification_time that will return the last file modification timestamp that could be used to detect the time when a parquet file was uploaded.
Data timeliness examples for other databases are shown in the documentation of the daily_data_staleness data quality check in the DQOps documentation.
What is a Data Ingestion Delay
The data ingestion delay measures the time how long the data pipeline or the ETL process needed to pick the most recent data and load it into the target table.
The SQL query used by DQOps on the PostgreSQL database to calculate the ingestion delay is shown below. It is a mix of freshness and staleness queries, but it does not use the current system time. Only the most recent timestamp of the event timestamp column and the insertion column are compared.
					SELECT
    EXTRACT(EPOCH FROM (
        MAX((analyzed_table."inserted_at")::TIMESTAMP) -
            MAX((analyzed_table."event_timestamp")::TIMESTAMP)
    )) / 24.0 / 3600.0 AS actual_value
FROM "your_postgresql_database"."<target_schema>"."<target_table>" AS analyzed_table
The data ingestion delay is sensitive to data reloads. Especially, when the target data warehouse is rebuilt by fully reloading the source data. When the rows that were already loaded are deleted and loaded again, their insertion timestamp column will be different, giving false information that the data pipeline takes too long to load the data.
On the other hand, a long ingestion delay may indicate that the data was reloaded, which does not necessarily mean it’s a bad thing.
Data timeliness examples for other databases are shown in the documentation of the daily_data_ingestion_delay data quality check in the DQOps documentation.
How to Configure Data Timeliness Monitoring
Data timeliness is monitored by data observability tools, such as DQOps, by running timeliness data quality checks to measure the age of data. DQOps supports configuring data timeliness monitoring checks both in a YAML file and using a user interface.
The YAML file can be stored in the source repository. This example of configuring a data freshness check provides the configuration of the column names in the monitored table that contain the event timestamp and the insertion timestamp column names. The name of the monitored table is not shown in the YAML file because DQOps follows the principle of “configuration by convention,” storing the table name as the file name.
The daily_data_freshness monitoring check requires a threshold parameter to decide how long data freshness delay should trigger a data quality issue at a warning severity level.
					apiVersion: dqo/v1
kind: table
spec:
  timestamp_columns:
    event_timestamp_column: event_timestamp
    ingestion_timestamp_column: inserted_at
  monitoring_checks:
    daily:
      timeliness:
        daily_data_freshness:
          warning:
            max_days: 1.0
The data freshness can be also configured from the user interface, as shown on the next screenshot taken from DQOps. The green square before the name of the daily_data_freshness check shows the status that the data was 0.05 days old (around 1 hour) at the time of running the data freshness check.

The configuration uses two different alerting threshold configurations. Warning level issues are raised when the data is 1 day old, but an error severity data quality issue is raised for delays longer than 2 days.
The error severity configuration is important for a different reason. DQOps uses error severity issues to measure the table’s data quality KPI score. Data quality KPIs measure the trustfulness of data regarding data timeliness. The data quality KPI is just a percentage of passed data freshness checks when the delay did not exceed the error level threshold.
How to Measure Data Timeliness KPI Score
As shown in the screenshot taken from DQOps above, the data timeliness KPI is a percentage of passed data timeliness checks for a period of time.
The data timeliness KPI is a useful metric for measuring the data timeliness data contract between the data publisher, such as an external vendor, supplier, or a department, and the data consumer that is measuring the compliance with the data delivery contract.
At best, the data timeliness KPI should be measured by both parties. The publisher should run data timeliness checks, measuring the data freshness on the landing zone where the data is exposed for consumption. In case of delays in the data delivery, the data publisher can prove that the data was provided on time, every day for the last week, month, or year.
The data consumer who is receiving the data and measuring its freshness can detect if the source data is up to date before trying to find the issue inside the consumer’s data pipeline that is transforming the data.
It is also important to react quickly to data delays. When data timeliness issues are detected, the data observability platform, such as DQOps, sends notifications to inform the data support team that the agreed-upon data delivery delay was not met.
Data Timeliness Dashboards
The notifications raised when the data timeliness issues are detected allow only a reactive approach. The data timeliness incidents are raised, forwarded to the data support team, and fixed without reviewing the root cause of the issue. Frequent data timeliness issues lead to a decrease in the trustfulness of the data source.
The trustfulness of data is based on proof that the data is always fresh, and the data timeliness issues were just rare incidents. When the business sponsor or a head of the data department asks how trustful the data is, a quantitative approach is required.
DQOps uses data quality dashboards to present both the current state of data timeliness and measure the data timeliness KPI over time.
The list of the most up-to-date tables is shown on the “Table freshness—tables with most current data” table below.

The next dashboard shows how to calculate the data quality KPI. The data timeliness check that we just executed on the monitored source passed, so the data timeliness KPI is 100%.

DQOps also provides other types of data timeliness dashboards that can help in investigating data timeliness issues.
- Current timeliness issues show the current incidents when the data was not refreshed within an accepted time window
- The history of timeliness issues allows us to investigate how often timeliness issues are detected.
- Table freshness – tables with the most current data dashboard shows the most up-to-date tables
- Table freshness – tables with the oldest data dashboard show the tables that are not receiving new data and are probably outdated.
- Table staleness – tables most recently loaded dashboard shows when the data was loaded
- Table staleness – tables no longer loaded dashboard identifies tables that are not even refreshed and should probably be decommissioned
- The history of table freshness dashboard shows a calendar for each table, showing the delay observed for each day
- The minimum, maximum, and average delay dashboard summarizes the statistics for all timeliness metrics, allowing for comparison of data timeliness between tables.
If the set of built-in data timeliness dashboards is not enough, DQOps supports creating custom data quality dashboards.
Data quality best practices - a step-by-step guide to improve data quality
- Learn the best practices in starting and scaling data quality
- Learn how to find and manage data quality issues
How to get started
Data observability is data timeliness, which is the cornerstone of data observability. It tells us when data is collected, when particular processes are performed, and when data is available to use.
When dealing with a whole operational data management system in the real world, it is a starting point for troubleshooting when an error arises.
The data quality KPIs are the perfect way to apply data contracts for data timeliness, measuring the trustfulness and freshness of data. Both the data publisher and the data consumer can be sure that all delays in data delivery are detected early and problems with data timeliness are analyzed to avoid new incidents in the future.
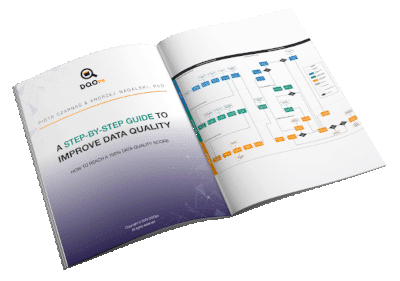
Check out our free eBook, “A Step-by-Step Guide to Improve Data Quality,” which describes a proven process of assessing data quality, monitoring it, and reacting to data quality issues.
FAQ
Find answers to common questions about data timeliness below.
What is Timeliness?
Timeliness means how quick something happens or how close it is to when you need it. In the world of data, timeliness is super important because it measures how up-to-date your data is and whether it’s current enough to be useful for making decisions. Think of it like this: old news is rarely good news, and the same goes for data. Outdated data can lead to bad decisions because it doesn’t reflect the current situation.
What is the Timeliness of Information?
The timeliness of information refers to how current and relevant it is to the present moment. When you need to make a quick decision, you need the most up-to-date facts. This is especially important in fields like finance or healthcare where things change rapidly.
Think of a stock trader needing the latest market prices or a doctor requiring a patient’s most recent test results. Any delay in getting this information can have serious consequences.
That’s where data timeliness comes in. Our information is stored as data in computer systems. Data timeliness helps us measure how fresh that data is. By checking data timeliness, we can ensure that people have the latest information when they need it. This could be through viewing it on a dashboard or receiving real-time notifications.
Why is the Timeliness of Information Important?
The timeliness of information is important because it ensures that decisions are made based on accurate, up-to-date facts. Using outdated information can lead to poor choices with potentially serious consequences.
Think of it like this: a doctor wouldn’t want to prescribe medicine based on test results from months ago, right? They need the most current information to provide the best care.
In the same way, businesses rely on timely data to track performance, understand customer behavior, and respond to market changes quickly. Timely information provides a clear picture of the current situation, enabling better decision-making in any field.
How Does Timeliness Affect Data Analysis?
Timeliness significantly impacts data analysis because it directly influences the accuracy and relevance of the results.
Using outdated information can lead to misleading conclusions and hinder effective decision-making. When data is timely, it provides a snapshot of the present situation, allowing analysts to identify trends, spot anomalies, and make informed recommendations.
Outdated data can skew the analysis, leading to inaccurate insights and potentially costly mistakes. For example, if a business analyzes customer purchasing behavior using old data, they might miss out on recent shifts in preferences, leading to poor marketing strategies or inventory management. Therefore, ensuring data timeliness is paramount for accurate analysis and effective decision-making.