Business sponsors do not buy data quality. They buy reduced risk, avoided cost, or increased revenue. If the conversation about investing in data quality starts with technical checks and ends with “it’s a good practice,” the budget usually does not follow. The problem is not in the tools. It is in the fact that the data quality team cannot translate their work into numbers the sponsor understands.
This article shows how to build an ROI analysis for data quality that answers the question “how much are we losing without this” instead of “how much does the tool cost.” With concrete formulas, examples, and a principle that helps you avoid overpaying.
Table of Contents
Why ROI for data quality is hard to calculate
Data quality is a back-office practice. Its effects become visible only when something stops working. The sponsor does not see that a report was correct because a check stopped it. They only see that the report did not appear. This asymmetry makes it difficult to justify investment.
Data quality projects need a budget, and they can show their value by reporting progress and results. How do we measure that value? With data quality KPIs. The problem is that KPIs must be tied to money. The metric “95% checks passed” alone will not convince a sponsor. “95% checks passed, which means we avoided 200,000 in budget forecasting losses” will.
Step 1: Calculate the cost of bad data before you calculate the cost of the tool
The first number the sponsor should see is not the price of the platform. It is the cost of the problem the platform is meant to solve. DQOps proposes a concrete way to calculate it: take the percentage of invalid records in an area that affects financial decisions and translate it into an amount.
Example from the DQOps article on use cases: if 1% of records used for budget forecasting are invalid, and the annual budget in that area is $100 million, the potential cost of the error is $1 million per year. This is not an abstraction. It is a number the sponsor can verify and disagree with. And if they disagree, the conversation moves to facts, not opinions.
The same logic works for other quality dimensions. Delayed data can mean a missed sales opportunity. Inconsistent data across systems can lead to financial reporting errors. Invalid customer data can block KYC processes and generate compliance costs.
Step 2: Compare the cost of the problem with the cost of remediation, not the cost of the platform
This is where many teams make a mistake. The sponsor hears: “the tool costs X.” They should hear: “the problem costs 5X per year, and fixing it costs X.”
DQOps formulates a principle that provides a safety buffer: target problems where potential losses are at least five times greater than the cost of remediation. If the project cost is $200,000 and the annual losses from bad data in that area are $1 million, the project makes sense even if it does not achieve all its initial goals. Five to one is not greed. It is realism.
The cost of remediation is not just a license. It is people: the time of business users who know the domain, and the time of engineers who will implement the solution. It is also infrastructure if you choose on-premises deployment. DQOps is available as an open-source platform, which reduces the entry cost but does not eliminate the cost of people. And that is an honest assumption worth presenting to the sponsor.
Step 3: Define a KPI the sponsor will understand
The sponsor does not want to see “number of checks.” They want to see “percentage of valid records in a revenue-generating area” or “percentage of invoices that passed validation on the first attempt.” DQOps defines a data quality KPI as the percentage of passed checks among all executed checks. It is a simple formula that can be shown over time.
KPIs must be resistant to being challenged. There will always be a person, a data consumer, a data publisher, a manager of another team, or a business partner who will try to reject the KPI formula if it shows that their data is in poor shape. That is why the formula must be simple and repeatable. The percentage of passed checks is hard to dispute because it is based on facts: a check either passed or it did not.
However, it is important that the KPI is weighted by business impact. Not every check is equally important. A check on customer_id uniqueness is more important than a check on phone_number format if duplicate customers directly cause billing errors. DQOps allows you to assign severity to checks, which lets you distinguish critical issues from cosmetic ones.
Step 4: Show progress, not a perfect state
The sponsor does not expect data to be perfect from day one. They expect it to be better than last quarter. That is why the KPI should be reported as a trend, not as a single number.
The narrative that works best is based on a sequence: baseline 60%, after three months 90%, after another month the data should be clean. This narrative works because it shows that the investment produces results over time. The sponsor sees that their money did not disappear into a black hole of “quality improvement,” but moved the metric from point A to point B.
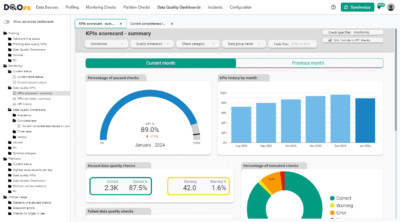
DQOps provides dashboards that show KPIs over time, per table, and per quality dimension. This is not an argument for a specific tool. It is an argument for reporting progress in a way the sponsor can track without the help of a data engineer.
Step 5: Avoid overpaying by focusing on one area
The most common way to overpay for data quality is trying to do everything at once. The platform is bought, checks are configured on all tables, and after six months it turns out that 80% of checks cover tables nobody uses for business decisions.
DQOps proposes prioritization: start with the tables that generate the largest losses, and expand only when the first area works. From the sponsor’s perspective, this means the first tranche of budget goes to the problem with the highest return. If the project does not deliver results, the loss is limited. If it does, the sponsor has proof that it is worth continuing.
Example: how to present it to a sponsor in three sentences
“In the budget forecasting area, 1% of records are invalid, which with a $100 million budget means a risk of up to $1 million per year. The project to fix this area costs $200,000 and should raise the KPI from 60% to 90% within a quarter. If we do not reach the goal, the loss is limited to the project cost, which is five times smaller than the potential cost of the error.”
This is not marketing copy. It is a business justification the sponsor can evaluate based on numbers, not trust in the data quality team.
Summary
ROI for data quality is not about showing how much the tool costs. It is about showing how much the problem costs that the tool is meant to solve, and how to measure that the problem has been solved. Three numbers: the cost of bad data, the cost of remediation, and the KPI over time. If these three numbers are consistent, the sponsor does not need to believe in data quality. They just need to be able to read.
Data quality best practices - a step-by-step guide to improve data quality
- Learn the best practices in starting and scaling data quality
- Learn how to find and manage data quality issues
What is the DQOps Data Quality Operations Center
DQOps is a data quality and observability platform designed to monitor data and assess the data quality trust score with data quality KPIs. DQOps provides extensive support for configuring data quality checks, applying configuration by data quality policies, detecting anomalies, and automatically finding patterns using machine learning. DQOps supports over 150+ data quality checks, which cover all popular formats used in data conformance testing.
DQOps is a platform that combines the functionality of a data quality platform to perform the data quality assessment of data assets. It is also a complete data observability platform that can monitor data and measure data quality metrics at a table level to measure its health scores with data quality KPIs.
You can set up DQOps locally or in your on-premises environment to learn how DQOps can monitor data sources and ensure data quality within a data platform. Follow the DQOps documentation, go through the DQOps getting started guide to learn how to set up DQOps locally, and try it.
You may also be interested in our free eBook, “A step-by-step guide to improve data quality.” The eBook documents our proven process for managing data quality issues and ensuring a high level of data quality over time. This is a great resource to learn about data quality.