Unstructured data is the “Wild West” of data management. PDFs, scans, emails, presentations. For years, data quality teams could ignore them because you cannot run null_count or duplicate_count on them. It was enough to say: “it’s not a table, not our problem.”
That has changed. LLMs can extract entities, dates, amounts, and identifiers from PDFs. RAG (Retrieval-Augmented Generation) turns those documents into a source of answers for chatbots and search systems. And suddenly unstructured data demands the same quality discipline as tables in a warehouse. Except the tools and methods have to be different.
This article shows how to approach data quality for unstructured data: from LLM-based entity extraction, through document scoring, to filtering sources in a RAG pipeline.
Table of Contents
Why unstructured data is harder than tables
In a table, you have columns. You can count what percentage of values in the email column are empty. You can check whether order_id is unique. Unstructured data has no columns. A PDF has no schema. A scanned invoice has no data type.
Piotr Czarnas puts it plainly: “You can’t count nulls in a column, there are no columns. That’s the problem”. This does not mean unstructured data cannot be monitored. It means monitoring requires an intermediate step: you first have to create a structure you can measure.
Step 1: Entity extraction as the foundation of data quality
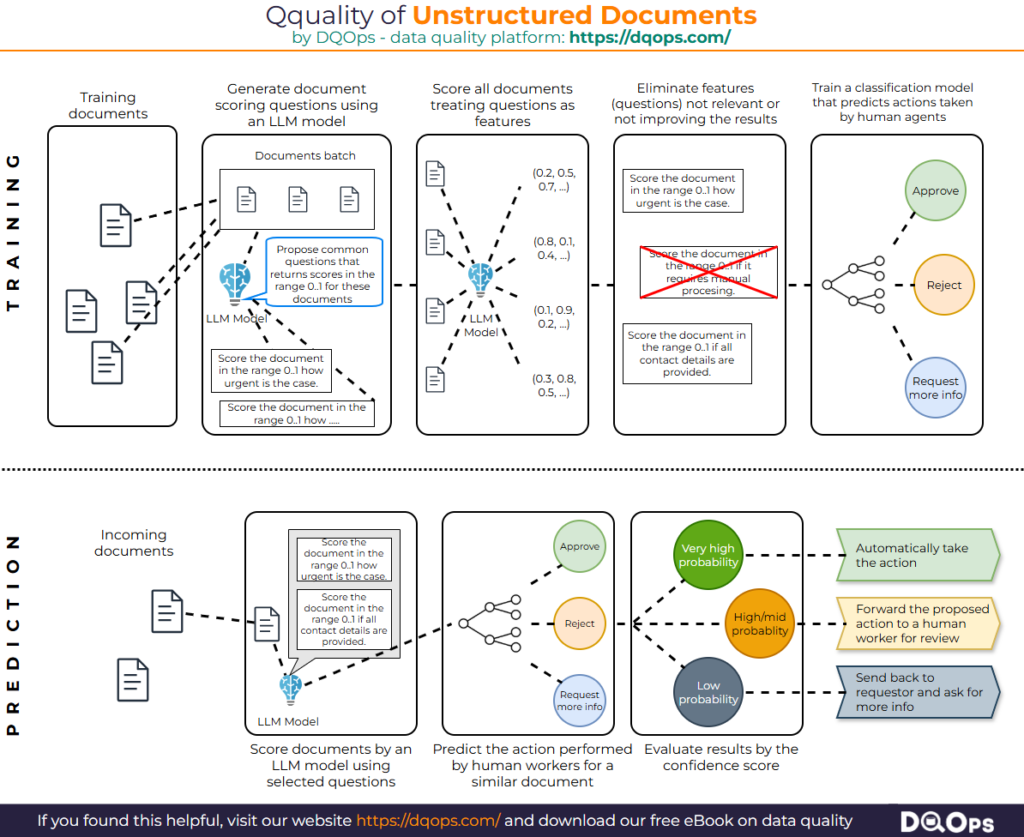
Before you can monitor the quality of PDFs, you have to extract what can be measured. An LLM can read a document and return a structured JSON: invoice issue date, amount, tax ID, contract number. This is not “AI for AI’s sake.” It is a way to turn an unstructured document into a semi-structured record that checks can run against.
Piotr describes this as “turning unstructured data into semi-structured data because your automation platforms can operate only on structured information”. The key question is: what happens when the LLM extracts a wrong value? What if a new model version finds only 20% of emails when the previous one found 99.9%? That is a data quality problem. And it has to be measured.
Step 2: Document scoring as a measure of trust
Extraction alone is not enough. You need a way to assess whether a document is fit for use in a pipeline. Piotr proposes a simple rule: “Calculate a quality score for each document, then use it in RAG”.
What can go into such a score? Examples:
Extraction completeness: did the LLM extract all required fields, or are some empty?
Internal consistency: is the document date earlier than the extraction date? Does net amount plus VAT equal gross amount?
Format: does the tax ID have 10 digits? Is the date in ISO format?
Model confidence: if the LLM returns a field with low confidence, the document gets a lower score.
DQOps provides checks that can be applied to extracted fields. For example, text_parsable_to_date_percent verifies whether values in a text column can be parsed as dates. If the LLM extracted a date as “December 18th, 2024” instead of “2024-12-18”, the check will catch it.
Step 3: Filtering RAG by document score
This is where data quality for unstructured data stops being theoretical. In a RAG pipeline, documents are retrieved from a vector database based on similarity to the query. If a document with a low quality score made it into the database, the model may generate an answer based on bad data.
Piotr puts it bluntly: “RAG without DQ is a lottery. With DQ, you know which sources are reliable” . The solution is simple to describe and hard to implement: filter documents by score before adding them to the vector database or before retrieving them in response to a query. Documents with low scores should not be considered, even if they are semantically similar to the question.
This reverses the traditional way of thinking about data quality. The goal is not to “fix” the PDF. The goal is to know which PDFs can be trusted, and to make decisions based on that trust.
Step 4: Monitoring model and data drift
LLM extraction is not static. The model changes. The documents change. An invoice format from a vendor can change without warning. What worked in January may not work in March.
Piotr lists drift monitoring as one of the main applications of AI in data quality: “Monitor data over time to detect data drifts, anomalies, or data pipeline failures”. In the context of unstructured data, this means tracking whether the percentage of correctly extracted fields is declining over time. If suddenly 30% of invoices have an empty tax ID field, that is a signal that something changed: either the model, or the document format, or both.
DQOps supports anomaly detection in metrics, including changes in values over time. You can monitor the average document score over the last 30 days and compare it to a historical baseline. A drop in average score is an alert.
Limitations and an honest assessment
This is not a perfect solution. LLMs can be wrong. Document scoring based on LLMs can be wrong too. There is no guarantee that a high-score document is 100% correct.
But that is not an argument against monitoring. It is an argument for treating the score as a prioritization tool, not as absolute truth. Documents with the lowest scores should go to manual review. Documents with high scores can be used in RAG with greater confidence, but not with absolute certainty.
Summary
Data quality for unstructured data is not about “cleaning PDFs.” It is about creating a structure you can measure, assigning each document a trust score, and using that score in a RAG pipeline. It requires LLMs for extraction, checks for validation, and monitoring for drift detection. But above all, it requires a shift in mindset: unstructured data is not “not our problem.” It is a problem that just became ours.
Data quality best practices - a step-by-step guide to improve data quality
- Learn the best practices in starting and scaling data quality
- Learn how to find and manage data quality issues
What is the DQOps Data Quality Operations Center
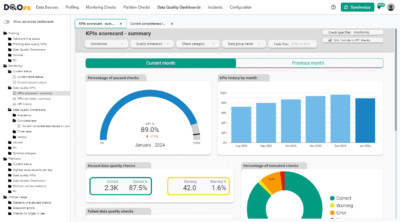
DQOps is a data quality and observability platform designed to monitor data and assess the data quality trust score with data quality KPIs. DQOps provides extensive support for configuring data quality checks, applying configuration by data quality policies, detecting anomalies, and automatically finding patterns using machine learning. DQOps supports over 150+ data quality checks, which cover all popular formats used in data conformance testing.
DQOps is a platform that combines the functionality of a data quality platform to perform the data quality assessment of data assets. It is also a complete data observability platform that can monitor data and measure data quality metrics at a table level to measure its health scores with data quality KPIs.
You can set up DQOps locally or in your on-premises environment to learn how DQOps can monitor data sources and ensure data quality within a data platform. Follow the DQOps documentation, go through the DQOps getting started guide to learn how to set up DQOps locally, and try it.
You may also be interested in our free eBook, “A step-by-step guide to improve data quality.” The eBook documents our proven process for managing data quality issues and ensuring a high level of data quality over time. This is a great resource to learn about data quality.