Data volume is the total quantity of data that is stored, processed, and transmitted. Measurement units include bytes (kilobytes, megabytes, gigabytes, terabytes, and beyond) and the number of records (such as rows in a database or files). Data volume has a major impact on data management requirements, including storage capacity, processing resources, and the complexity of data handling procedures.
You can monitor data volume for free
Before you continue reading, DQOps Data Quality Operations Center is a data quality platform that monitors data volume. You can detect empty tables, outdated tables, or anomalies in data.
Please refer to the DQOps documentation to learn how to start detecting data quality issues for free.
Why Monitoring Data Size is Important
Effectively managing the size of data is crucial for both IT cost optimization and overall operational efficiency. Uncontrolled data growth leads to higher storage costs, whether on-premises or in the cloud. Additionally, excessive data size, especially when it includes unnecessary duplicates or outdated information, negatively impacts workforce productivity.
When data is poorly managed, employees spend more time searching for the information they need. For example, if old records aren’t archived, searches retrieve excessive results, forcing users to manually sift through irrelevant information. This decreases efficiency and increases labor costs associated with data retrieval.
By actively monitoring and managing the size of data, organizations can mitigate these issues. Implementing data retention policies, archiving historical data, and eliminating redundant copies reduces storage costs and improves data accessibility. This ensures that users can quickly find the relevant, current information they need to perform their tasks effectively.
Handling Data Size Isues
A major challenge with large datasets is storage cost. As data size increases, organizations need more storage capacity. This means they must either buy more disk drives for their own data centers or pay for more cloud storage. Both options increase costs.
However, the dynamic nature of data volume, particularly the growth of actively used data (like new transactions or invoices), can reveal valuable insights into business processes and data systems. By tracking the rate of data volume growth, we can identify potential issues early on.
For instance, stagnant data volume over extended periods might signal that data generation has ceased, rendering the data outdated. Conversely, unexpected fluctuations in the size of tables could indicate technical issues in data loading or changes in business processes. An abrupt decline might even suggest an application has been decommissioned, yet IT resources continue to be allocated to managing this now-redundant data asset.
The Difference Between Data Volume and Data Variety
Both data volume and data variety are important factors to consider when assessing the overall size and complexity of data. While they both relate to the “size” of data, they represent different perspectives:
Data Variety
Data variety refers to the number of different types of data an organization stores and manages. It encompasses the various formats in which data exists, including copies, alternative formats, archives, and exported data that might be stored redundantly. In the context of data management, data variety also considers the number of data sources, datasets, and database tables stored across databases, data warehouses, and data lakes.
Even if the total size of all data assets is relatively small, the variety of files or their types can still create management challenges. For example, a company might have a small volume of data, but if it’s spread across numerous formats, sources, and systems, managing and integrating that data can be complex.
Data Volume
Data volume focuses on the total amount of data. It can be related to the total size of a database measured in disk space or the number of records. A single large file or database table can be responsible for a significant portion of an organization’s total data volume.
For example, many companies track website activity in log files or dedicated database tables. These logs often record a vast number of events, including searches, page views, and even minor user interactions. This can consume substantial disk space and contribute significantly to the overall size of data.
Impact of Data Volume and Variety on Data Management
- Storage and Processing: Large datasets require significant storage capacity and processing power. This can increase costs and complexity, especially for operations that involve reading and analyzing large datasets.
- Database Performance: Large tables can slow down database queries and reporting. Even with indexes, searching and filtering through extensive datasets can be time-consuming. For example, a transaction history table spanning ten years might require complex indexing strategies to optimize query performance. Too many indexes, however, can also negatively impact database performance and increase the overall data volume.
- Data Analysis: Analyzing large and varied datasets requires specialized tools and techniques. Data analysts need to be able to efficiently extract, transform, and load (ETL) data from various sources and formats.
Key Considerations
- Monitoring: It’s crucial to monitor both data volume and data variety to understand data growth patterns and identify potential issues.
- Optimization: Organizations should implement strategies to optimize data storage, processing, and analysis. This might include data compression, deduplication, archiving, and data lifecycle management.
- Data Governance: Establish clear policies and procedures for data management, including data retention, archiving, and deletion.
What is Stale Data
Stale data refers to data that is outdated and no longer accurately reflects the current situation. Determining whether data is stale requires careful consideration of various factors, including how recently it was updated, how frequently it changes, and how it’s being used. Not all old data is necessarily stale; some data, like historical records, can remain relevant for extended periods.
How to Identify Stale Data
To determine whether data is stale, several key aspects need to be evaluated:
- Data Freshness: This involves assessing how recently the data was updated. Data that hasn’t been updated for a considerable time might be considered stale, especially if it’s used for time-sensitive analysis or decision-making. For example, real-time stock market data becomes stale within seconds, while customer contact information might become stale over months or years.
- Data Volatility: This factor considers how frequently the data changes. Highly volatile data, such as social media trends or sensor readings, becomes stale quickly. In contrast, static data, like historical archives or reference tables, remains relevant for much longer periods. A small reference table containing a list of country codes, for instance, is unlikely to change frequently and wouldn’t be considered stale even if it hasn’t been updated recently.
- Data Usage: How the data is used plays a crucial role in determining its staleness. Data actively used for operational processes or critical decision-making needs to be current. Data used infrequently or for historical analysis might not require frequent updates. For example, a table storing active customer orders needs to be up-to-date, while a table archiving completed orders from the past decade might not.
Impact of Stale Data
Stale data can have significant negative consequences for organizations:
- Poor Decision-Making: Decisions based on outdated information can be misleading and lead to undesirable outcomes. For example, using outdated sales data to forecast future demand can result in inaccurate predictions and poor inventory management.
- Reduced Operational Efficiency: Stale data can hinder operational processes, leading to errors, delays, and increased costs. Inaccurate customer information, for instance, can lead to misdirected deliveries, incorrect billing, and frustrated customers.
- Lost Revenue: Inaccurate data can result in missed opportunities, lost sales, and decreased profitability. For example, stale marketing data can lead to irrelevant campaigns that fail to reach the target audience, resulting in wasted resources and lost revenue.
- Compliance Risks: Using stale data for regulatory reporting or audits can result in non-compliance and potential penalties. Financial institutions, for example, need to maintain accurate and up-to-date customer data to comply with anti-money laundering (AML) and know-your-customer (KYC) regulations.
Managing Stale Data
To mitigate the risks associated with stale data, organizations should implement proactive data management strategies:
- Data Monitoring: Regularly monitor data freshness and usage patterns to identify potentially stale data. This can involve tracking update timestamps, analyzing access logs, and monitoring data usage metrics.
- Data Quality: Implement data quality checks and validation rules to ensure data accuracy and completeness. This includes data profiling, cleansing, and standardization to maintain data integrity.
- Data Retention Policies: Establish clear policies for data retention, archiving, and deletion to manage the data lifecycle and minimize staleness. This ensures that data is stored and managed according to its relevance and business value.
- Data Governance: Implement data governance frameworks to ensure data quality, consistency, and accessibility across the organization. This involves defining roles, responsibilities, and processes for data management to ensure accountability and compliance.
How to Monitor Data Volume
Effectively managing the size of data requires ongoing monitoring to track growth trends, identify potential issues, and optimize data storage and processing. Monitoring data volume involves tracking various metrics to understand how much data is being generated, stored, and processed. This includes monitoring the size of individual data assets, such as files and database tables, as well as the overall data volume across the organization’s data infrastructure.
In systems like databases and data lakes, it’s essential to monitor not only the raw volume of data but also the number of datasets, their row counts, and the variety of datasets. A proliferation of datasets, even if the total data size remains relatively constant, can increase complexity and make data discovery and management more challenging for users. Therefore, monitoring data variety, alongside data size, is crucial for maintaining a well-organized and efficient data environment. This is particularly important for critical data assets, such as frequently accessed tables used for analytics or by business applications, where changes in volume or variety can significantly impact performance and usability.
Monitoring Data Size
Monitoring data size is fundamental to understanding and managing data volume. At its core, it involves tracking the amount of storage space occupied by data, which can be measured by counting rows in databases, records in files, or the total file size. This provides a snapshot of the current data volume at a specific moment. For example, you might check the size of a database every day to see how much storage it’s using.
However, to gain a more comprehensive understanding of data volume dynamics, organizations often utilize data observability tools. These tools go beyond simple point-in-time measurements and provide deeper insights into data trends and patterns. They achieve this by:
- Continuous Monitoring: Data observability tools capture data volume metrics at regular intervals, such as hourly or daily, and store this historical data. This allows for the analysis of data volume trends over time, rather than just a single snapshot.
- Data Timeliness: In addition to tracking the raw size of data, these tools also monitor the age of the most recent record, providing insights into data freshness. For example, if the newest record in a customer transaction table is from several months ago, it might indicate that the data is not being updated regularly and could be stale. This is particularly important for operational data that needs to be current.
- Anomaly Detection: Data observability platforms can identify unusual patterns or significant deviations in data volume. This can help detect data quality issues that might arise from various sources, such as technical errors, data integration problems, or changes in business processes. For example, a sudden spike in the size of a log file might indicate a system error or unexpected surge in user activity.
By combining continuous monitoring, data timeliness analysis, and anomaly detection, data observability tools provide a comprehensive view of data size and its changes over time. This enables organizations to:
- Proactively identify potential issues: By detecting unusual data volume patterns, organizations can address problems before they impact business operations.
- Optimize data storage and processing: Understanding data volume trends helps optimize resource allocation and plan for future storage needs.
- Improve data quality: By identifying anomalies and inconsistencies in data size, organizations can investigate and address underlying data quality issues affecting data assets.
- Enhance data governance: Monitoring data size helps ensure compliance with data retention policies and regulatory requirements.
Monitoring Data Variety
Monitoring data variety focuses on tracking the different types of data within your systems. This includes monitoring the number of datasets, data sources, and formats. In databases and data lakes, this often involves scanning metadata, such as the “information schema,” to identify new or updated tables and schemas. This helps you understand how the variety of data is evolving over time and whether it’s becoming more complex or fragmented.
Additionally, tracking data usage provides valuable context for understanding data variety. By monitoring how often different datasets are accessed and updated, you can identify potentially stale or obsolete data. For example, tables that were created but never updated or used only once might indicate data that is instantly stale. This poses a risk because unaware users might utilize this data without understanding its origin or any filters applied during its creation, potentially leading to incorrect analysis or decisions.
Monitoring data variety offers several benefits:
- Improved Data Discoverability: Tracking the different types of data makes it easier for users to find and understand the data they need.
- Enhanced Data Quality: By identifying and addressing inconsistencies or redundancies in data variety, you can improve the overall quality and reliability of your data.
- Reduced Complexity: Monitoring data variety helps you understand and manage the complexity of your data landscape, making it easier to maintain and govern.
- Increased Efficiency: By understanding how data variety impacts data usage and access patterns, you can optimize data storage, processing, and retrieval for greater efficiency.
Typical Data Volume Change Issues
By measuring day-to-day or hour-to-hour changes in data volume, it’s possible to detect signs of other problems in data management. The most common issues and how they appear in data volume change graphs are listed below:
- Delayed data: This can be detected by observing that the data volume is not increasing, meaning no new records are being added, and the most recent data is likely outdated. This is also known as a data timeliness issue.
- Data loss: This can be detected by identifying when the data volume drops. If we expect new data to be loaded continuously into a dataset and its size decreases, it could mean intentional deletion or some other failure caused the decrease. Copies of data used for analytics, which are often fully reloaded, can decrease in size when the data transformation logic changes, and not all records are included in the refresh.
- Missing inserts: This is a common problem in databases. A change to the table schema can cause new records from a source to be rejected due to schema mismatch. Additionally, if new records contain values too large to fit into the schema, these values or entire records might be dropped. Missing records can be detected by noticing a decrease in the average growth of volume.
- Data volume spike: This is a sudden increase in data size. In many cases, it’s a positive event, such as data from another business unit or country being loaded into the global data store. However, a data volume spike not related to an expected business event could be caused by data processing errors that result in loading data multiple times, generating duplicate records. Data affected by duplication will cause problems for analytics, with total numbers being higher than expected, and the cost of data storage will also increase.
The graph of data volume changes over time, illustrating these issues, is shown below.
How to Use Anomaly Detection to Detect Data Volume Changes
Unexpected changes in data volume can signal underlying issues that require immediate attention. These changes might be caused by various factors, such as:
- Data loading errors: Loading duplicate data or accidentally deleting data can lead to significant and unexpected changes in data volume.
- System glitches: Technical problems with data pipelines or storage systems can also cause data volume fluctuations.
- Unforeseen events: External events, such as a sudden surge in website traffic or a data breach, can also trigger unexpected data volume changes.
Manually identifying these issues can be time-consuming and challenging. This is where data observability tools with anomaly detection capabilities come in. These tools, such as DQOps, automate the process of detecting unusual data volume changes, enabling proactive data quality management and faster issue resolution.
How Anomaly Detection Works
Data observability tools utilize machine learning algorithms to analyze historical data volume metrics, such as the daily or hourly row count in a database table. By establishing a baseline of typical data volume changes, these tools can identify outliers – data volume increases or decreases that deviate significantly from the expected patterns.
Here are some common anomaly detection methods used for data volume monitoring:
- Simple Rules: This involves setting thresholds for data volume changes. For example, an alert might be triggered if the data volume increases or decreases by more than 10% within a specific time frame.
- Z-Score: This statistical method calculates how many standard deviations a data point is from the mean. Data volume changes that exceed a certain Z-score threshold are flagged as anomalies. This method is effective for detecting significant data volume changes but might not be sensitive to smaller fluctuations.
- Seasonality: This approach takes into account recurring patterns in data volume, such as daily or weekly cycles. By considering these patterns, the anomaly detection algorithm can identify unusual changes even during periods with typically low or high data volume, such as weekends or holidays.
Benefits of Anomaly Detection for Data Volume
- Early issue detection: Anomaly detection helps identify data volume changes in real-time or near real-time, allowing for prompt investigation and resolution.
- Reduced manual effort: Automating the detection of data volume anomalies frees up data teams from manual monitoring tasks.
- Improved data quality: By quickly identifying and addressing data volume issues, organizations can maintain data quality and prevent downstream problems.
- Enhanced data governance: Anomaly detection helps ensure data integrity and compliance with data management policies.
By incorporating anomaly detection into their data volume management strategy, organizations can proactively identify and address data volume issues, ensuring data quality, reliability, and operational efficiency.
How to Reduce Data Volume
Reducing data volume is crucial for optimizing storage costs, improving data management efficiency, and ensuring data quality. This can be achieved by addressing both the variety of data types and the volume of active data.
Reducing Data Variety
One approach to reducing data volume is to decrease the variety of data types by eliminating redundant or obsolete data. This might involve:
- Removing stale data: Identify and delete data that is no longer relevant or useful, such as outdated reports, old versions of files, or unused datasets.
- Consolidating data sources: Combine data from multiple sources into a single, centralized repository to reduce redundancy and improve data consistency.
- Standardizing data formats: Convert data into a common format to simplify data management and analysis.
Reducing Data Volume in Active Tables
Another strategy is to reduce the volume of active data by archiving or partitioning large tables. This can be done by:
- Creating archive tables: Move older or less frequently accessed data to separate archive tables. This keeps the active tables smaller and improves query performance. For example, you might move customer transaction data older than one year to an archive table.
- Partitioning tables: Divide large tables into smaller partitions based on criteria like date ranges or customer segments. This allows for more efficient querying and data management.
Data Reduction Process
Before embarking on any data reduction initiative, it’s crucial to follow a systematic process:
- Data Ownership: Identify the owner of the data asset and obtain their approval before making any changes. This ensures that critical data is not inadvertently deleted or archived.
- Data Value Assessment: Determine the value of the data, even if it’s not currently being used. Consult with data analysts, data scientists, and business users to understand potential use cases.
- Data Usage Analysis: Analyze data usage patterns to identify active and inactive data. This can be done by examining access logs, query history, or using data observability tools.
- Backup and Recovery: Before deleting, archiving, or truncating data, create backups to prevent data loss in case of errors or unexpected issues.
Important Considerations
- Data Retention Policies: Adhere to organizational data retention policies and regulatory requirements when deleting or archiving data.
- Data Security: Ensure that data security and privacy are maintained throughout the data reduction process.
- Communication: Communicate data reduction plans to relevant stakeholders to avoid disruptions or confusion.
Data Volume Management
Effective data volume management is an ongoing process that requires a comprehensive strategy and a clear set of procedures. It involves defining how an organization will monitor, control, and optimize data volume throughout its lifecycle. A robust strategy should encompass the following areas:
Data Management Strategy
This part of the strategy outlines the organization’s approach to managing data volume. It should include:
- Data Ownership: Clearly define how data ownership is established and maintained. This ensures that there’s a responsible party for each data asset who can make informed decisions about its management.
- Critical Data Identification: Identify critical datasets that are essential for business operations or have a tendency to grow significantly. These datasets should be prioritized for monitoring and optimization.
- Data Classification: Classify data based on its sensitivity, importance, and regulatory requirements. This helps determine appropriate data retention policies and security measures.
Data Monitoring Strategy
The data volume monitoring strategy defines how the organization will monitor data volume to detect issues and trends:
- Monitoring Scope: Specify which data assets will be monitored and the frequency of monitoring.
- Monitoring Metrics: Define the key metrics that will be tracked, such as:
- Data volume anomalies: Significant deviations from normal data growth patterns.
- Data volume daily growth: The rate at which data volume is increasing.
- Data freshness: How recently data has been updated.
- Data staleness: Identify unused or outdated data.
- Data usage: Track how often data is accessed and by whom.
- Monitoring Tools: Identify the tools and technologies that will be used for data volume monitoring, such as data observability platforms, database monitoring tools, and log analysis systems.
Data Retention and Archival Strategy
Establish a clear and repeatable process for data archival or deletion, including the following steps:
- Identify data owner: Confirm that the data is no longer required for operational purposes.
- Review data volume: Assess if the data volume is impacting performance or storage costs.
- Review data timeliness: Determine if the data is actively being updated.
- Identify data copies: Find out if redundant copies of the data exist.
- Analyze data usage: Confirm that the data is not actively being used.
- Notification process: Inform relevant users about the planned archival or deletion.
- Backup: Create a backup of the data before archival or deletion.
- Archive or delete: Move the data to an archive or delete it according to data retention policies.
- Update documentation: Update any related documentation, such as data catalogs or data dictionaries.
Benefits of Effective Data Volume Management
- Reduced storage costs: By optimizing data storage and eliminating redundant data, organizations can reduce storage costs.
- Improved data quality: Regular monitoring and data cleansing activities can improve data quality and reliability.
- Enhanced data governance: A clear data volume management strategy helps ensure compliance with data retention policies and regulations.
- Increased efficiency: Efficient data management practices can improve data accessibility and streamline data analysis processes.
How to Handle Data Volume Issues
Data observability tools are typically managed by data operations or data engineering teams, who are equipped to investigate and resolve technical issues that may be causing data volume problems.
When a new data volume issue is detected, a data observability platform automatically creates a data quality incident and assigns it to the appropriate team. Team members are then notified about the incident and can take action by reviewing the data and verifying the recent data volume changes.
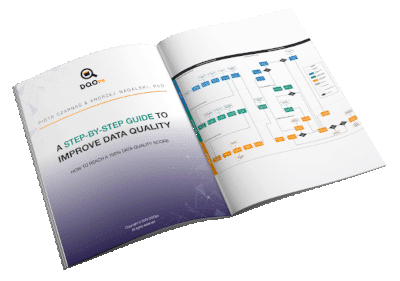
Data quality best practices - a step-by-step guide to improve data quality
- Learn the best practices in starting and scaling data quality
- Learn how to find and manage data quality issues
What is the DQOps Data Quality Operations Center
DQOps is a data observability platform designed to monitor data and assess the data quality trust score with data quality KPIs. DQOps provides extensive support for configuring data quality checks, applying configuration by data quality policies, detecting anomalies, and managing the data quality incident workflow.
DQOps is designed to allow non-technical users to easily set up data volume monitoring and configure the whole data quality incident workflow to notify the first-level support team to review and assess data volume changes and to forward the issues to the implementation team that can react to the incident and ensure that problems with missing, outdated or duplicate data are resolved on time.
You can set up DQOps locally or in your on-premises environment to learn how DQOps can monitor data sources and ensure data quality within a data platform. Follow the DQOps documentation, go through the DQOps getting started guide to learn how to set up DQOps locally, and try it.
You may also be interested in our free eBook, “A step-by-step guide to improve data quality.” The eBook documents our proven process for managing data quality issues and ensuring a high level of data quality over time. This is a great resource to learn about data quality.