When collecting various sorts of data, we usually keep track of the date the data was collected.
But, in terms of data observability, what matters most is when the data was uploaded and whether it is current.
Assume we’re using a scheduler, such as Airflow that delivers revenue data to the database at the end of the day. The data import may fail if we do not specify a timeout for a certain task in DAG, or if we choose a timeout that is too short. One task might crash and the subsequent one won’t launch. As a consequence, we don’t have data for today, which creates a dilemma. It is crucial to do regular timeliness checks to avoid this from occurring.
The consistency of these types of data sets is critical. Before you begin any analysis, double-check that the data is current and free of gaps. Such failures can be caused by a variety of factors, including a lost connection during insertion, a failure to send data on time, or a loss of access to a database (due to a change of location or permissions). They all imply that the data might not be uploaded in a timely manner, resulting in inaccurate analysis results.
Timeliness checks are aimed at verifying whether the data is up to date, there is no delay in loading files into the databases, or whether it does not take too much time.
We will use electricity load data, which should be updated every 15 minutes.
We will get the data timeliness information, by extracting the delays between each two, neighboring record’s time stamps. Then we will save them in the result table and see if the data is current.
Before you continue reading, DQOps Data Quality Operations Center is a data quality platform that supports all types of timeliness checks. DQOps both tracks the current data timeliness delays on dashboards and measures the data timeliness reliability by tracking timeliness KPI scores. Please refer to the DQOps documentation to learn how to start tracking timeliness.
Table of Contents
What is data timeliness
The data timeliness dimension checks whether the data is current. A measure of this dimension is the time between when the data is expected to appear and when it is available. The principles of when to perform a timeliness check are dictated by the time when we expect a new batch of data.
There are a couple of different checks that you can associate with timeliness. The most fundamental one is controlling data to be up to date. For example, you can check if the data emerges regularly, find out the interval of two events (for example, the date of data arrival and the tests upon it), etc. You can read more about different types of data timeliness checks in a dedicated blog post.
When executing data timeliness checks, everything may appear to be fine – the data is processed regularly without any errors. So, one might question:
Why do we need the test if everything is correct?
In the majority of cases, it is risky to assume that the dataset is flawless.
In the real-world scenario, there is a procedure for determining whether everything is correct regarding timeliness and other data quality dimensions.
As we discussed earlier, timeliness is a dimension we should test regularly. Constant information over data flow is a major aspect of data observability. If we observe incorrectness in timeliness, it is a sign that some issues might appear.
Another aspect regarding data quality is tracking data timelines. A high freshness level of the data indicates uninterrupted data processing at stages up to the current one we use.
In the following example, we will show how to manually calculate the delay between the current and previous timestamps.
Technologies we use
In this example, we will use BigQuery – a serverless data warehouse hosted on the Google Cloud Platform.
In BigQuery, when we refer to a table, the syntax is as follows (keep in mind this part:):
`[project_name].[dataset_name].[table_name]`.
The dataset
The data set can be obtained here, where you can find the details.
It describes the energy consumption of individual clients. The first column is a timestamp, which indicates the time of the measurement. The interval between measurements should be regular and equal to 15 minutes. The rest of the columns are clients marked as “MK_i”, where “i” takes values from 001 to 370, so there are 371 columns in total.
Here are some exemplary records from the table. As you can see, the “MT_001” column contains only values equal to 0.0 for these timestamps. There are two examinations: the client did not exist at that time (in some cases, there would be NULL values), or it did not consume any energy.

The solution
First things first, let’s extract the row’s timestamp, day_of_tested_data which will be an aggregation unit (in the further queries), and order the records by the date.
					SELECT timestamp_field_0 AS present_timestamp,
	DATE(FORMAT_TIMESTAMP("%Y-%m-%d", timestamp_field_0)) AS day_of_tested_data
FROM `dqo-learning.data_quality.electricity_load_diagrams`
ORDER BY present_timestamp ASC

For further delay calculation purpose, we are about to append a previous date to each row, as follows:
					SELECT timestamp_field_0 as present_timestamp,
	LAG(timestamp_field_0) OVER (
		ORDER BY timestamp_field_0 ASC
	) AS preceding_timestamp,
	DATE(FORMAT_TIMESTAMP("%Y-%m-%d", timestamp_field_0)) AS day_of_tested_data
FROM `dqo-learning.data_quality.electricity_load_diagrams`
ORDER BY present_timestamp ASC

The preceding_timestamp for the first row is NULL, which is fine because the first row of the whole dataset does not have a preceding value.
Let’s calculate the delay between the current and previous timestamps. Keep in mind that the time difference does not make sense for the row with NULL. Filter it out using the WHERE statement.
					WITH dq_check_preparation AS (
	SELECT timestamp_field_0 AS present_timestamp,
		LAG(timestamp_field_0) OVER (
			ORDER BY timestamp_field_0 ASC
		) AS preceding_timestamp,
		DATE(FORMAT_TIMESTAMP("%Y-%m-%d", timestamp_field_0)) AS day_of_tested_data
	FROM `dqo-learning.data_quality.electricity_load_diagrams`
)
SELECT present_timestamp,
	preceding_timestamp,
	TIMESTAMP_DIFF(present_timestamp, preceding_timestamp, MINUTE) AS value -- the delay
,
	day_of_tested_data
FROM dq_check_preparation
WHERE preceding_timestamp IS NOT NULL
ORDER BY present_timestamp

As you can see, we got values that are delayed between records described in minutes.
Next, remove both timestamps and extract the maximum delay from each day.
					WITH dq_check_preparation AS (
	SELECT timestamp_field_0 as present_timestamp,
		LAG(timestamp_field_0) OVER (
			ORDER BY timestamp_field_0 ASC
		) AS preceding_timestamp,
		DATE(FORMAT_TIMESTAMP("%Y-%m-%d", timestamp_field_0)) as day_of_tested_data
	FROM `dqo-learning.data_quality.electricity_load_diagrams`
)
SELECT MAX(
		TIMESTAMP_DIFF(present_timestamp, preceding_timestamp, MINUTE)
	) AS value -- the delay
,
	day_of_tested_data
FROM dq_check_preparation
WHERE preceding_timestamp IS NOT NULL
GROUP BY day_of_tested_data
ORDER BY day_of_tested_data

And save outputs to a specially prepared result table.
If you are curious about how to create such a table in BigQuery, you can read our blog, “How to store the data quality results.”
The whole query that accesses tested table rows calculates and stores the results.
					INSERT INTO `dqo-learning.data_quality.dq_check_results` (
		uuid,
		tested_resource,
		test_name,
		value,
		created_time,
		day_of_tested_data
	) WITH dq_check_preparation AS (
		SELECT timestamp_field_0 AS present_timestamp,
			LAG(timestamp_field_0) OVER (
				ORDER BY timestamp_field_0 ASC
			) AS preceding_timestamp,
			DATE(FORMAT_TIMESTAMP("%Y-%m-%d", timestamp_field_0)) AS day_of_tested_data
		FROM `dqo-learning.data_quality.electricity_load_diagrams`
	),
	delay_extraction AS (
		SELECT MAX(
				TIMESTAMP_DIFF(present_timestamp, preceding_timestamp, MINUTE)
			) AS value -- the delay
,
			day_of_tested_data
		FROM dq_check_preparation
		WHERE preceding_timestamp IS NOT NULL
		GROUP BY day_of_tested_data
		ORDER BY day_of_tested_data
	)
SELECT GENERATE_UUID() AS uuid,
	'dqo-learning.data_quality.electricity_load_diagrams' AS tested_resource,
	'max_delay_in_minutes' AS test_name,
	value,
	CURRENT_TIMESTAMP() AS created_time,
	day_of_tested_data
FROM delay_extraction
We can now run queries on the inserted data.
					SELECT *
FROM `dqo-learning.data_quality.dq_check_results`
WHERE tested_resource = 'dqo-learning.data_quality.electricity_load_diagrams'
    AND test_name = 'max_delay_in_minutes'
    AND created_time >= '2021-12-14T13:00:00'
ORDER BY day_of_tested_data

And finally, filter readings to discover the data correctness.
					SELECT *
FROM `dqo-learning.data_quality.dq_check_results`
WHERE tested_resource = 'dqo-learning.data_quality.electricity_load_diagrams'
    AND test_name = 'max_delay_in_minutes'
    AND created_time >= '2021-12-14T13:00:00'
    AND value > 15
ORDER BY day_of_tested_data
This results in the following message:

This means there is no delayed row, which might not be understandable at first sight, so redefine the SQL to be more argumentative.
					SELECT SUM(
        CASE
            WHEN value <= 15 THEN 1
            ELSE 0
        END
    ) AS timely_days,
    SUM(
        CASE
            WHEN value > 15 THEN 1
            ELSE 0
        END
    ) AS delayed_days
FROM `dqo-learning.data_quality.dq_check_results`
WHERE tested_resource = 'dqo-learning.data_quality.electricity_load_diagrams'
    AND test_name = 'max_delay_in_minutes'
    AND created_time >= '2021-12-14T13:00:00'
Automate data timeliness analysis with DQOps
We have shown how to create data timeliness checks using custom SQL queries. This process is manual and error-prone and needs automation. You can create your library in Python that generates data timeliness queries or use some open-source libraries such as Great Expectations. However, the integration will still be time-consuming and error-prone.
There is another option. You can use DQOps Data Quality Operations Center, a combined data quality and observability platform. DQOps works both for data engineering teams and for data quality teams. Data engineers can integrate data timeliness checks in the data pipelines using DQOps Python and REST API clients. At the same time, the data quality team or the DataOps team can use the DQOps user interface to avoid errors.
The following screen shows the data quality check editor in DQOps. By turning on the switch, DQOps activates data timeliness checks for data freshness or staleness.
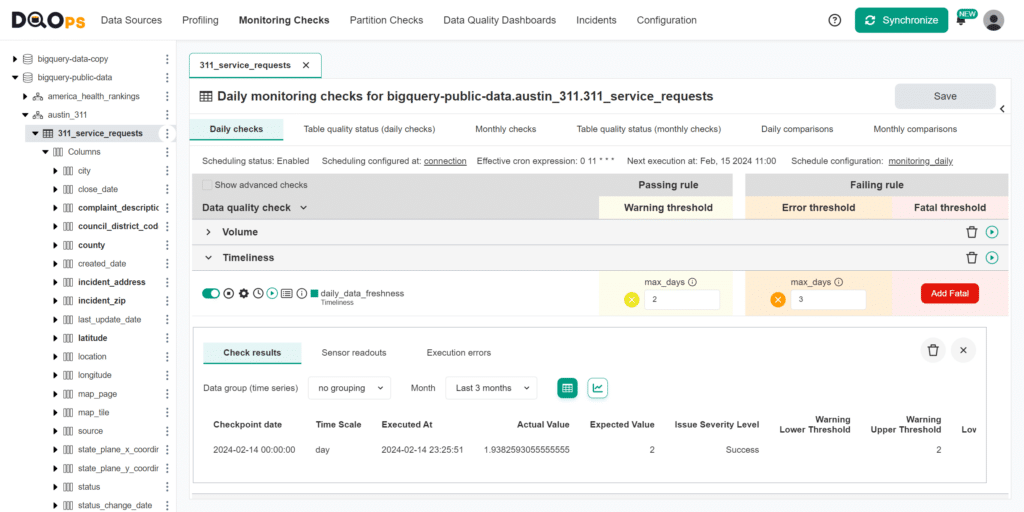
DQOps maintains a data quality data warehouse for every user. Data quality dashboards use this data warehouse to show the quality status of data sources and tables.
The data quality checks configured in DQOps use data quality rules to identify data quality issues. The rules for data freshness raise data quality issues when the time since the most recent data in the table exceeds an acceptable threshold, such as when the most recent data is older than two days.
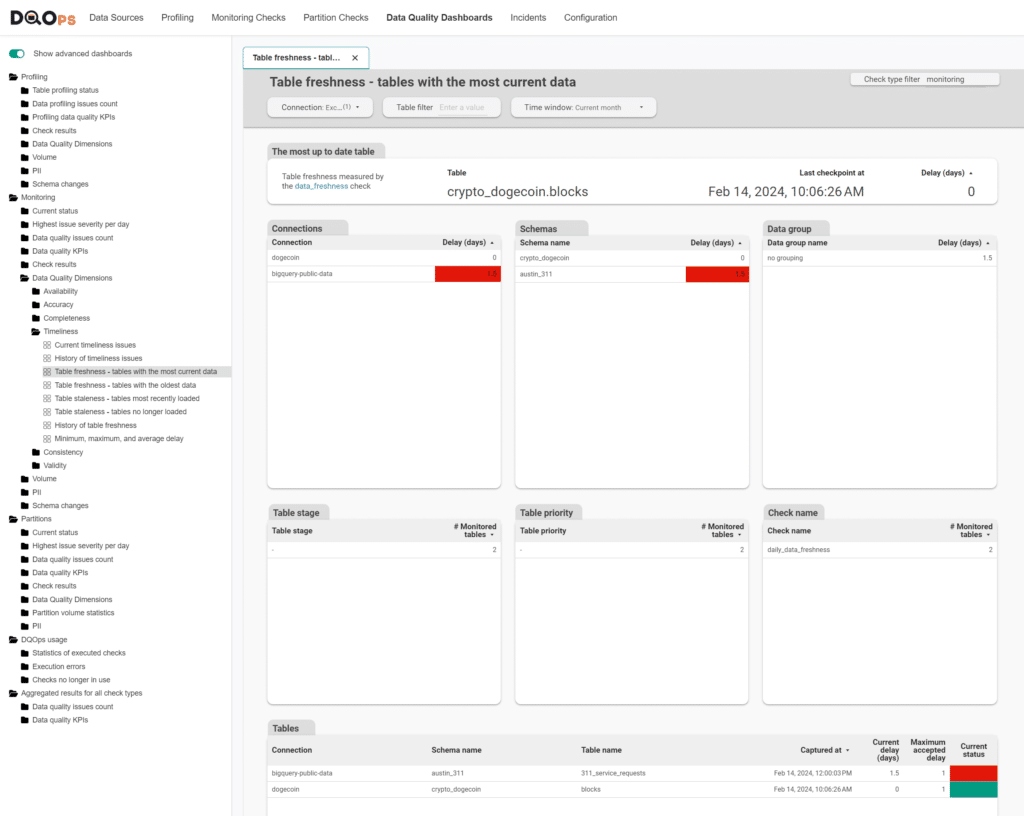
The following example shows a data freshness dashboard with the most up-to-date tables. Tables containing too old data are highlighted in red.
If you want to start using DQOps for data timeliness monitoring, please follow the DQOps getting started guide that shows how to download DQOps from PyPI.
Conclusion
Data timeliness is another foundation of data observability. It provides us with information about the time of data income or certain operations. In the real world, when we deal with a whole operational data management system, it is a starting point for troubleshooting when an error occurs.
This example covered the case when the data appeared to be timely. You can also see the documentation of the DQOps Data Quality Operations Center to learn how to run data timeliness checks on various data sources and track the results on data quality dashboards.
We often would like to visualize the data on dashboards. In terms of data observability it is useful if the data is timely, thus data timeliness checks are crucial for a proper dashboard functionality.
Data quality best practices - a step-by-step guide to improve data quality
- Learn the best practices in starting and scaling data quality
- Learn how to find and manage data quality issues