Last updated: October 22, 2024
How to detect table schema changes using data observability checks
This sample shows how to use data quality checks in the DQOps platform to detect table schema changes and view the results on data quality dashboards.
Overview
The following example shows how to detect changes in the schema using DQOps schema change monitoring.
PROBLEM
Even the small schema changes can have a big impact on your pipelines and data.
Typical table schema change issues:
- adding or removing columns,
- changing the order of columns,
- renaming column,
- changing the column type.
In this example, we will use DQOps checks that can automatically detect typical schema change issues described above.
SOLUTION
We will verify the data using the following monitoring checks design for detecting schema changes.
| Check name | Description |
|---|---|
| daily_column_count | Detects if the number of column matches an expected number. Retrieves the metadata of the monitored table, counts the number of columns and compares it to an expected value (an expected number of columns). |
| daily_column_count_changed | Detects if the count of columns has changed since the most recent day. Retrieves the metadata of the monitored table, counts the number of columns and compares it the last known column count that was captured when this data quality check was executed the last time. |
| daily_column_list_changed | Detects if new columns were added or existing columns were removed. Retrieves the metadata of the monitored table and calculates an unordered hash of the column names. Compares the current hash to the previously known hash to detect any changes to the list of columns. |
| daily_column_list_or_order_changed | Detects if new columns were added, existing columns were removed or the columns were reordered. Retrieves the metadata of the monitored table and calculates an ordered hash of the column names. Compares the current hash to the previously known hash to detect any changes to the list of columns or their order. |
| daily_column_types_changed | Detects if new columns were added, removed or their data types have changed. Retrieves the metadata of the monitored table and calculates an unordered hash of the column names and the data types (including the length, scale, precision, nullability). Compares the current hash to the previously known hash to detect any changes to the list of columns or their types. |
If you want to learn more about checks, please refer to the DQOps concept section.
VALUE
If the number or order of columns in a table changes, an error alert will be triggered. Also, renaming a column or changing its type will trigger an error alert.
Data structure
The bigquery-public-data.example_dataset dataset which we use in the example contains four tables with the following five columns:
| Column name | Column type |
|---|---|
| product_id | STRING |
| name | STRING |
| price | FLOAT |
| date_created | DATETIME |
| date_updated | DATETIME |
Run the example using the user interface
A detailed explanation of how to start DQOps platform and run the example is described here.
Navigate to a list of checks
To navigate to a list of checks prepared in the example using the user interface:
-
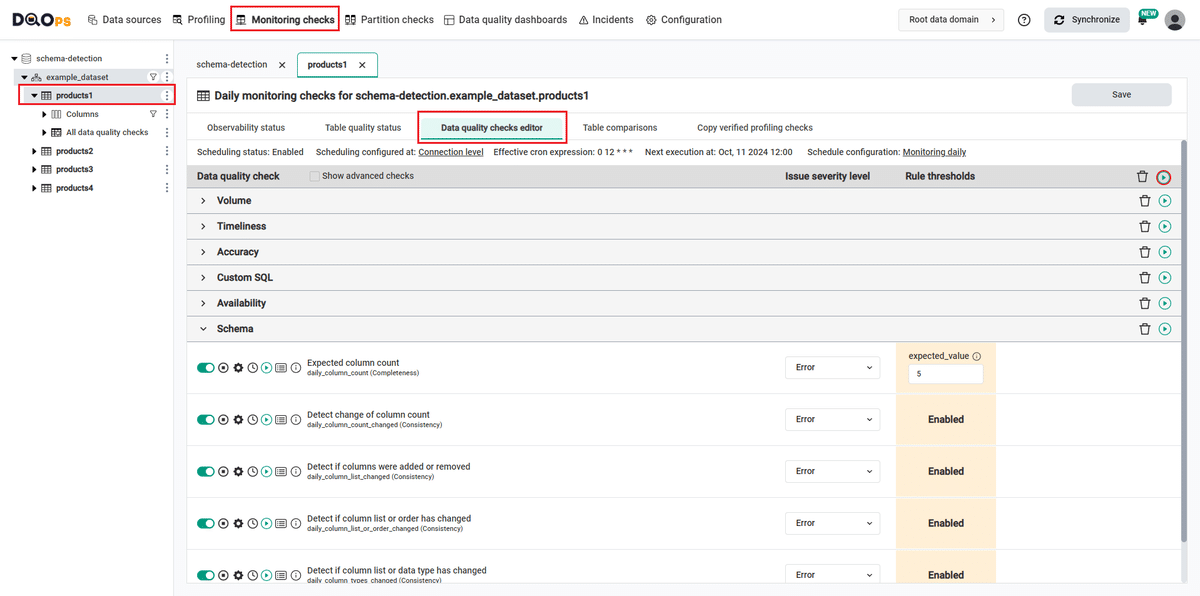
Go to the Monitoring section.
The Monitoring Checks section enables the configuration of data quality checks that are designed for the daily and monthly monitoring of your data source.
-
Select the table or column mentioned in the example description from the tree view on the left.
On the tree view you can find the tables that you have imported. We can see a schema-detection connection which contains four tables
product1,product2,product3, andproduct4. Select theproduct1table.Here is more about adding connection and importing tables.
-
Select the Data quality checks editor tab.
This tab displays a list of data quality checks in the check editor. Learn more about navigating the check editor.
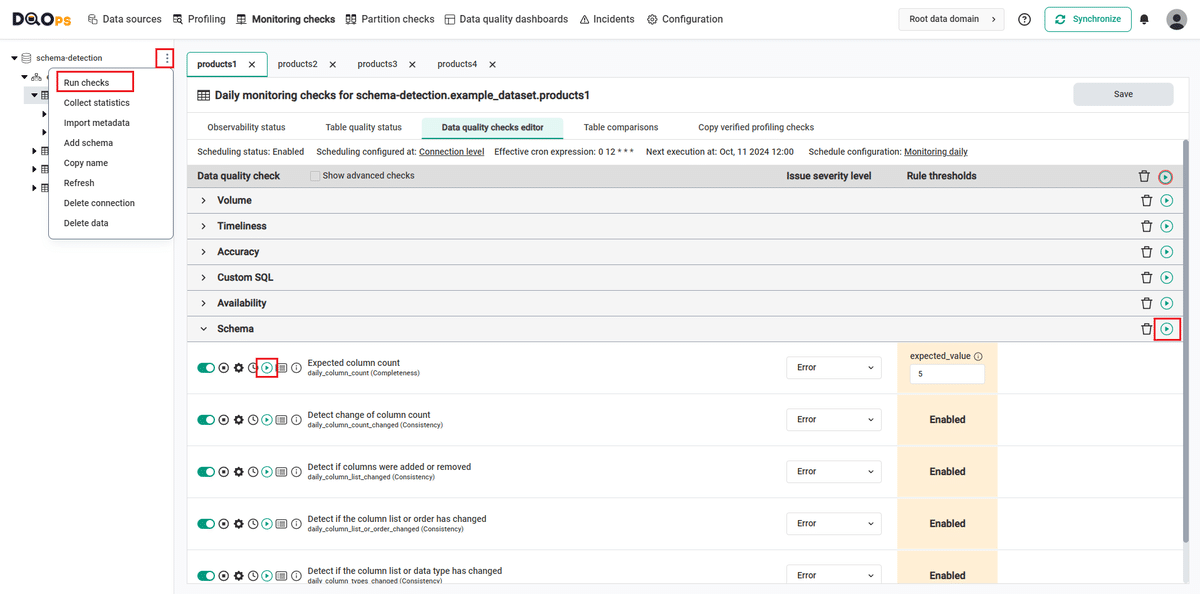
Run checks
Run the activated check using the Run check button.
You can also run all the checks for an entire subcategory of checks using the Run check button at the end of the line with the check subgroup name. You can run all checks for the connection by clicking on the three dots icon next to the connection name in the tree view, and selecting the Run checks option.
View detailed check results
Access the detailed results by clicking the Results button. The results should be similar to the one below.

Within the Results window, you will see three categories: Check results, Sensor readouts, and Execution errors. The Check results category shows the severity level that result from the verification of sensor readouts by set rule thresholds. The Sensor readouts category displays the values obtained by the sensors from the data source. The Execution errors category displays any error that occurred during the check's execution.
All the checks in the example gives correct results (notice the green square to the left of the checks name).
Modify the table schema
Now we will modify the table schema, so when we run the checks again we can see the error alerts.
We are going to run the SQL queries to make the following modifications in the columns:
-
remove the
date_updatedcolumn from theproduct1table -
rename column
product_idtoidin theproduct2table -
change the
date_updatedcolumn type from DATETIME to DATE in theproduct3table -
change the order of columns
date_createdanddate_updatedin theproduct4table
Evaluate results after table schema changes
Evaluate the results after the changes made in the columns. Because the daily checks stores the most recent result for each day when the data quality check was evaluated, the checks were run on the next day.
-
for the
product1table where whe have remove thedate_updatedcolumn we can see errors alerts in all run checks because with the removal of the column both the number of columns and the list of columns has changed (notice the orange squares to the left of the checks names).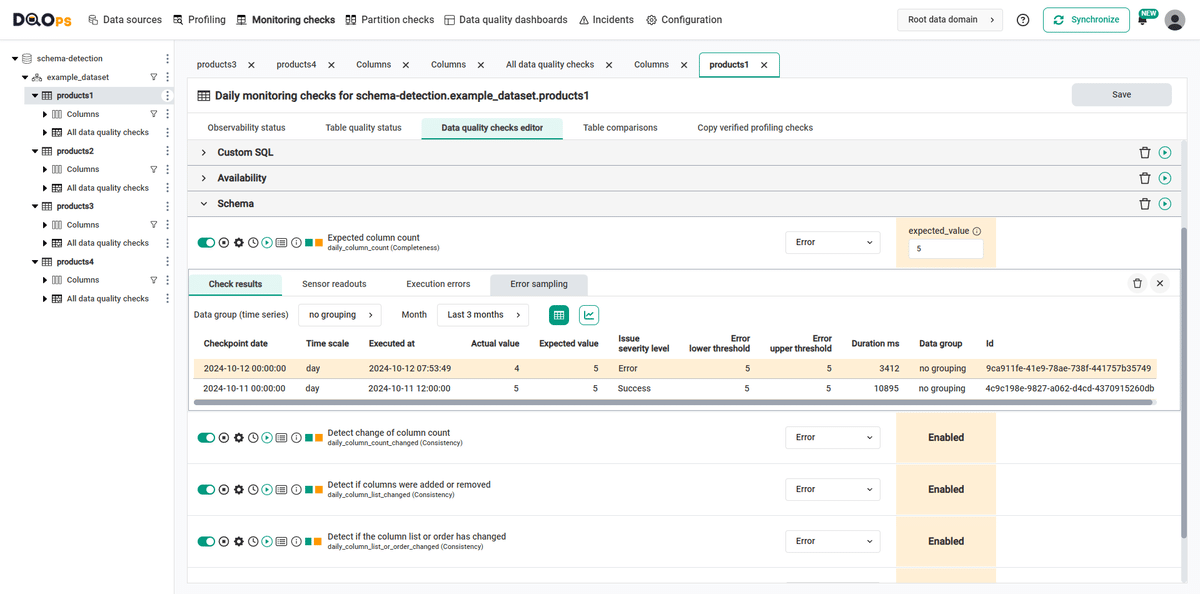
-
for the
product2table where whe have renamed the columnproduct_idtoidwe can see errors in checks that detects changes in the list of columns i.e. daily_column_list_changed, daily_column_list_or_order_changed, and daily_column_types_changed.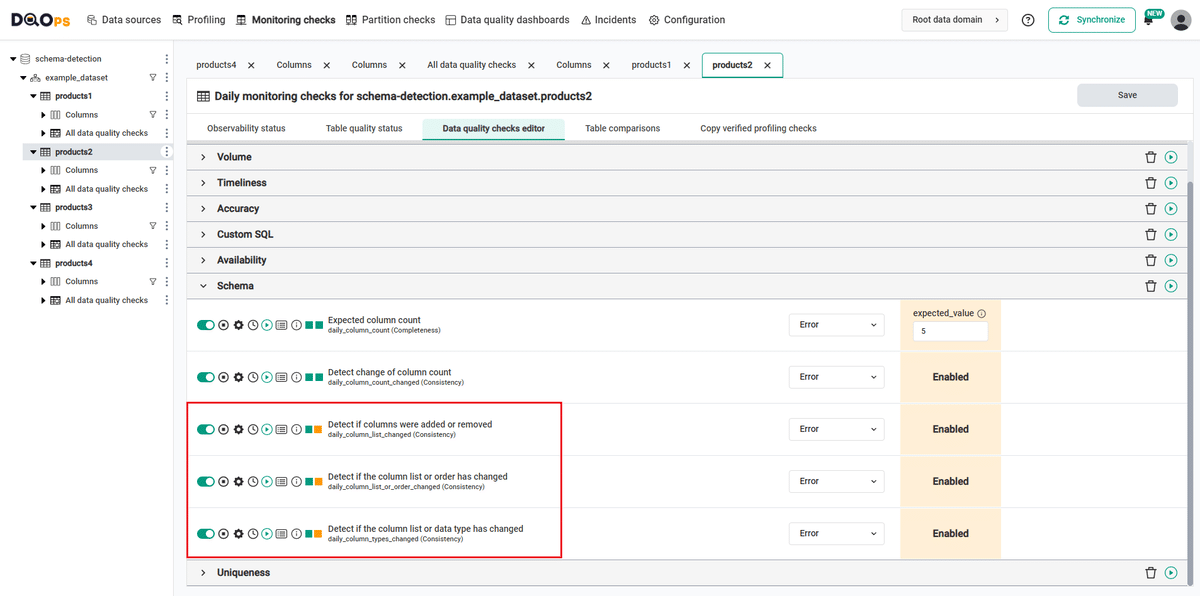
-
for the
product3table where whe have changed the type of the columndate_updatedfrom DATETIME to DATE we can see error only in the check daily_column_types_changed.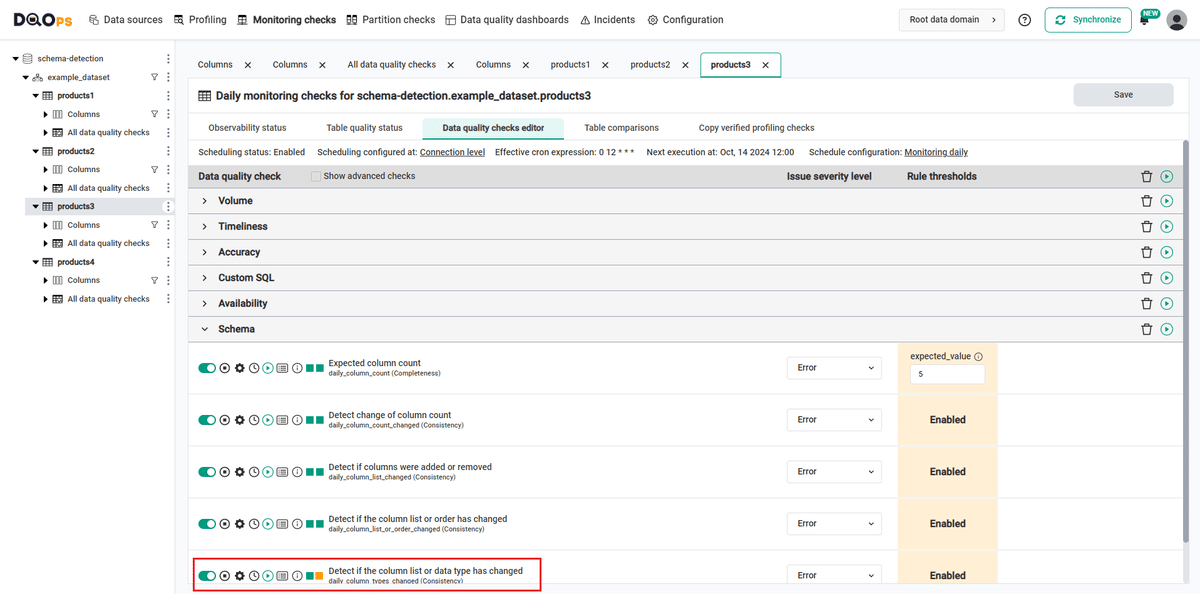
-
for the
product4table where whe have changed the order of columnsdate_createdanddate_updatedwe can see error only in the check daily_column_list_or_order_changed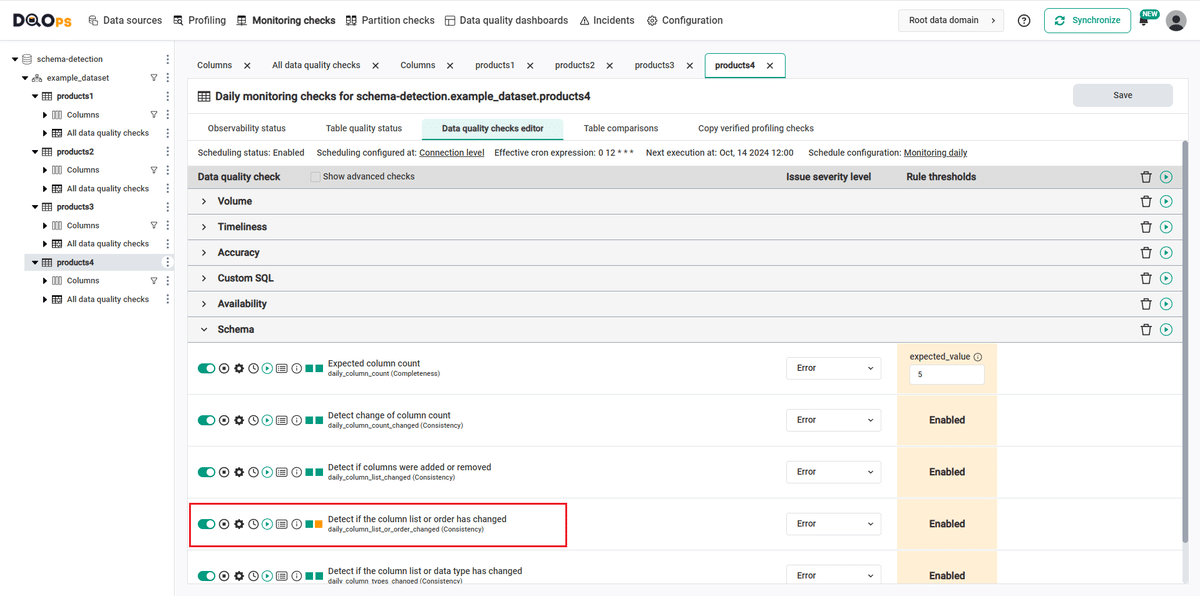
Synchronize the results with the cloud account
Synchronize the results with your DQOps cloud account using the Synchronize button located in the upper right corner of the user interface.
Synchronization ensures that the locally stored results are synced with your DQOps Cloud account, allowing you to view them on the dashboards.
YAML configuration file
The YAML configuration file stores both the table details and checks configurations.
The highlighted fragments in the YAML file below represent the segment where the schema change check are configured.
If you want to learn more about checks and threshold levels, please refer to the DQOps concept section.
apiVersion: dqo/v1
kind: table
spec:
  incremental_time_window:
    daily_partitioning_recent_days: 7
    monthly_partitioning_recent_months: 1
  monitoring_checks:
    daily:
      schema:
        daily_column_count:
          error:
            expected_value: 5
        daily_column_count_changed:
          error: {}
        daily_column_list_changed:
          error: {}
        daily_column_list_or_order_changed:
          error: {}
        daily_column_types_changed:
          error: {}
  columns:
    product_id:
      type_snapshot:
        column_type: STRING
        nullable: true
In this example, we have demonstrated how to use DQOps to detect changes in the schema.
By using the column_count, column_count_changed,
column_list_changed,
column_list_or_order_changed, and
column_types_changed check, we can monitor typical schema changes issues.
If the change occurs, you will get a warning, error or fatal results, depending on your settings.
Next steps
- You haven't installed DQOps yet? Check the detailed guide on how to install DQOps using pip or run DQOps as a Docker container.
- For details on the table schema checks used in this example, go to the check details section.
- DQOps provides you with summary statistics about your table and column. This information can be valuable in deciding which data quality checks and threshold levels should be set to monitor data quality. For more details about Basic data statistics, click here.
- DQOps allows you to keep track of the issues that arise during data quality monitoring and send alert notifications directly to Slack. Learn more about incidents and Slack notifications.
- The data in the table often comes from different data sources and vendors or is loaded by different data pipelines. Learn how data grouping in DQOps can help you calculate separate data quality KPI scores for different groups of rows.