Last updated: October 22, 2024
How to detect invalid USA zipcodes using a data quality check
This sample shows how to use data quality checks to measure the percentage of rows containing USA zipcodes and view the results on data quality dashboards.
Overview
The following example shows how to verify that the percentage of rows containing valid USA zipcodes does not exceed set thresholds.
PROBLEM
Austin-311-Public-Data provides the residents of Austin with a simple single point of contact for every city department.
What started as police non-emergency line for the City of Austin has become a robust Citywide Information Center where ambassadors are available to answer residents’ concerns 24 hours a day, 7 days a week, and 365 days a year.
The incident_zip column contains USA zipcode data. We want to verify the percentage of rows that contains USA zipcode values on incident_zip column.
SOLUTION
We will verify the data of bigquery-public-data.austin_311.311_service_requests using monitoring
contains_usa_zipcode_percent column check.
Our goal is to verify if the percentage of rows containing USA zipcode values in the incident_zip column does not exceed the setup thresholds.
In this example, we will set the maximum percentage threshold level for the check:
- error: 25.0%
If you want to learn more about checks and threshold levels, please refer to the DQOps concept section.
VALUE
If the percentage of zipcode values exceed 25.0%, an error alert will be triggered.
Data structure
The following is a fragment of the bigquery-public-data.austin_311.311_service_requests dataset. Some columns were omitted for clarity.
The incident_zip column of interest contains valid USA zipcode values.
| city | incident_zip | country | state_plane_x_coordinate | state_plane_y_coordinate | latitude |
|---|---|---|---|---|---|
| 78613 | |||||
| 78664 | |||||
| 78729 | |||||
| austin | 78746 | 0.0 | 0 | 3.442386682 | |
| 78701 | |||||
| 78739 | |||||
| 78751 | |||||
| 78733 | |||||
| 78786 |
Run the example using the user interface
A detailed explanation of how to start DQOps platform and run the example is described here.
Navigate to a list of checks
To navigate to a list of checks prepared in the example using the user interface:
-
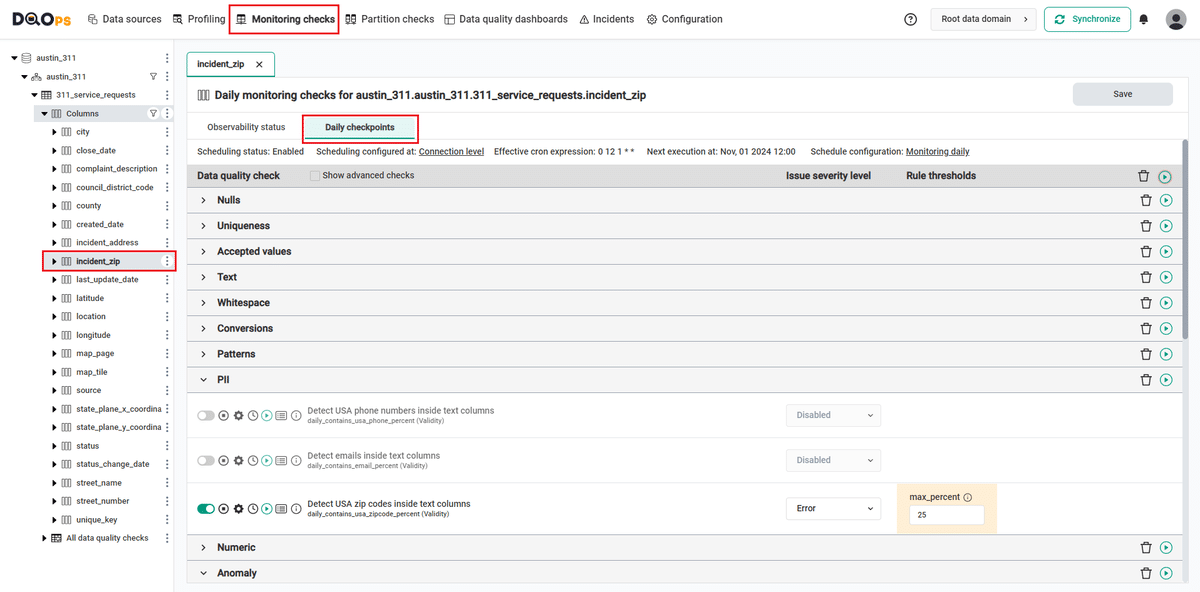
Go to the Monitoring section.
The Monitoring Checks section enables the configuration of data quality checks that are designed for the daily and monthly monitoring of your data source.
-
Select the table or column mentioned in the example description from the tree view on the left.
On the tree view you can find the tables that you have imported. Here is more about adding connection and importing tables.
-
Select the Daily checkpoints tab.
This tab displays a list of data quality checks in the check editor. Learn more about navigating the check editor.
Run checks
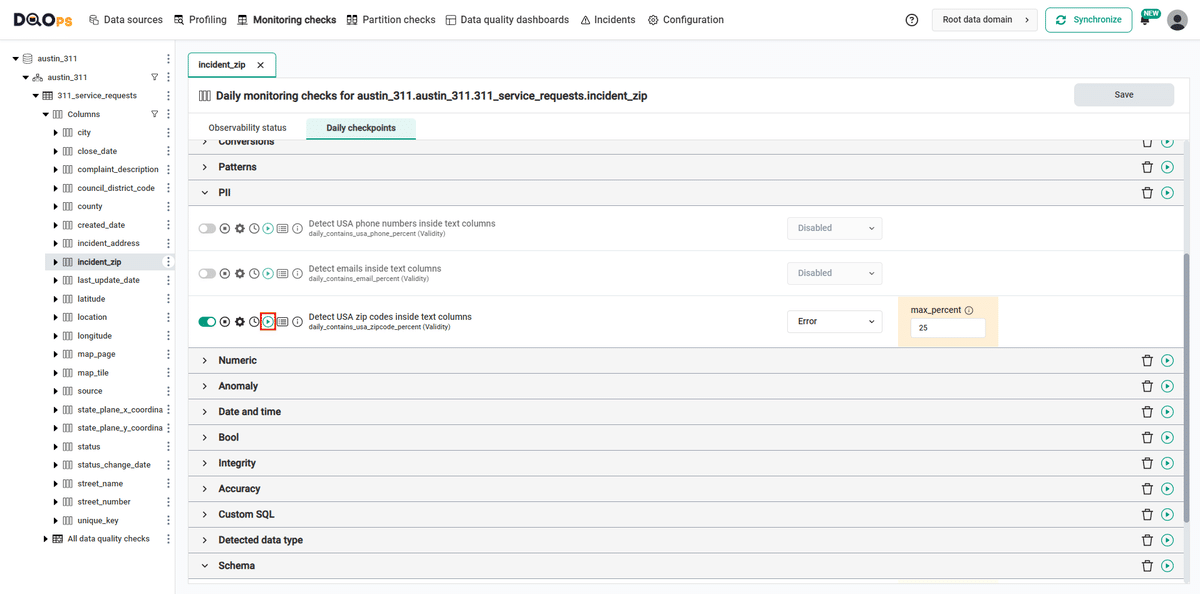
Run the activated check using the Run check button.
You can also run all the checks for an entire subcategory of checks using the Run check button at the end of the line with the check subgroup name.
View detailed check results
Access the detailed results by clicking the Results button. The results should be similar to the one below.
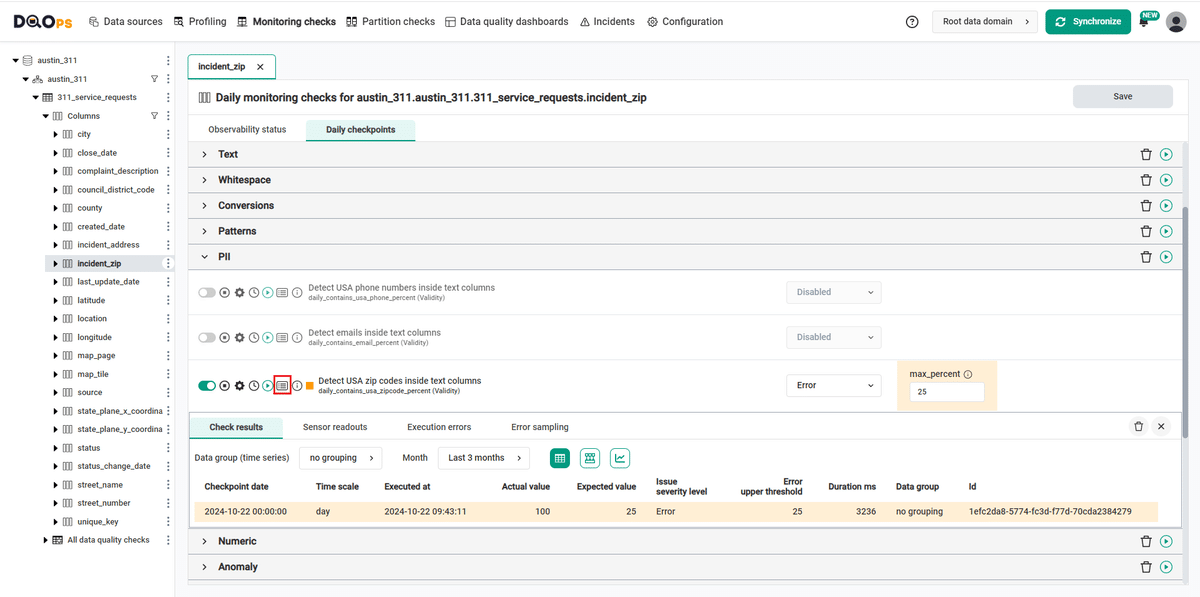
Within the Results window, you will see four categories: Check results, Sensor readouts, Execution errors, and Error sampling. The Check results category shows the severity level that result from the verification of sensor readouts by set rule thresholds. The Sensor readouts category displays the values obtained by the sensors from the data source. The Execution errors category displays any error that occurred during the check's execution. The Error sampling category displays examples of invalid values in the column.
The actual value%, which is above the maximum threshold level set in the error (25.0%). The check gives an error (notice the orange square to the left of the check name).
Synchronize the results with the cloud account
Synchronize the results with your DQOps cloud account using the Synchronize button located in the upper right corner of the user interface.
Synchronization ensures that the locally stored results are synced with your DQOps Cloud account, allowing you to view them on the dashboards.
YAML configuration file
The YAML configuration file stores both the table details and checks configurations.
In this example, we have set the maximum percentage threshold level for the check:
- error: 25.0%
The highlighted fragments in the YAML file below represent the segment where the monitoring daily_contains_usa_zipcode_percent check is configured.
If you want to learn more about checks and threshold levels, please refer to the DQOps concept section.
apiVersion: dqo/v1
kind: table
spec:
  incremental_time_window:
    daily_partitioning_recent_days: 7
    monthly_partitioning_recent_months: 1
  columns:
    unique_key:
      type_snapshot:
        column_type: STRING
        nullable: true
    city:
      type_snapshot:
        column_type: STRING
        nullable: true
    incident_zip:
      type_snapshot:
        column_type: INT64
        nullable: true
      monitoring_checks:
        daily:
          pii:
            daily_contains_usa_zipcode_percent:
              error:
                max_percent: 25.0
In this example, we have demonstrated how to use DQOps to verify the validity of data in a column. By using the contains_usa_zipcode_percent column check, we can monitor that the percentage of rows containing valid USA zipcodes does not exceed set thresholds. If it does, you will get a warning, error or fatal error results.
Next steps
- You haven't installed DQOps yet? Check the detailed guide on how to install DQOps using pip or run DQOps as a Docker container.
- For details on the contains_usa_zipcode_percent check used in this example, go to the check details section.
- You might be interested in another validity check that evaluates that the number of invalid emails in a monitored column does not exceed the maximum accepted count.
- The data in the table often comes from different data sources and vendors or is loaded by different data pipelines. Learn how data grouping in DQOps can help you calculate separate data quality KPI scores for different groups of rows.
- Would you like to add your own connection? Here you can find information about supported databases and how to add new connection.