Last updated: July 05, 2025
How to Detect Invalid Latitude or Longitude with Data Quality Checks
This sample shows how to use data quality checks to measure the percentage of valid latitude and longitude values and view the results on dashboards.
Overview
The following example shows how to verify that the percentage of valid latitude and longitude values are above a set threshold.
PROBLEM
Austin-311-Public-Data provides the residents of Austin with a simple single point of contact for every city department.
What started as police non-emergency line for the City of Austin has become a robust Citywide Information Center where ambassadors are available to answer residents’ concerns 24 hours a day, 7 days a week, and 365 days a year.
The dataset contain the list of service requests with unique key, descriptions, status, address as well as its longitude and latitude coordinates.
We want to verify the percentage of valid latitude and longitude values in latitude and longitude columns, respectively.
SOLUTION
We will verify the data of bigquery-public-data.austin_311.311_service_requests using monitoring
valid_latitude_percent and
valid_longitude_percent column checks.
Our goal is to verify if the percentage of valid latitude values in the latitude and longitude columns are above the set threshold.
In this example, we will set the minimum percentage threshold level for the check:
- warning: 99.0%
If you want to learn more about checks and threshold levels, please refer to the DQOps concept section.
VALUE
If the percentage of valid latitude or longitude values is below 99%, a warning alert will be triggered.
Data structure
The following is a fragment of the bigquery-public-data.austin_311.311_service_requests dataset. Some columns were
omitted for clarity.
The latitude and longitude columns of interest contains valid values.
| unique_key | complaint_description | incident_address | latitude | longitude |
|---|---|---|---|---|
| 14-00000261 | Sign - Traffic Sign Maintenance | 1411 MEARNS MEADOW BLVD, AUSTIN, TX | 30.37525546 | -97.70466813 |
| 14-00000296 | Sign - Traffic Sign Maintenance | DEER LN & BRODIE LN, AUSTIN, TX | 30.19429024 | -97.84298292 |
| 14-00001646 | Animal Control - Assistance Request | WHITESTONE | 30.53892395 | -97.77471976 |
| 14-00001647 | Sign - Traffic Sign Maintenance | METRIC | 30.38409576 | -97.71474292 |
| 14-00001648 | Code Compliance | LA NARANJA | 30.21519414 | -97.8738822 |
| 14-00001649 | Code Compliance | DUBUQUE | 30.31488504 | -97.6673545 |
| 14-00001650 | Loose Dog | LOS INDIOS TRL & MC NEIL DR | 30.43736609 | -97.76050242 |
| 14-00001651 | Traffic Signal - Maintenance | PLEASANT VALLEY | 30.17838134 | -97.74744183 |
| 14-00001652 | ARR Missed Yard Trimmings /Organics | PROVENCIAL | 30.28755755 | -97.66188875 |
| 14-00001654 | Parking Ticket Complaint | 9TH | 30.27091532 | -97.7417791 |
Run the example using the user interface
A detailed explanation of how to start DQOps platform and run the example is described here.
Navigate to a list of checks
To navigate to a list of checks prepared in the example using the user interface:
-
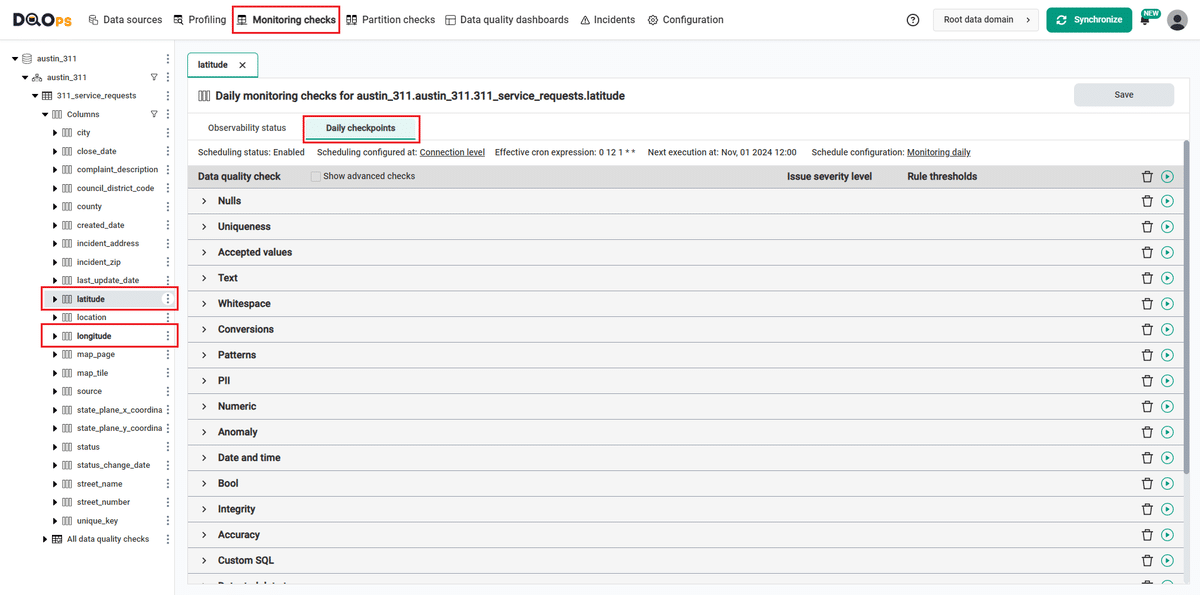
Go to the Monitoring section.
The Monitoring Checks section enables the configuration of data quality checks that are designed for the daily and monthly monitoring of your data source.
-
Select the table or column mentioned in the example description from the tree view on the left.
On the tree view you can find the tables that you have imported. Here is more about adding connection and importing tables.
-
Select the Daily checkpoints tab.
This tab displays a list of data quality checks in the check editor. Learn more about navigating the check editor.
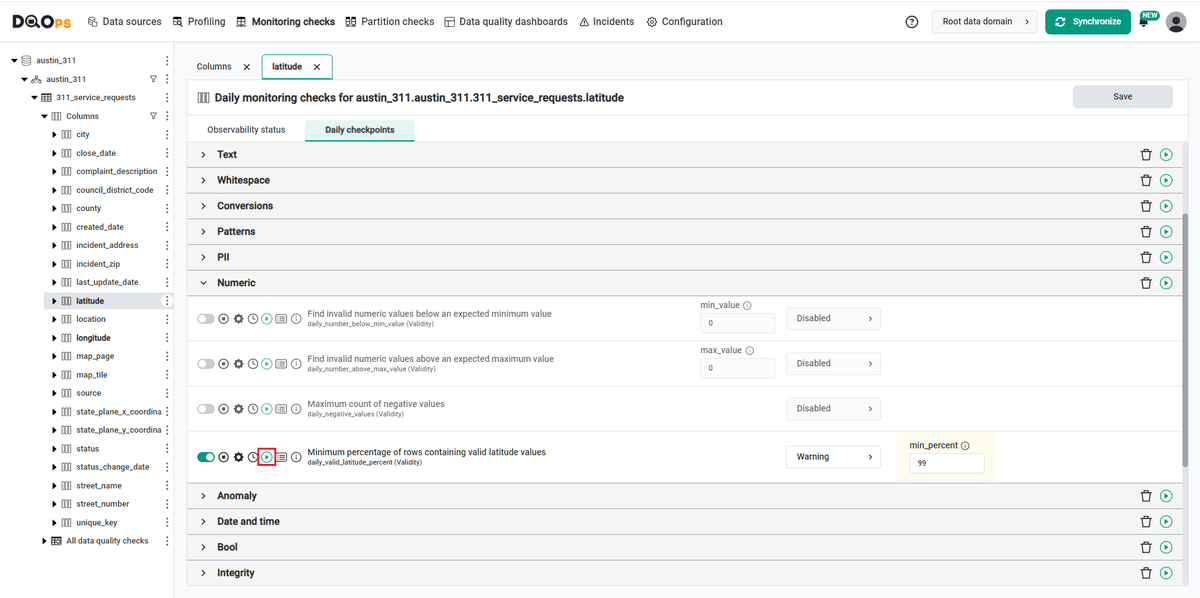
Run checks
Run the activated check using the Run check button. Run checks on latitude and longitude columns.
You can also run all the checks for an entire connection. Click on the three dots icon next to the name of the connection in the tree view and click on Run checks.
View detailed check results
Access the detailed results by clicking the Results button. The results should be similar to the one below.
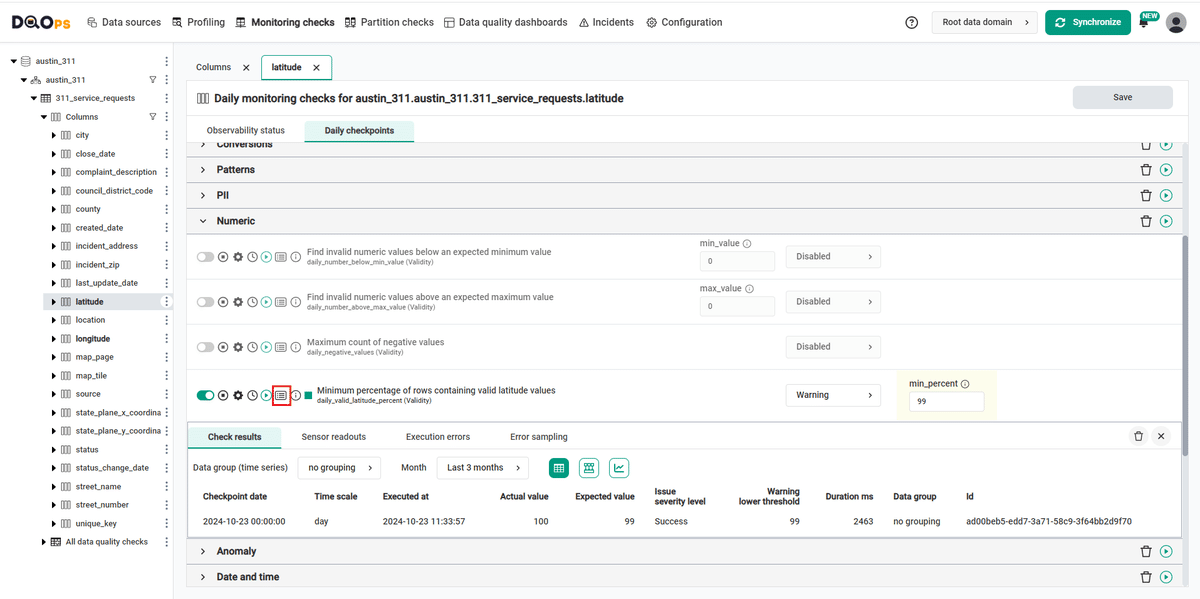
Within the Results window, you will see four categories: Check results, Sensor readouts, Execution errors, and Error sampling. The Check results category shows the severity level that result from the verification of sensor readouts by set rule thresholds. The Sensor readouts category displays the values obtained by the sensors from the data source. The Execution errors category displays any error that occurred during the check's execution. The Error sampling category displays examples of invalid values in the column.
The actual value in this example is 100% for both longitude and latitude checks, which is above the minimum threshold level set in the warning (99.0%). The check gives a correct result (notice the green square to the left of the check name).
Synchronize the results with the cloud account
Synchronize the results with your DQOps cloud account using the Synchronize button located in the upper right corner of the user interface.
Synchronization ensures that the locally stored results are synced with your DQOps Cloud account, allowing you to view them on the dashboards.
Change a schedule at the connection level
With DQOps, you can easily customize when checks are run by setting schedules. You can set schedules for an entire connection, table, or individual check.
After importing new tables, DQOps sets the schedule for 12:00 P.M. (noon) every day. Follow the steps below to change the schedule.
-
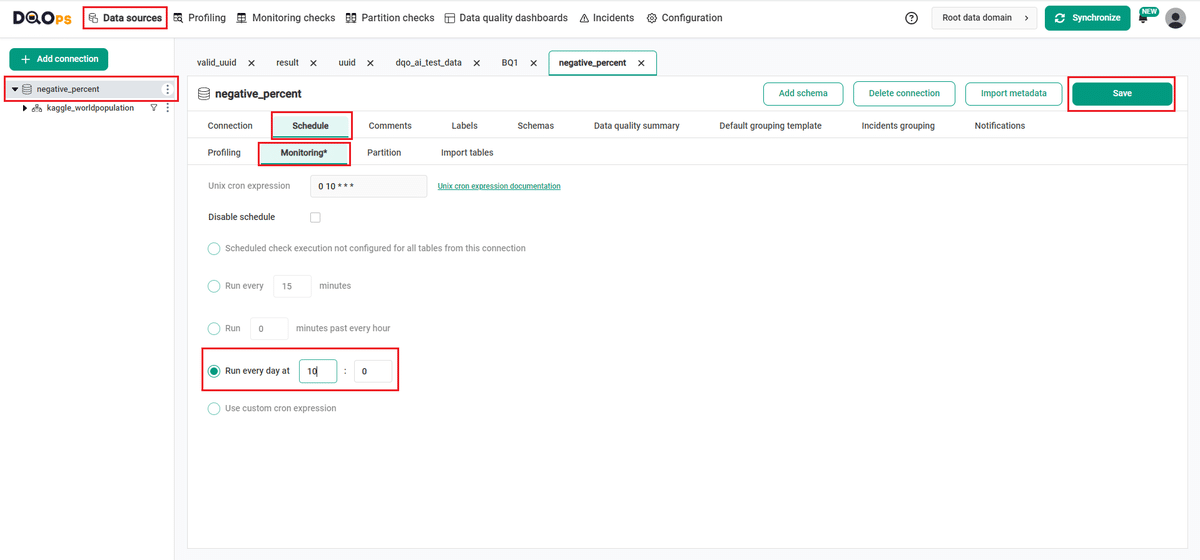
Navigate to the Data Source section.
-
Choose the connection from the tree view on the left.
-
Click on the Schedule tab.
-
Select the Monitoring daily tab
-
Select the Run every day at and change the time, for example, to 10:00. You can also select any other option.
-
Once you have set the schedule, click on the Save button to save your changes.
By default, scheduler is active. You can turn it off by clicking on notification icon in the top right corner of the screen, and clicking the toggle button.

Once a schedule is set up for a particular connection, it will execute all the checks that have been configured across all tables associated with that connection.
You can read more about scheduling here.
You might also want to check the Running checks with a scheduler example.
YAML configuration file
The YAML configuration file stores both the table details and checks configurations.
In this example, we have set the maximum percentage threshold level for the checks:
- warning: 99.0%
The highlighted fragments in the YAML file below represent the segment where the monitoring daily_valid_latitude_percent and
daily_valid_longitude_percentchecks are configured.
If you want to learn more about checks and threshold levels, please refer to the DQOps concept section.
apiVersion: dqo/v1
kind: table
spec:
   incremental_time_window:
      daily_partitioning_recent_days: 7
      monthly_partitioning_recent_months: 1
   columns:
      state_plane_y_coordinate:
         type_snapshot:
            column_type: FLOAT64
            nullable: true
      latitude:
         type_snapshot:
            column_type: FLOAT64
            nullable: true
         monitoring_checks:
            daily:
               numeric:
                  daily_valid_latitude_percent:
                     warning:
                        min_percent: 99.0
      longitude:
         type_snapshot:
            column_type: FLOAT64
            nullable: true
         monitoring_checks:
            daily:
               numeric:
                  daily_valid_longitude_percent:
                     warning:
                        min_percent: 99.0
      location:
         type_snapshot:
            column_type: STRING
            nullable: true
      council_district_code:
         type_snapshot:
            column_type: INT64
            nullable: true
      map_page:
         type_snapshot:
            column_type: STRING
            nullable: true
      map_tile:
         type_snapshot:
            column_type: STRING
            nullable: true
In this example, we have demonstrated how to use DQOps to verify the validity of data in a column. By using the valid_latitude_percent and valid_longitude_percent column checks, we can monitor that the percentage of valid latitude and longitude values does not fall below a set threshold. If it does, you will get a warning result.
Next steps
- You haven't installed DQOps yet? Check the detailed guide on how to install DQOps using pip or run DQOps as a Docker container.
- For details on the valid_latitude_percent check used in this example, go to the check details section.
- For details on the valid_longitude_percent check used in this example, go to the check details section.
- You might be interested in another validity check that evaluates that the percentage of valid UUID values in a column does not fall below the minimum accepted percentage.
- Would you like to add your own connection? Here you can find information about supported databases and how to add new connection.