Last updated: November 13, 2024
Daily monitoring of data quality
Read this guide to understand the daily workflow of using DQOps to review recently detected data quality issues.
Overview
Problem: To ensure the accuracy, completeness, consistency and reliability of your data, it is essential to monitor it on a daily basis. By doing so, you can spot any issues early on and take prompt action to solve them.
Solution: To achieve this, you can set up daily monitoring of data quality checks in the DQOps. The platform will automatically run data quality checks on a regular basis and notify you immediately if it discovers any issues. Additionally, you can review the results of the checks on data quality dashboards, which provide a comprehensive overview of your data quality status.
Import a new table
To import tables, you first need to have an added connection. You can check supported data sources and a guide on how to add a new connection here.
To import source schemas and tables:
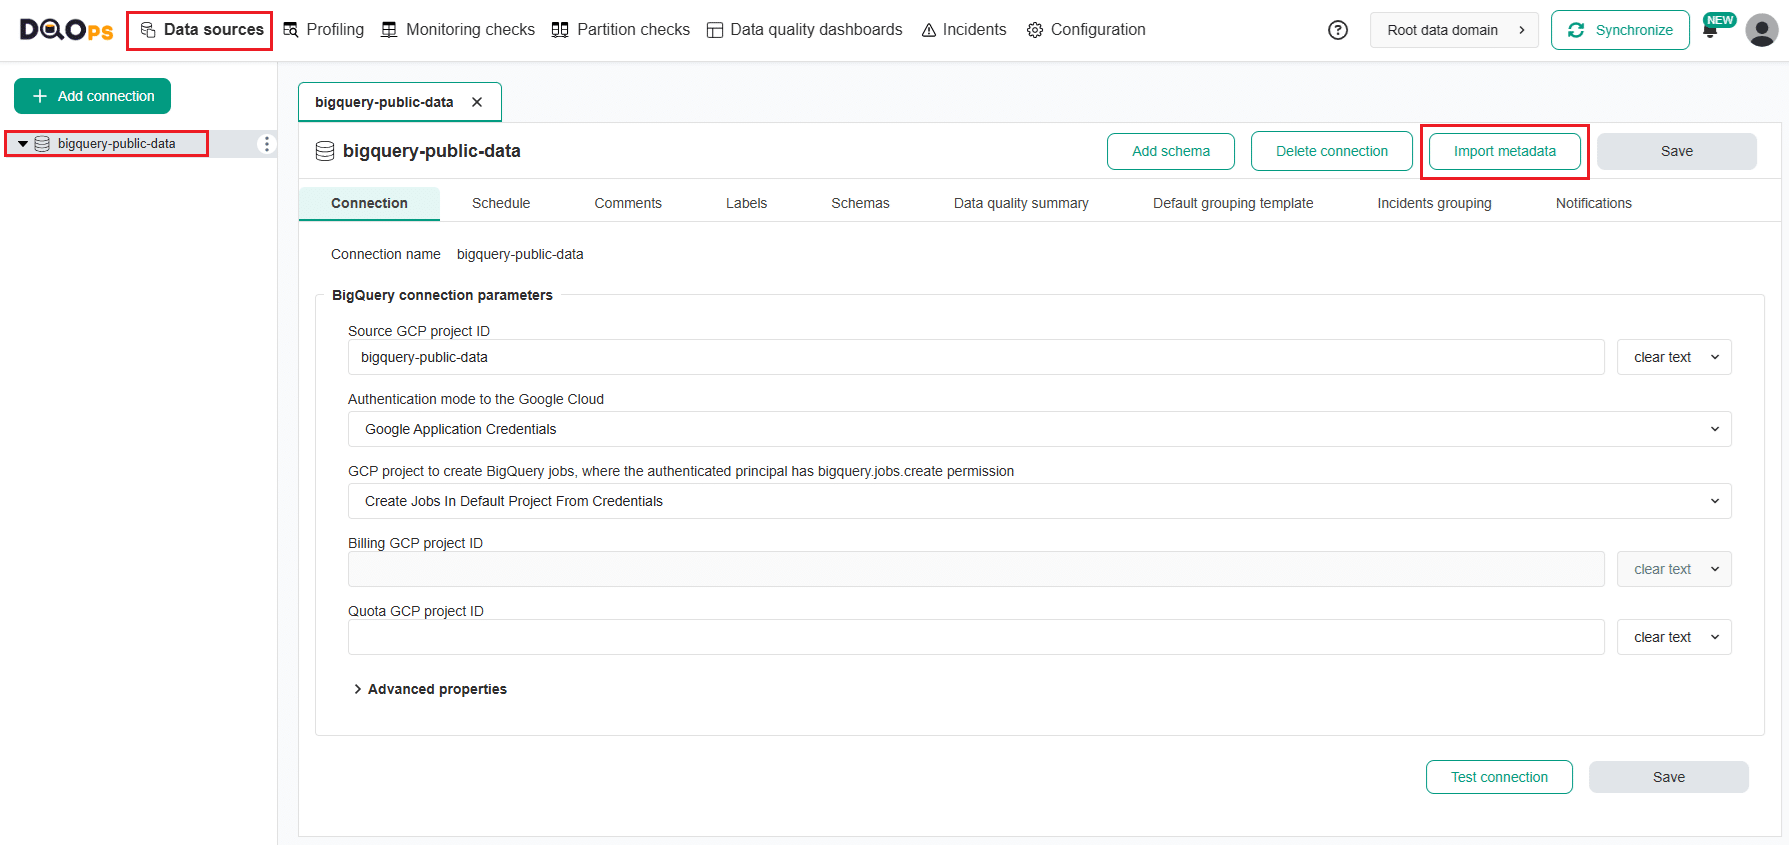
- Go to the Data Sources section
- Select the connection from the tree view on the left
-
Click on the Import metadata button on the right.
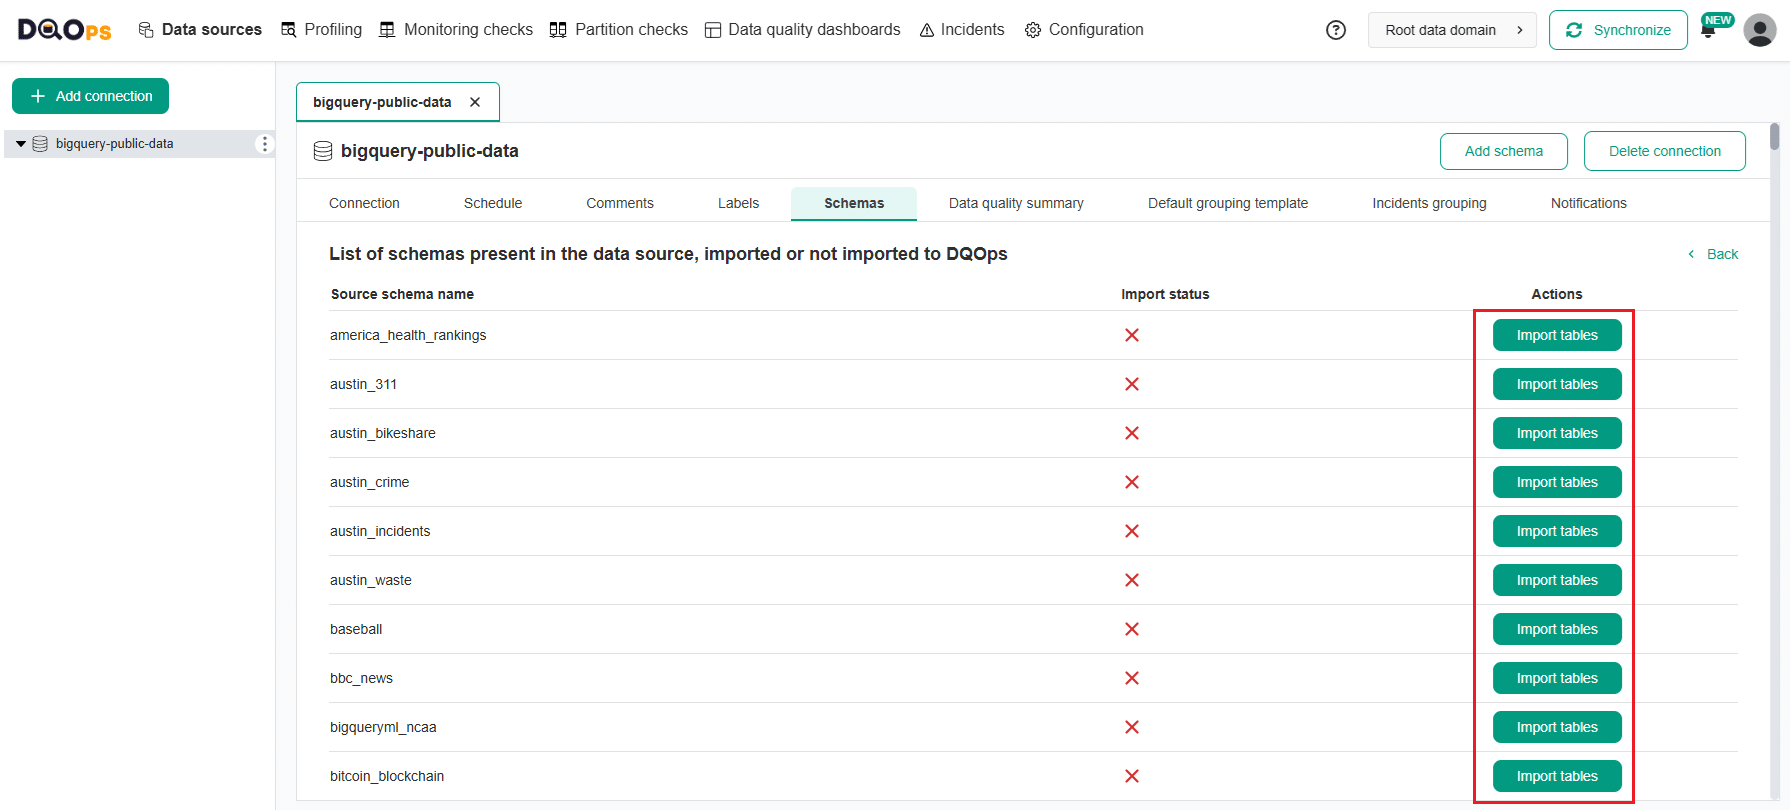
-
Select the source schema name you want to import by clicking on the Import tables button.
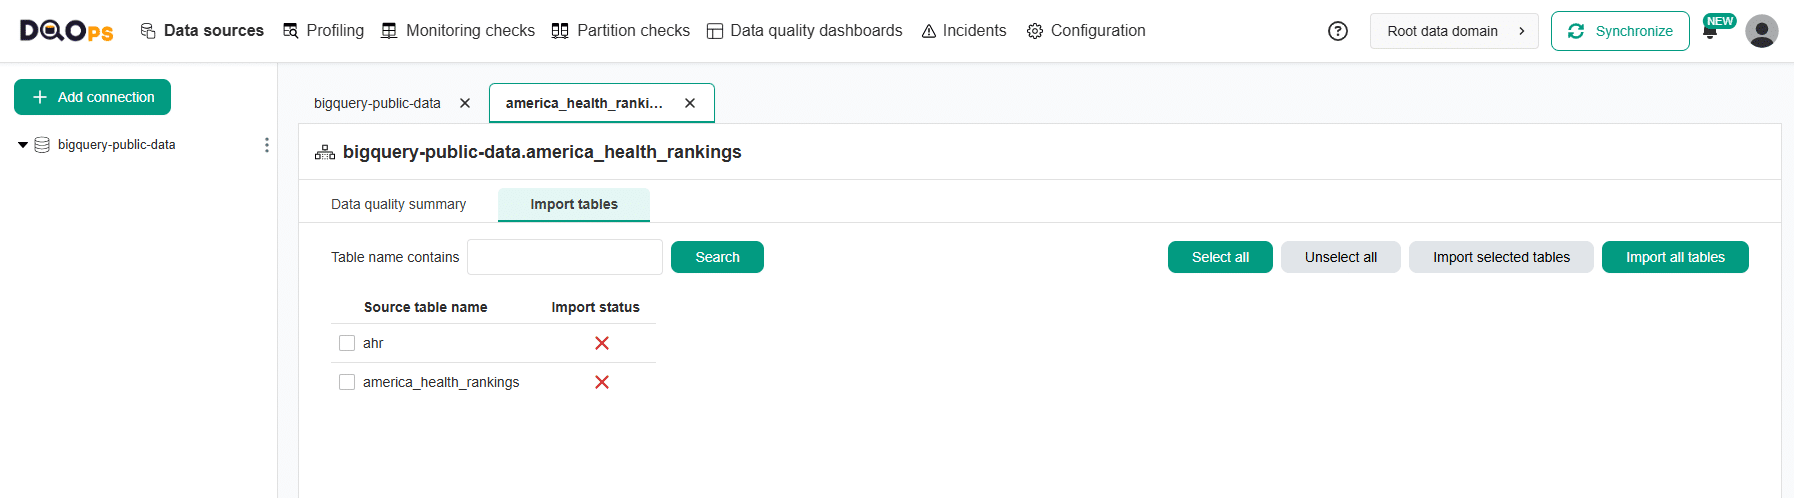
-
Select the tables you want to import or import all tables using the buttons in the upper right corner.
Start data quality assessment
DQOps simplifies the data quality assessment process, which is a routine activity for data governance and quality teams.
Upon import, you will receive information that a new tables have been imported. You can then begin collecting basic statistics and profiling data by running default data profiling checks. Simply click on the Start profiling button to initiate this process.

Automatically activated checks
Once new tables are imported, DQOps automatically activates profiling and monitoring checks which are which are pre-enabled by data quality policies. These checks detect volume anomalies, data freshness anomalies, empty tables, table availability, schema changes, anomalies in the count of distinct values, and null percent anomalies. The profiling checks are scheduled to run at 12:00 p.m. on the 1st day of every month, and the monitoring checks are scheduled to run daily at 12:00 p.m.
Profiling checks are designed to assess the initial data quality score of a data source. Profiling checks are also useful for exploring and experimenting with various types of checks and determining the most suitable ones for regular data quality monitoring.
Monitoring checks are standard checks that monitor the data quality of a table or column. They can also be referred to as Data Observability checks. These checks capture a single data quality result for the entire table or column.
Follow the link for more information on how to review Data statistics.
Run automatically activated monitoring checks
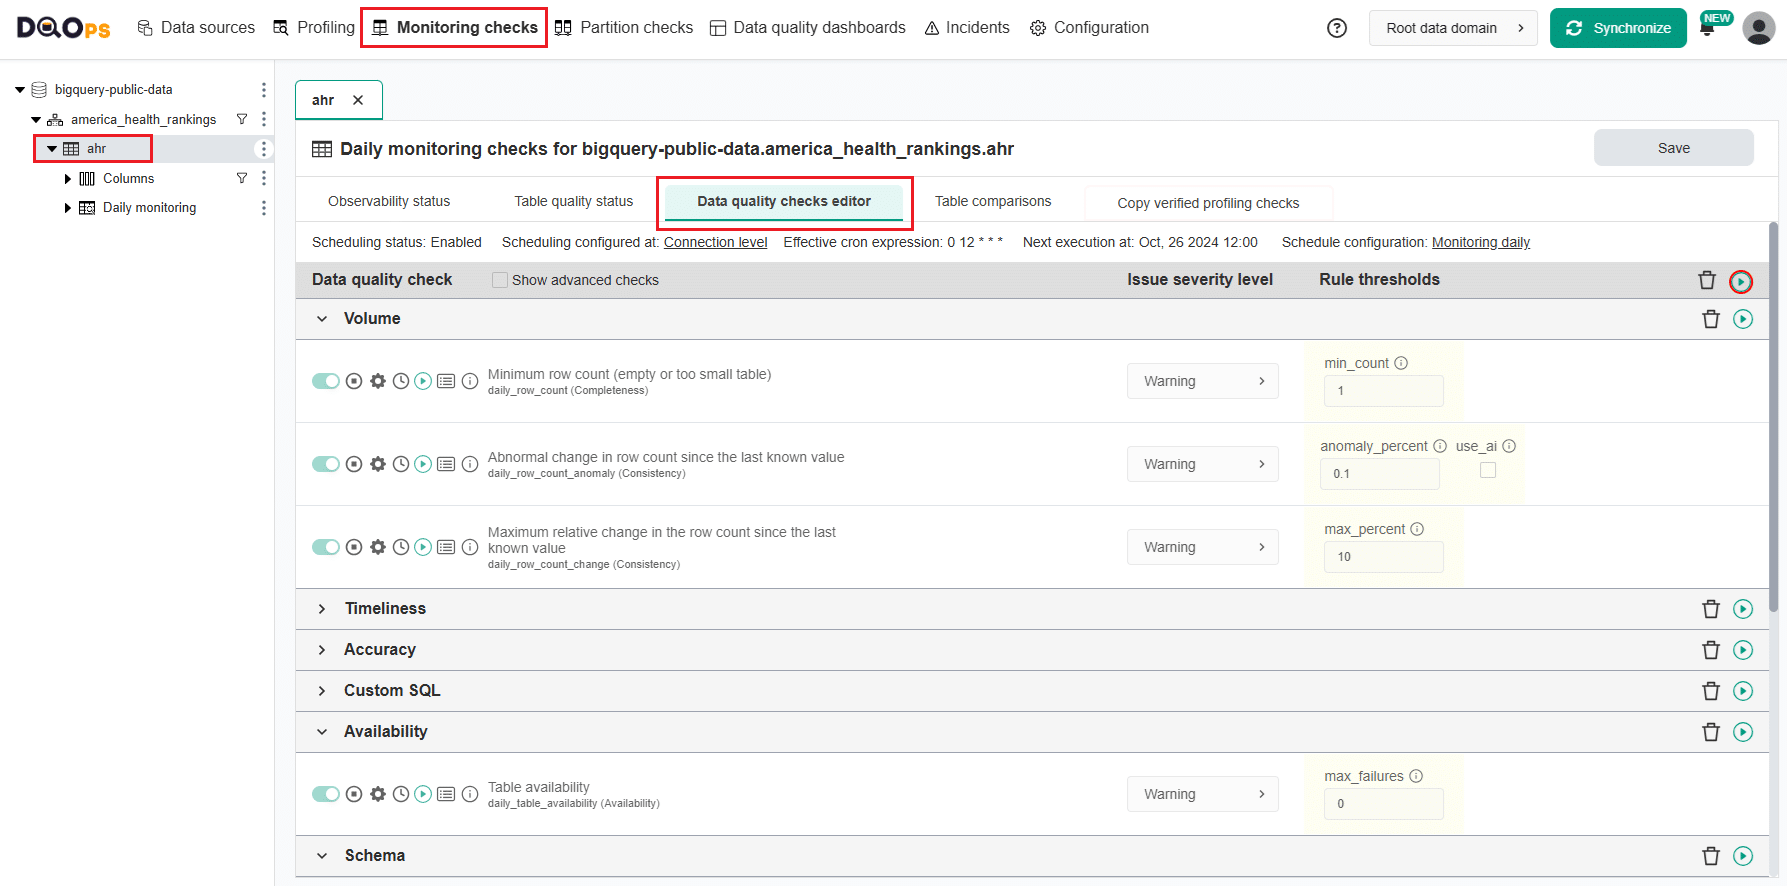
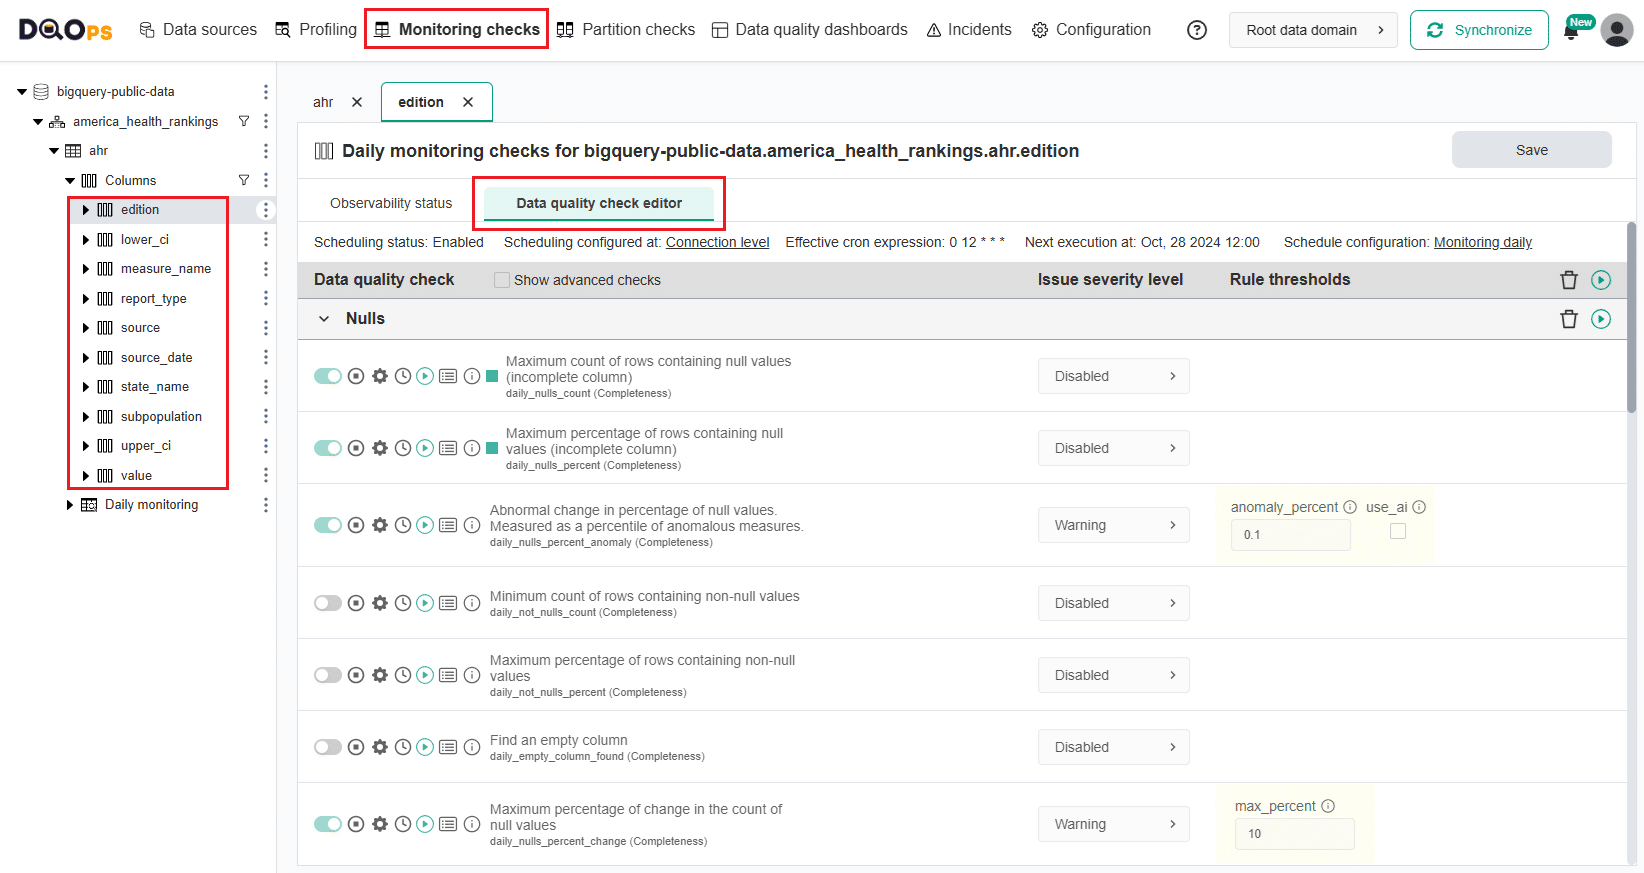
To run automatically activated monitoring checks, go to the Monitoring checks section, select the table of interest from the tree view on the left and the Data quality checks editor tab.
The main workspace on the right will show the Check editor. The table with data quality checks contains a list of checks divided into different data quality subcategories that you can expand and collapse by clicking on an arrow. Learn more about the different check subcategories.
The toggle button next to the name of the automatically activated checks will have a light green color. If the check has been activated manually, the toggle button will have a darker green color.
Similarly, you can view the column checks. Just select the column of interest from the tree view on the left.
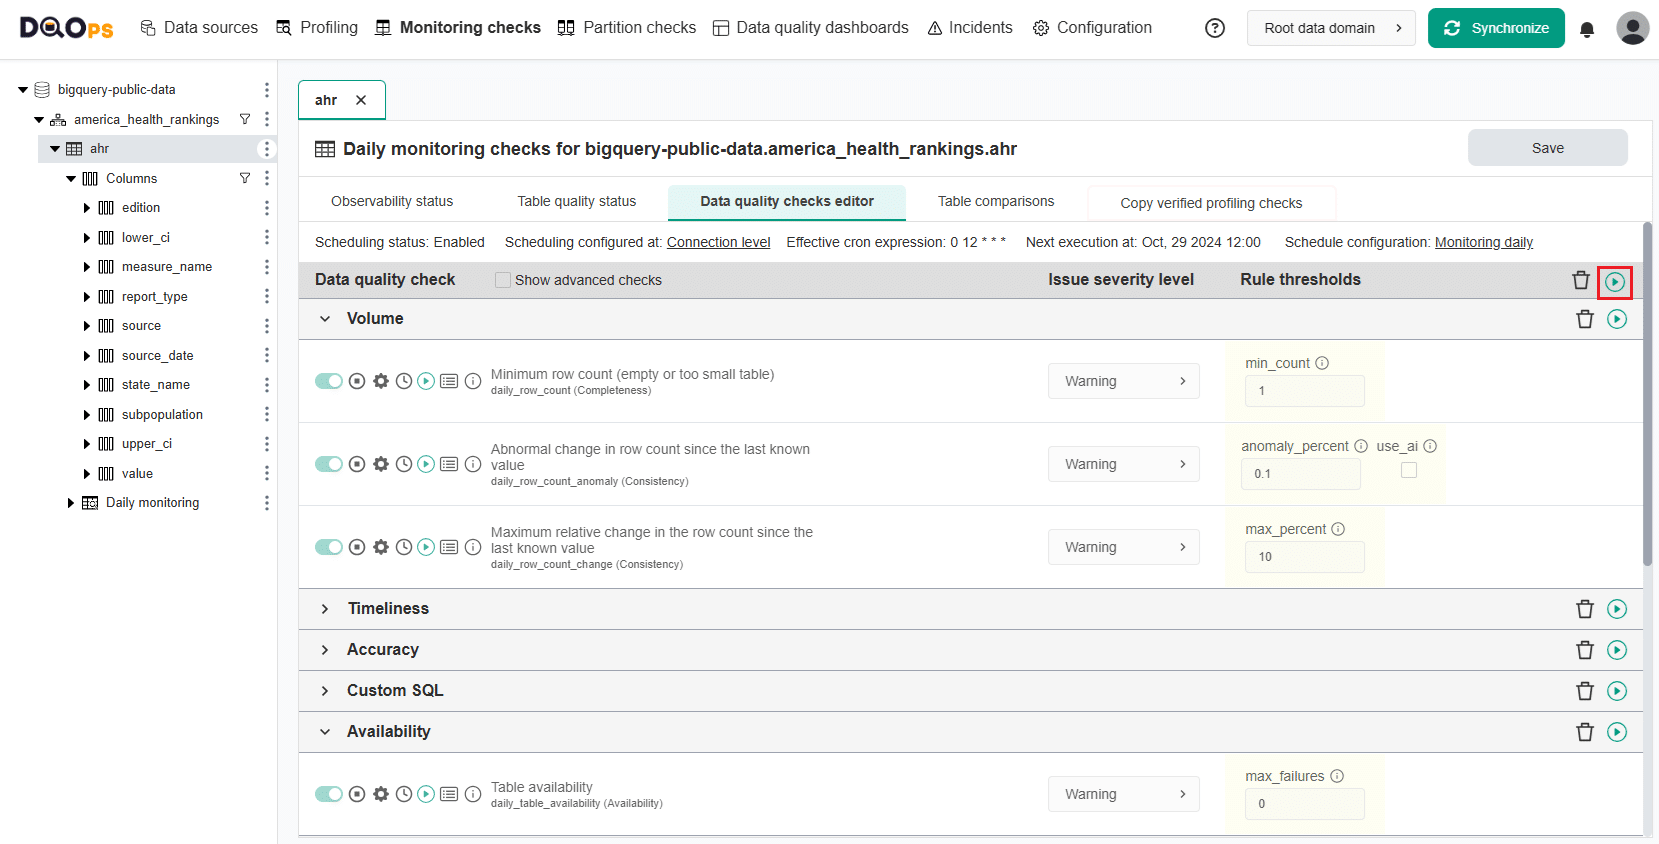
To run a single check, click the Run button next to the specific check's name. If you want to run the check for the entire table, click the Run button located in the upper left corner of the check editor table.
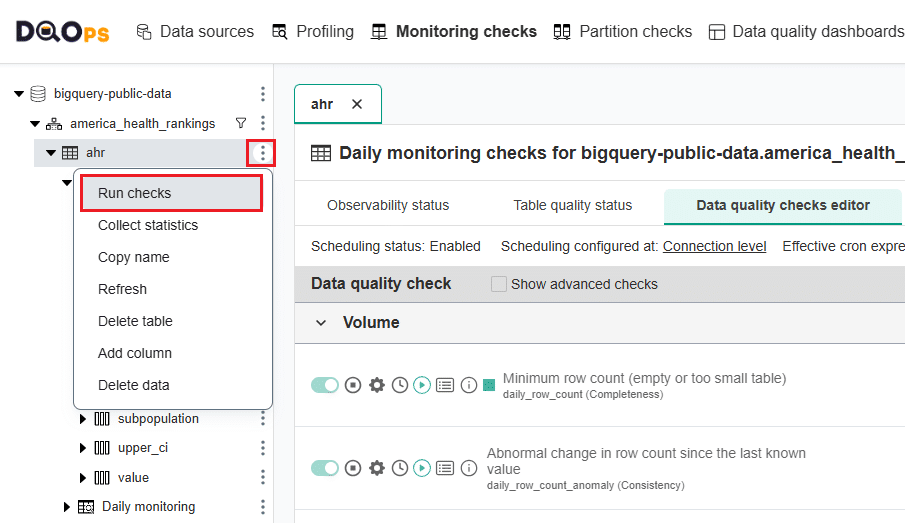
You can also run all checks activated on the connection or table. Click on the three-dot icon next to the name of connection or table and click on the Run checks option.
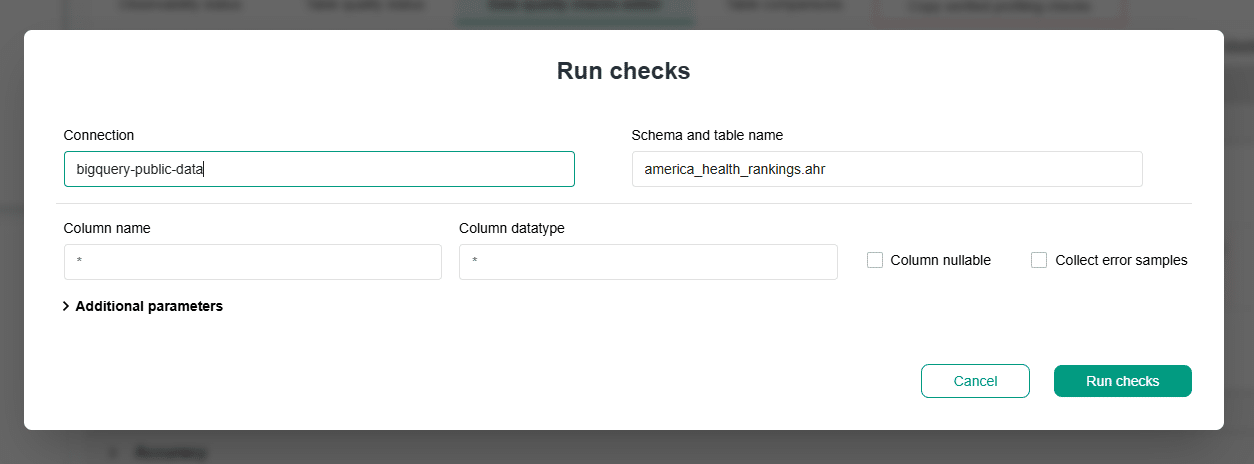
A dialog box will appear where you can modify different options or simply click the Run checks button.
Follow the link for more information about running data quality checks.
Review the detailed check results
The check results are shown as a color square next to the name of the check.
- Green for a correct result
- Yellow for a warning
- Orange for an error
- Red for a fatal error
- Black for execution error.
Hover over the square to view more details.
To access the detailed results, click on the Results button.
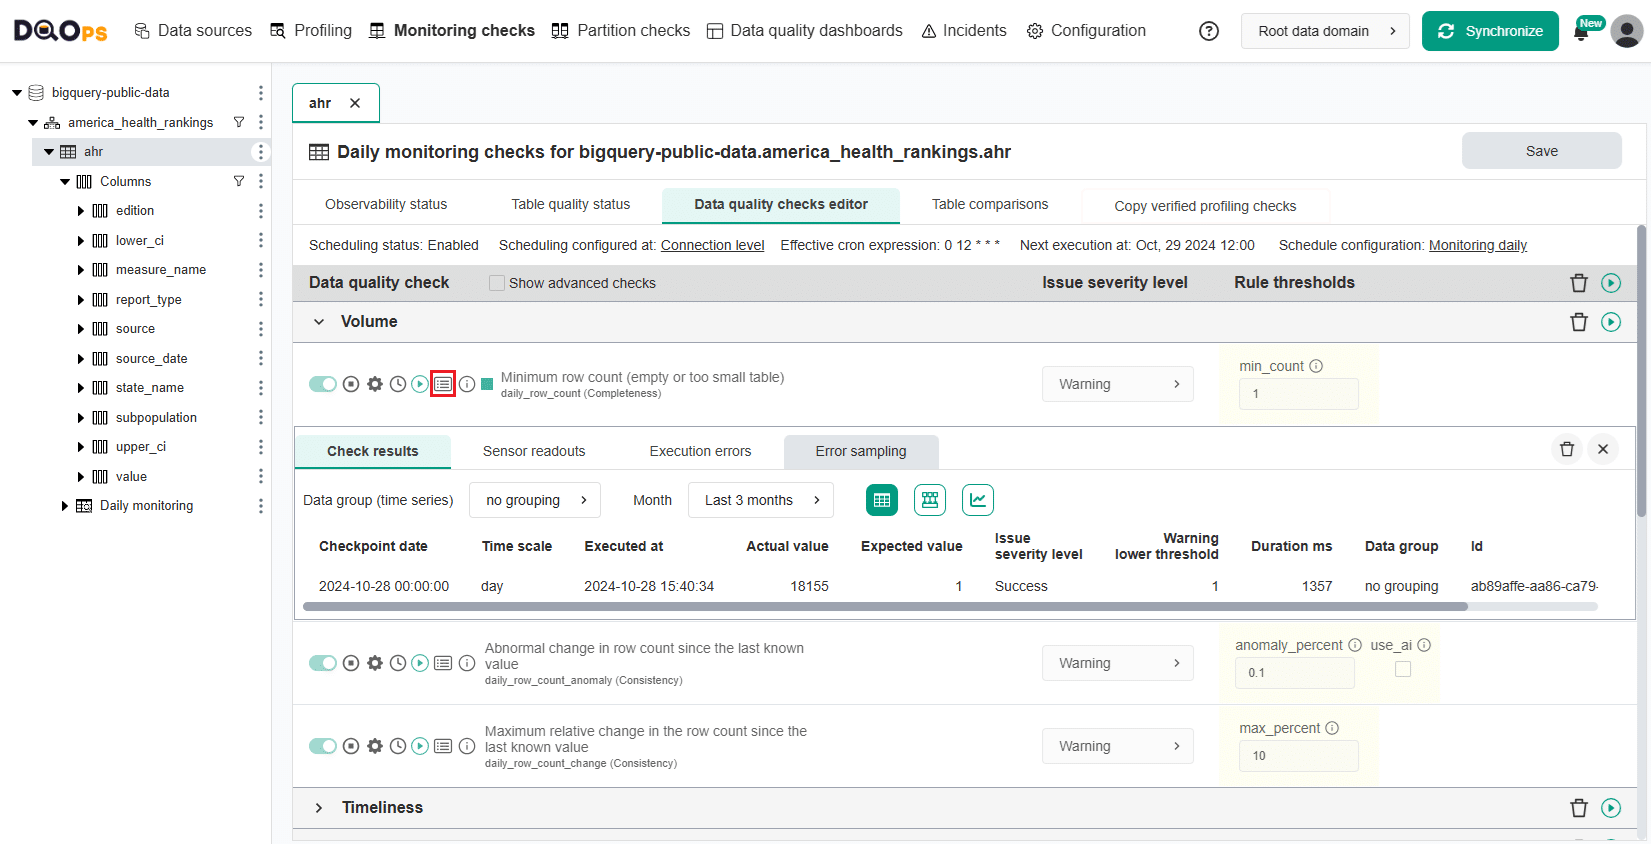
Within the Results window, you will see four tabs: Check results, Sensor readouts, Execution errors, and Error sampling.
- The Check results tab shows the severity level that result from the verification of sensor readouts by set rule thresholds.
- The Sensor readouts tab displays the values obtained by the sensors from the data source.
- The Execution errors tab displays any error that occurred during the check's execution.
- The Error sampling tab allows you to view representative examples of data that fail to meet specified data quality criteria.
Review the Table quality status
The Table quality status is a summary of the results of the executed checks, grouped by check category or data quality dimension. You can access it by clicking on the Table quality status tab on the table level.
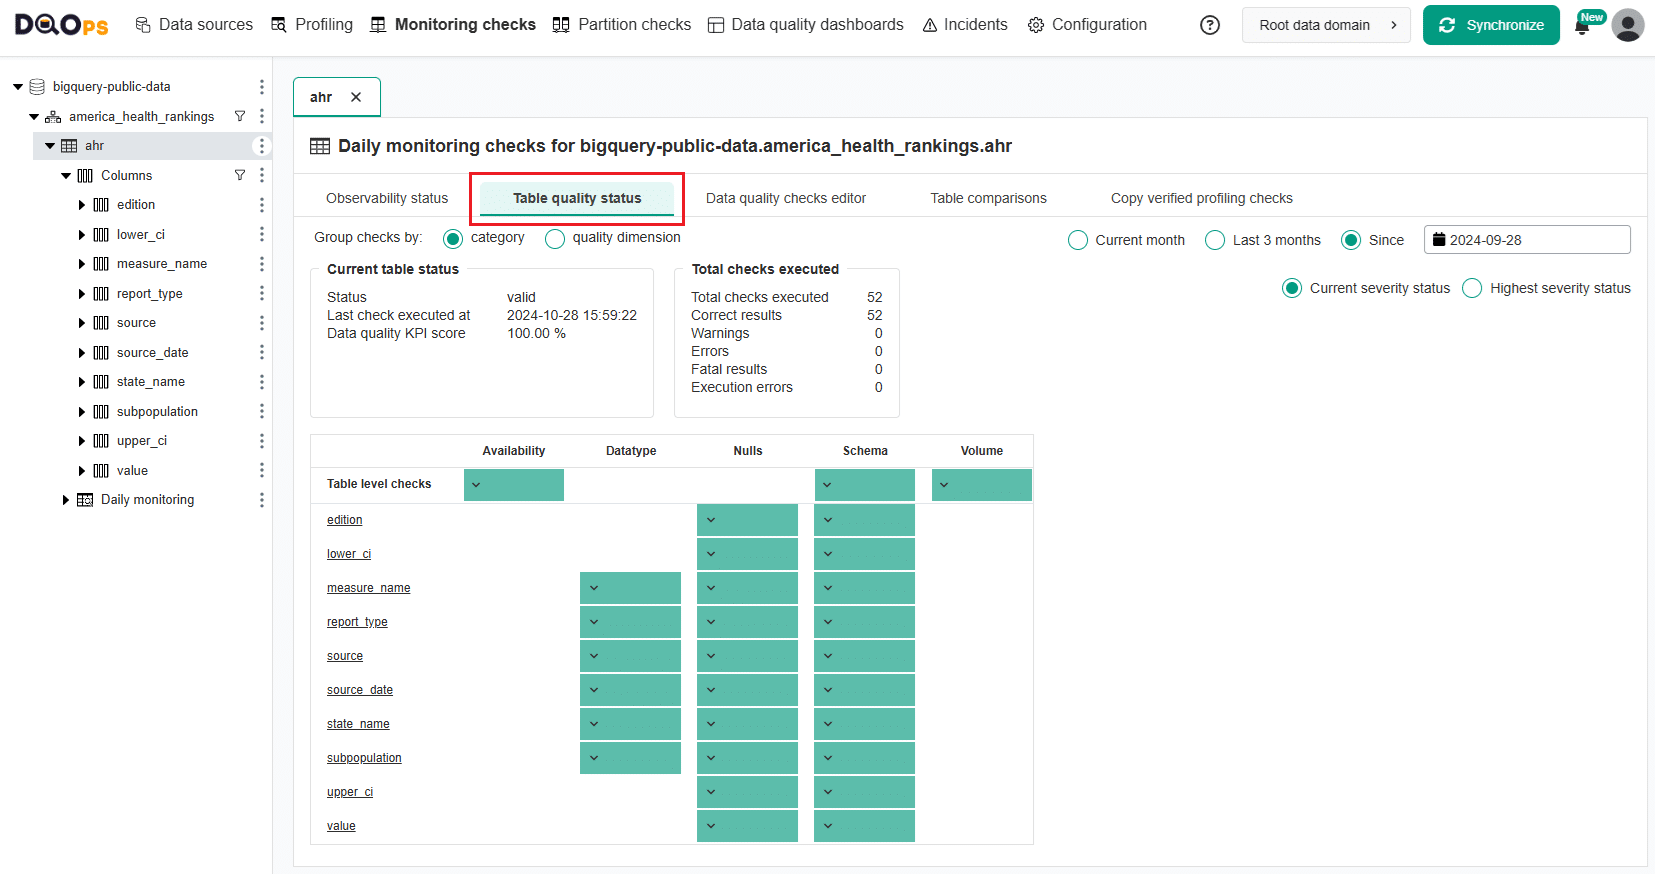
Read more about the Table quality status in the User interface section.
Review the Observability status
The Observability Status offers a quick overview of issues related to schema changes, volume anomalies, and freshness anomalies at the table level. It also highlights distinct count and null percentage anomalies at the column level.
Additionally, the screen summarizes data quality issues for the selected table or columns.
The number of elements on the screen depends on which checks have been activated. Please note that it may take a couple of days to collect data for anomaly detection checks.
Below is an example of the Observability Status screen at the table level in the Monitoring Section.
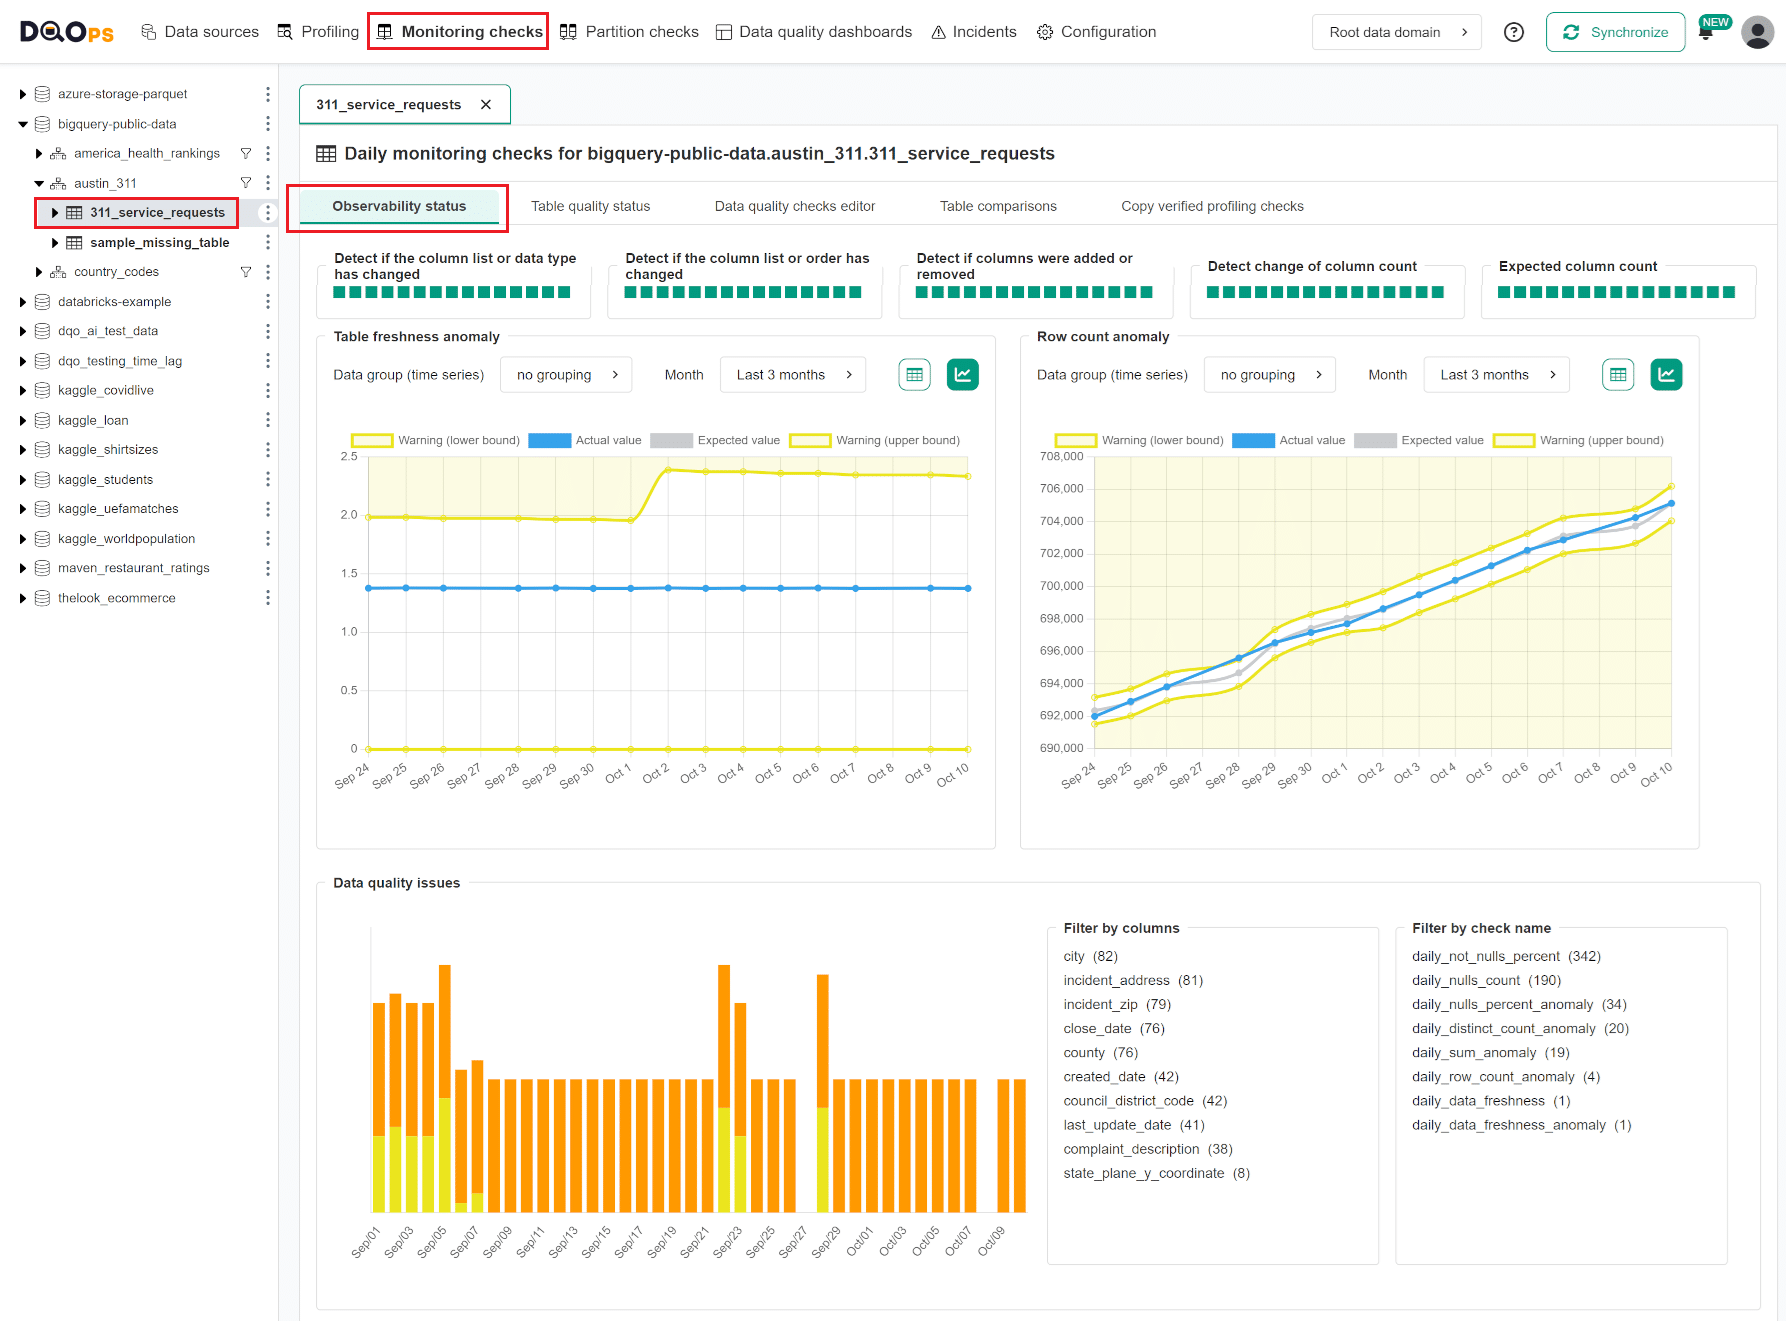
For more information, please visit the data observability documentation.
Configure more checks using the rule miner
DQOps automates the process of configuring data quality checks with its rule mining engine. The engine analyzes data collected from basic statistics and sample values to propose check configurations for detecting common data quality issues. It also suggests checks that will pass for the current data and serve as a baseline for detecting changes in data distribution over time.
You can find more information about data quality rule mining in the concept section.
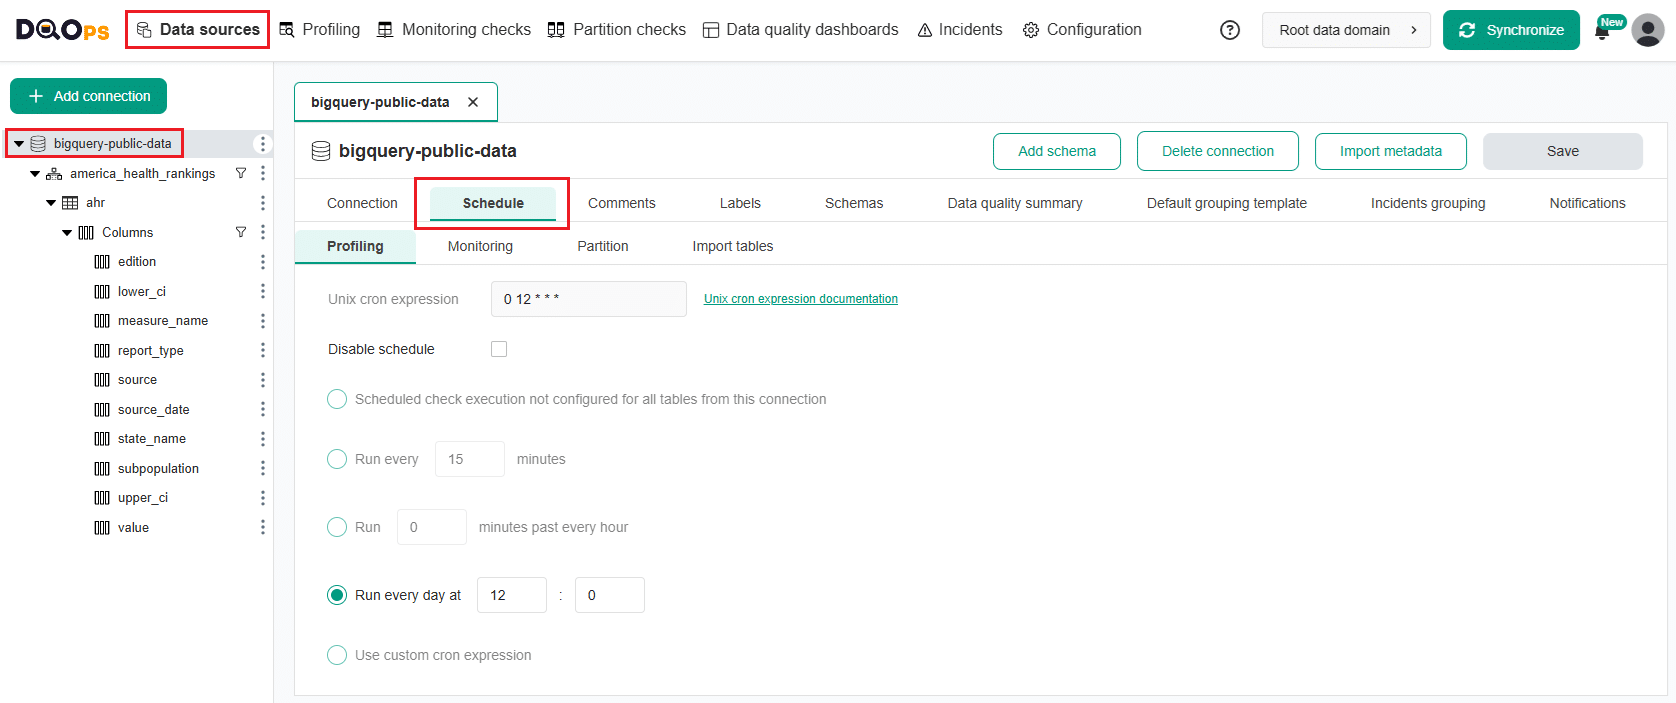
Verify schedule configuration
With DQOps, you can easily customize when checks are run by setting schedules. You can set schedules for an entire connection, table, or individual check.
To verify and modify the current schedule, go to Data Source section, select the data source of interest from the tree view on the left, and click on the Schedule tab on the main workspace. You can modify the schedule for each type of check separately.
Review the Incidents
With the help of DQOps, you can conveniently keep track of the issues that arise during data quality monitoring. DQOps groups issues into incidents.
The Incidents summary screen, provides a quick overview of all incidents within your environment. You can access it by clicking on the DQOps logo and selecting the Incidents summary tab.
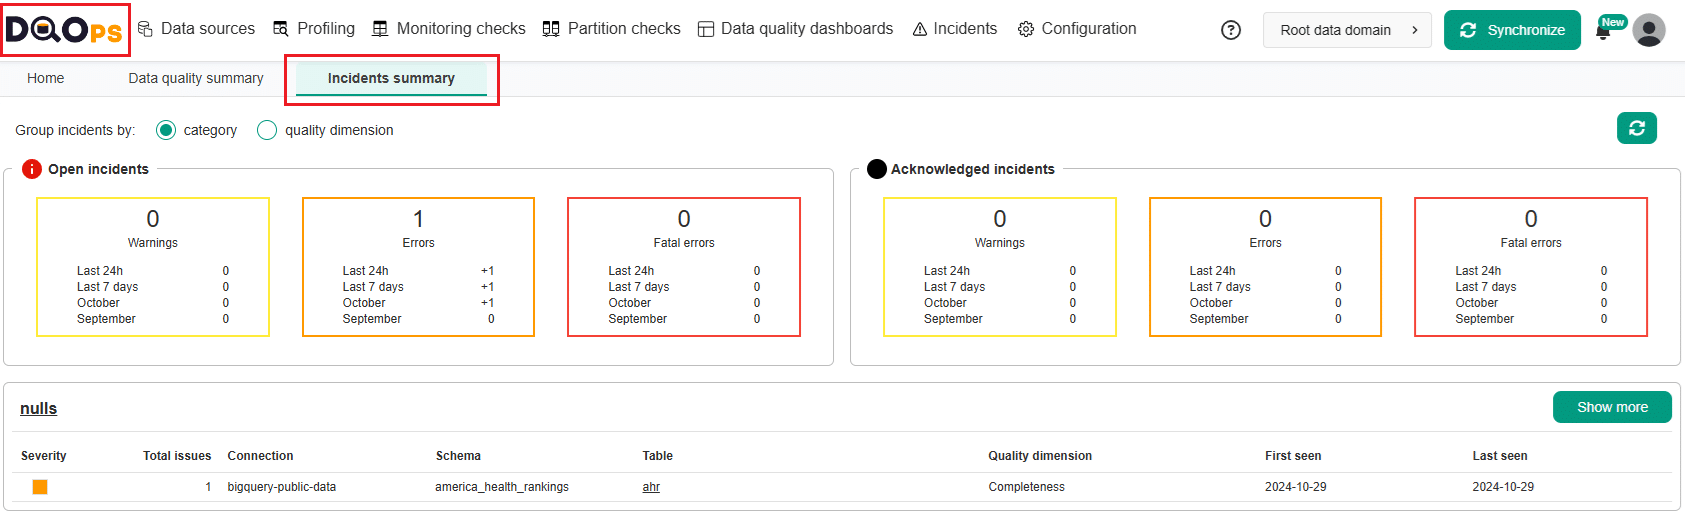
The Incidents section provides a more detailed view of the Incidents and allows you to view and filter them, as well as manage their status.
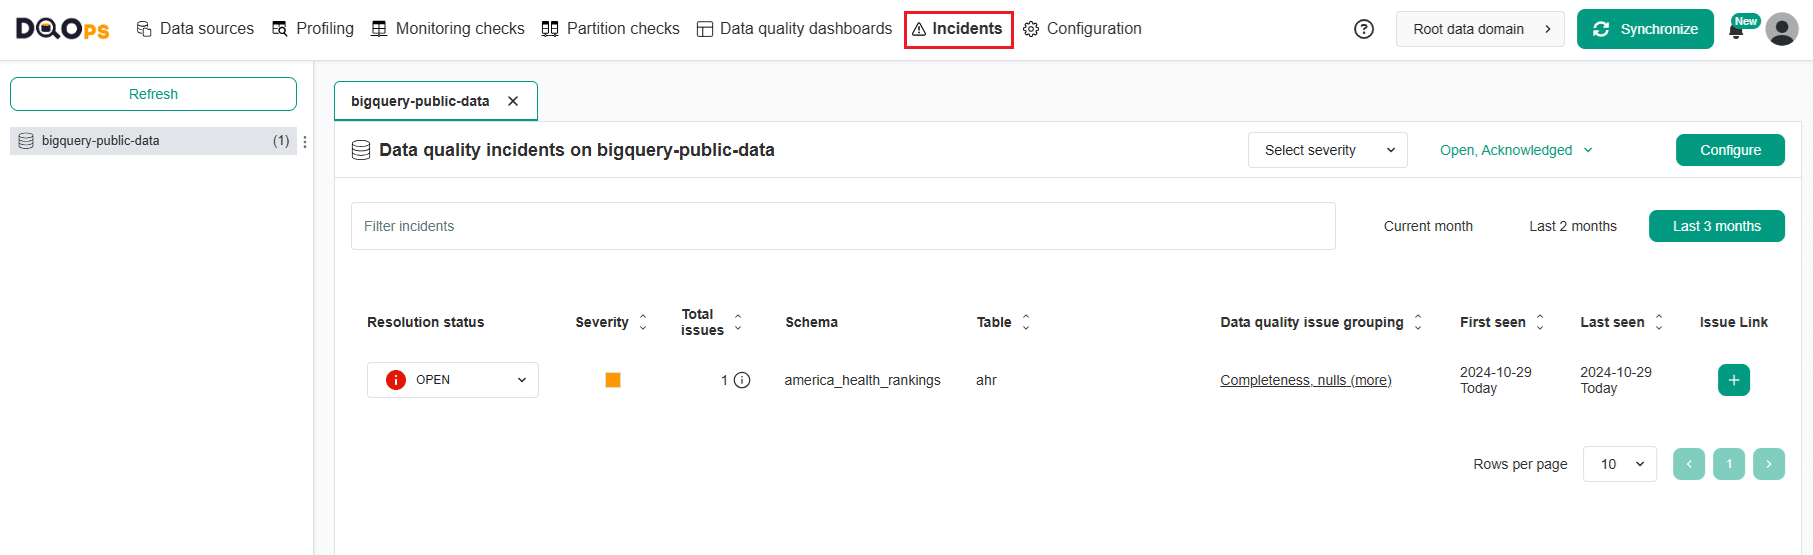
On the left side of the Incidents section, there is a list displaying the connections and the number of incidents that have occurred for each one. On the right panel, you can view incidents for the connections you have selected, and you can filter, sort, and view detailed information about the incidents.
We can see that we have one incident with 1 data quality issue. To review more details, click on the link in the Data quality issue grouping column.
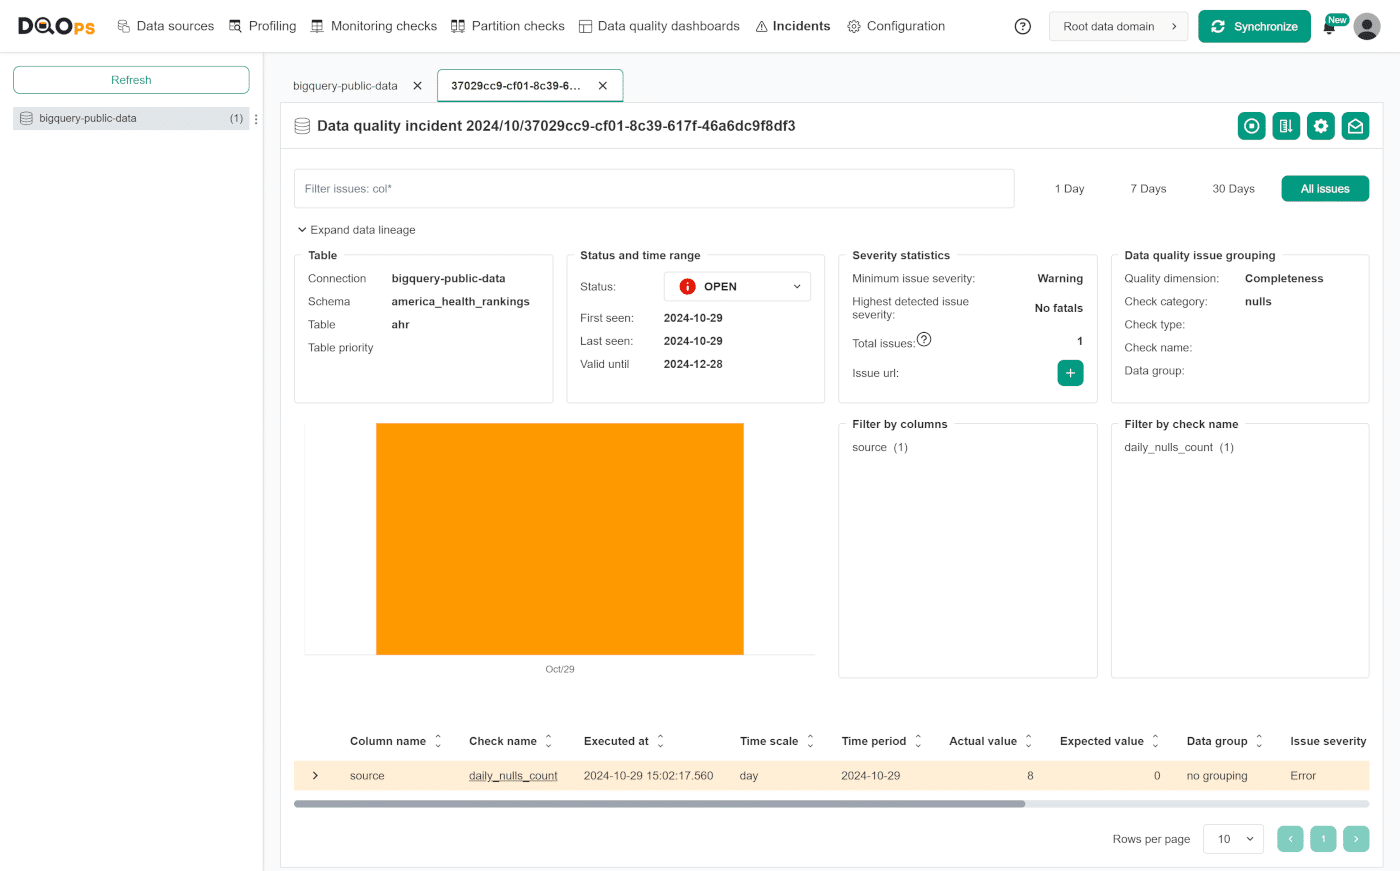
The upper right corner of the Incident details screen provides access to several helpful actions:
- Disable checks for the incident: This button allows you to temporarily disable the check responsible for the incident. Disabling a check can be useful when you are actively working to resolve the underlying issue.
- Reconfigure rule thresholds: Clicking on this button will decrease the rule threshold for the data quality check that caused the incident by 30% to reduce the number of data quality issues.
- Change incident configuration: This button opens the Incident configuration screen for the table where the incident originated. This allows you to manage incident settings, such as grouping and severity levels.
- Configure notification for this incident: This button allows you to create new or modify existing notification for this incident.
Read the full description of the Incidents section here.
Configure notifications
DQOps can send alert notifications whenever a new incident is created or modified. Notifications allow you to monitor data in real-time and receive alerts when active data quality checks detect an issue.
You can create or edit notification filters to receive notifications for specific data quality incidents. To do this, click on the envelope icon located in the top right corner of the incident details screen.
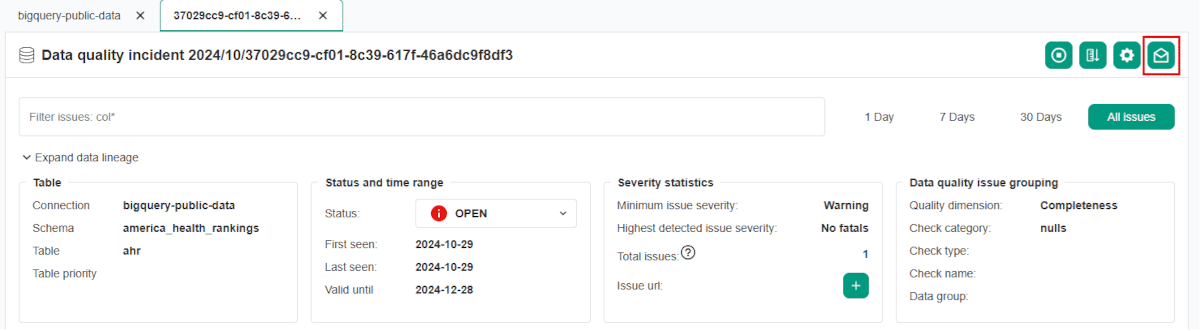
The action after clicking on the envelope icon will depend on whether the incident matches any existing incident notification filters.
Adding a new notification filter.
If no notification has ever been configured for the incident, you will see a popup message informing you to create a new notification configuration.
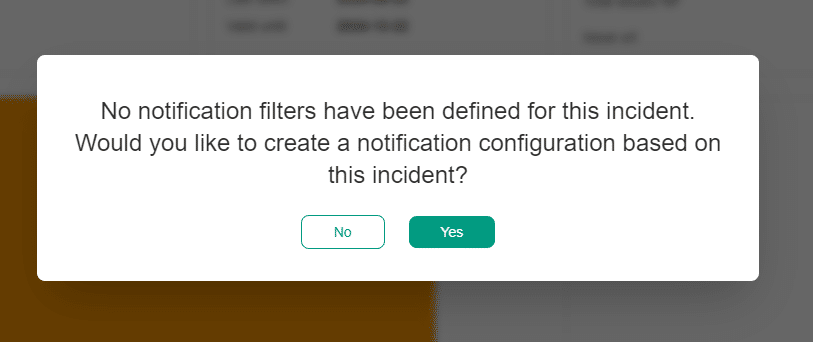
Once approved, you will be redirected to the page to create the new incident notification filter. The configuration form will be partially filled based on the incident's data. The details of the filter configuration can be found in the section Notification filters below.
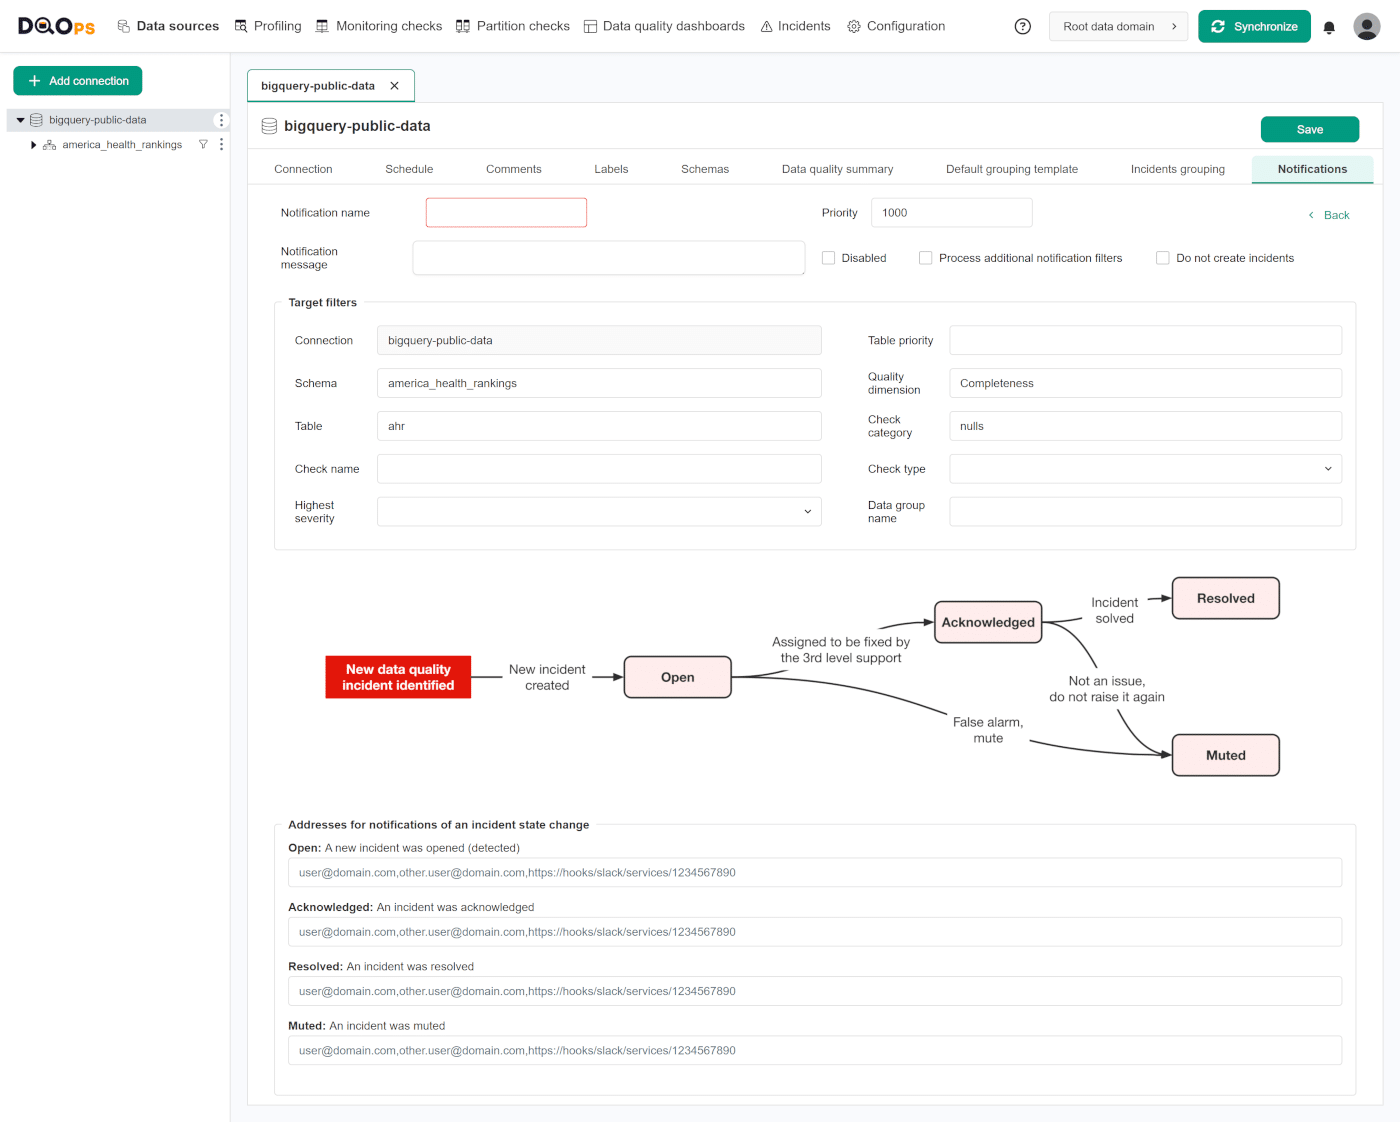
Editing an existing notification filter
If the notification matches an existing filter, a screen with this filter will open, and you can edit the filter's settings.
Learn more about the configuration of the notification filtering in the Concept section
Configure Slack notifications
DQOps supports integration with Slack Webhooks which are used to set up in-app Slack notifications.
Click the link for more information how to set up in-app Slack notifications.
Review the check results on dashboards
DQOps has multiple built-in data quality dashboards dedicated to analyzing results from data quality checks. You can learn more about different types of dashboards in the Concept section.
To be able to display results on data quality dashboards, you need to have a DQOps account and synchronize locally stored results with it.
To synchronize the data just click on the Synchronize button in the upper right corner of the navigation tab.
To view dashboards, simply go to the Data Quality Dashboard section, and select the dashboard of interest from the tree view on the left.
Below are examples of several dashboards.
Current table status dashboards
Current table status dashboards allow data engineers and data owners to quickly evaluate the data quality of monitored tables and columns. The dashboards display a color-coded status that indicates the severity level detected by run checks. When the status is green, it means that the monitored column has no data quality issues. However, if the status is yellow, orange, or red, it indicates that there were some issues detected. The dashboard also displays the number of detected issues per severity threshold, making it easier to identify and address tables and columns with issues.
These dashboards allow filtering data by:
- time frame,
- connection,
- schema,
- data quality dimension,
- check category,
- data group,
- table,
- column.
Current table status dashboard is a representative of this group.

Data quality KPIs
Data quality KPIs dashboards show high-level data quality KPIs, aggregated on a macro scale that can be shared at a corporate level. DQOps calculates data quality KPIs as a percentage of passed data quality checks for each connection, schema, data grouping, etc.
With these dashboards, senior management can review a summary of data quality KPIs or evaluate the KPIs per table, column, data quality dimensions, check category, data grouping and day.
KPIs per table and day is a representative of this group. It allows reviewing data quality KPIs per table and day of the month.
This dashboard allows filtering data by:
- current and previous month,
- connection,
- schema,
- data group,
- stage,
- priority,
- data quality dimension,
- check category,
- check name,
- column
- table,
- day of the month.

Data quality issues count
Data quality issues dashboards allow evaluation of the number issues and its severity level per table, or per check category. Another two types of dashboards in this subgroup allows reviewing the total number of failed checks (warning, error, fatal) per day of the month, or per table and day of the month.
Data quality failed checks per table and day is a representative of this group.
This dashboard allows filtering data by:
- severity
- current and previous month,
- connection,
- schema,
- stage
- priority,
- data group,
- data quality dimension,
- check category,
- check name,
- table,
- day of the month.

What's next
- You haven't installed DQOps yet? Check the detailed guide on how to install DQOps using pip or run DQOps as a Docker container.
- DQOps provide you with summary statistics about your table and column. This information can be valuable in deciding which data quality checks and threshold levels should be set to monitor data quality. For more details about Basic data statistics, click here.
- The data in the table often comes from different data sources and vendors or is loaded by different data pipelines. Learn how data grouping in DQOps can help you calculate separate data quality KPI scores for different groups of rows.