Last updated: October 22, 2024
How to detect empty tables using data observability checks
This sample shows how to use the default DQOps data observability checks to detect empty tables.
Overview
The following example shows how to detect empty tables using the default data observability checks which are activated in DQOps once new tables are imported.
PROBLEM
Austin-311-Public-Data provides the residents of Austin with a simple single point of contact for every city department.
What started as police non-emergency line for the City of Austin has become a robust Citywide Information Center where ambassadors are available to answer residents’ concerns 24 hours a day, 7 days a week, and 365 days a year.
We want to detect if the newly imported table contains rows.
SOLUTION
Using default monitoring daily_row_count table check, we will
verify if the table 311_servie_request is not empty. The default threshold of daily_row_count is set as warning 1.
If you want to learn more about checks and threshold levels, please refer to the DQOps concept section.
VALUE
If the newly imported column is empty a warning alert will be triggered.
Default checks configuration
Once new tables are imported, DQOps will automatically activate the default profiling and monitoring checks. If you want to learn more about the default observability checks and view a list of them, click on the link provided.
By default, all the checks are scheduled to run daily at 12:00 a.m.
Run the example using the user interface
A detailed explanation of how to start DQOps platform and run the example is described here.
Navigate to a list of checks
To navigate to a list of checks prepared in the example using the user interface:
-
Go to the Monitoring section.
The Monitoring Checks section enables the configuration of data quality checks that are designed for the daily and monthly monitoring of your data source.
-
Select the
311_service_requeststable from the tree view on the left.On the tree view you can find the tables that you have imported. Here is more about adding connection and importing tables.
-
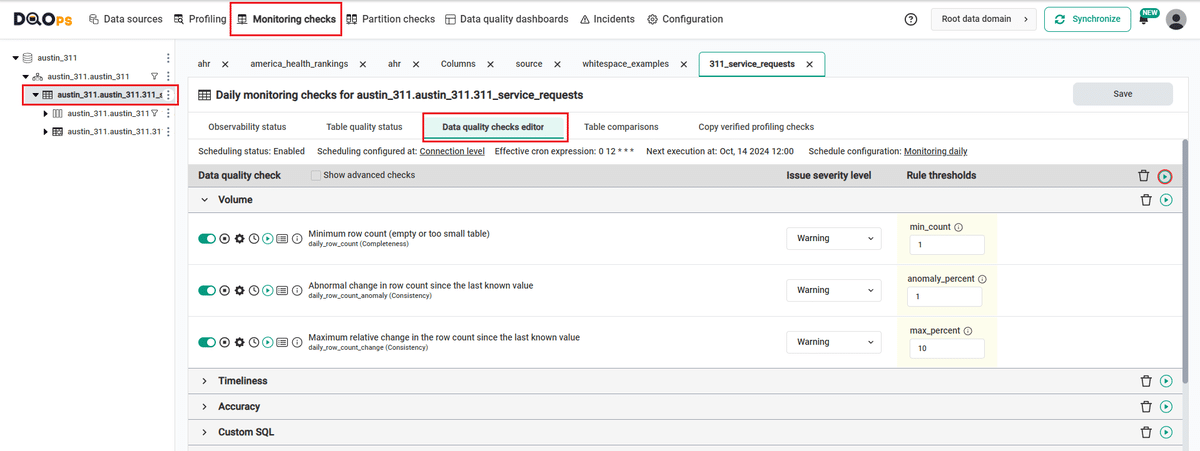
Select the Data quality checks editor tab.
This tab displays a list of data quality checks in the check editor. Here you can view the list of all table monitoring checks. Noticed the checks that have been activated upon importing new tables have switched on the toggle button. The icons located before the name of each check allow you to: activate and deactivate it, configure settings, run a check, review results, and get more information about it.
Learn more about navigating the check editor.
Run checks
Run the activated daily_row_count check using the Run check button.
You can also run all the checks for an entire subcategory of checks using the Run check button at the end of the line with the check subgroup name.

View detailed check results
Access the detailed results by clicking the Results button. The results should be similar to the one below.

Within the Results window, you will see three categories: Check results, Sensor readouts, and Execution errors. The Check results category shows the severity level that result from the verification of sensor readouts by set rule thresholds. The Sensor readouts category displays the values obtained by the sensors from the data source. The Execution errors category displays any error that occurred during the check's execution.
The actual value in this example is 1 748 850, which is above the maximum threshold level set in the warning (1). The check gives a correct result (notice the green square to the left of the check name).
Synchronize the results with the cloud account
Synchronize the results with your DQOps cloud account using the Synchronize button located in the upper right corner of the user interface.
Synchronization ensures that the locally stored results are synced with your DQOps Cloud account, allowing you to view them on the dashboards.
YAML configuration file
The YAML configuration file is where the details about tables and their check configurations are stored.
In the example provided, only the configuration for one column, unique_key, is visible for clarity.
However, the rest of the columns' configurations can also be found in the YAML file.
The highlighted sections in the YAML file below show where the daily_row_count monitoring check is configured.
If you want to learn more about checks and threshold levels, please refer to the DQOps concept section.
# yaml-language-server: $schema=https://cloud.dqops.com/dqo-yaml-schema/TableYaml-schema.json
apiVersion: dqo/v1
kind: table
spec:
  incremental_time_window:
    daily_partitioning_recent_days: 7
    monthly_partitioning_recent_months: 1
  profiling_checks:
    volume:
      profile_row_count:
        warning:
          min_count: 1
    schema:
      profile_column_count: {}
  monitoring_checks:
    daily:
      volume:
        daily_row_count:
          warning:
            min_count: 1
        daily_row_count_anomaly:
          warning:
            anomaly_percent: 1.0
        daily_row_count_change:
          warning:
            max_percent: 10.0
      availability:
        daily_table_availability:
          warning:
            max_failures: 0
      schema:
        daily_column_count: {}
        daily_column_count_changed:
          warning: {}
        daily_column_list_changed:
          warning: {}
        daily_column_list_or_order_changed:
          warning: {}
        daily_column_types_changed:
          warning: {}
  columns:
    unique_key:
      type_snapshot:
        column_type: STRING
        nullable: true
      profiling_checks:
        nulls:
          profile_nulls_count:
            warning:
              max_count: 0
          profile_nulls_percent: {}
          profile_not_nulls_count:
            warning:
              min_count: 1
      monitoring_checks:
        daily:
          nulls:
            daily_nulls_count: {}
            daily_nulls_percent: {}
            daily_not_nulls_count:
              warning:
                min_count: 1
            daily_not_nulls_percent: {}
            daily_nulls_percent_anomaly:
              warning:
                anomaly_percent: 1.0
            daily_nulls_percent_change_1_day:
              warning:
                max_percent: 10.0
                exact_day: false
          uniqueness:
            daily_distinct_count_anomaly:
              warning:
                anomaly_percent: 1.0
          datatype:
            daily_detected_datatype_in_text_changed:
              warning: {}
          schema:
            daily_column_exists:
              warning: {}
            daily_column_type_changed:
              warning: {}
In this example, we have demonstrated how to use DQOps to detect empty tables. By using the default daily_row_count table check, we can monitor that the newly imported tables are not empty. If they are, you will get a warning result.
Next steps
- You haven't installed DQOps yet? Check the detailed guide on how to install DQOps using pip or run DQOps as a Docker container.
- DQOps allows you to keep track of the issues that arise during data quality monitoring and send alert notifications directly to Slack. Learn more about incidents and Slack notifications.
- The data in the table often comes from different data sources and vendors or is loaded by different data pipelines. Learn how data grouping in DQOps can help you calculate separate data quality KPI scores for different groups of rows.