Last updated: November 13, 2024
How to detect data type changes in the landing zone tables using a data quality check
This sample shows how to use data quality checks to detect data type changes in the landing zone tables using a data quality check.
Overview
This example shows how to verify that the data type in a column in the landing zone tables has not changed.
PROBLEM
We will be testing House Price Prediction Treated dataset. This dataset contains house sale prices for King County, which includes Seattle. It includes homes sold between May 2014 and May 2015.
In the date column, which contains the date of sale of the house, we want to check whether the data type does not change, e.g. by the appearance of a row in the datetime format.
SOLUTION
We will verify the data using monitoring detected_datatype_in_text_changed column check.
Our goal is to verify whether the data type in the date column has changed.
In this example, we will set one threshold level for the check:
- error
If you want to learn more about checks and threshold levels, please refer to the DQOps concept section.
VALUE
f the data type in the date column changes, an error alert will be triggered.
Data structure
The following is a fragment of the house-price-prediction-treated-dataset dataset
| date | price | bedrooms | grade | has_basement | living_in_m2 | renovated | nice_view | perfect_condition | real_bathrooms | has_lavatory | single_floor | month | quartile_zone |
|---|---|---|---|---|---|---|---|---|---|---|---|---|---|
| 2014-09-26 | 305000.0 | 2 | 1 | False | 76.18046 | False | False | True | 1 | False | True | 9 | 2 |
| 2014-05-14 | 498000.0 | 3 | 2 | True | 210.88981 | False | False | False | 2 | True | True | 5 | 2 |
| 2015-03-23 | 590000.0 | 2 | 4 | False | 262.91549 | False | False | False | 2 | True | False | 3 | 2 |
| 2014-07-15 | 775000.0 | 3 | 3 | False | 159.79316 | False | False | False | 1 | True | False | 7 | 3 |
| 2015-04-14 | 350000.0 | 2 | 1 | False | 92.903 | False | False | False | 1 | True | True | 4 | 3 |
| 2015-05-08 | 399000.0 | 2 | 2 | False | 201.59951 | False | False | False | 1 | True | True | 5 | 1 |
| 2014-10-15 | 325000.0 | 1 | 2 | False | 94.76106 | False | False | False | 1 | True | False | 10 | 3 |
| 2014-07-15 | 250000.0 | 3 | 2 | True | 177.44473 | False | False | False | 2 | True | True | 7 | 1 |
| 2015-02-25 | 445000.0 | 3 | 2 | False | 360.46364 | False | False | False | 3 | False | False | 2 | 2 |
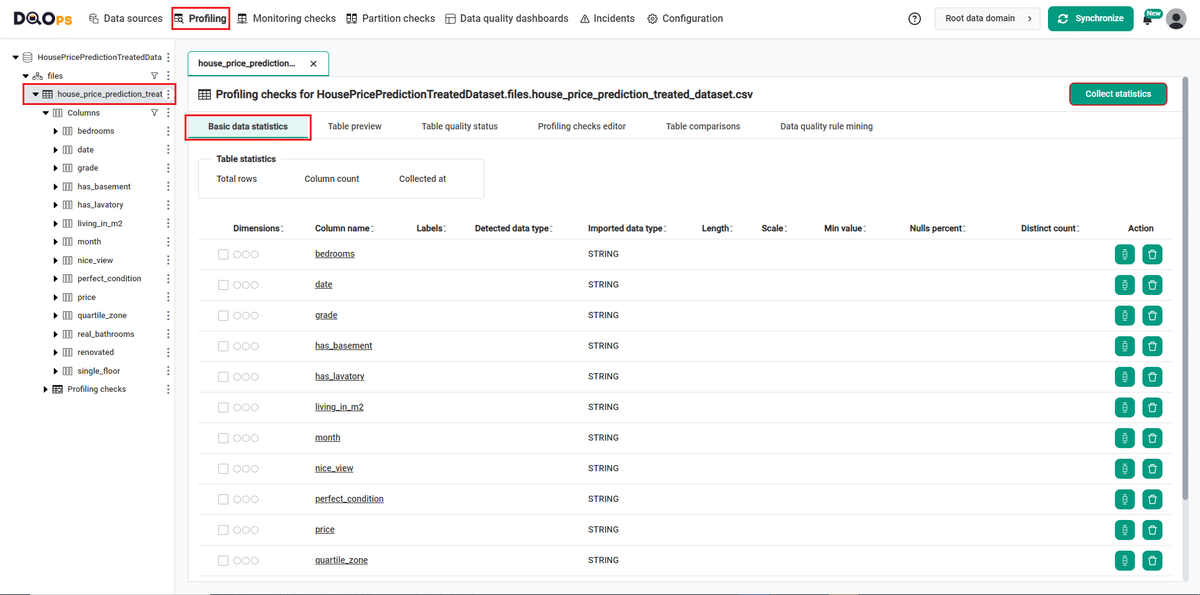
In the landing table, the data in all 14 columns is defined as STRING, which we can check by selecting the selected column from the tree view on the left or by navigating to Basic data statistic in the Profiling tab.
To navigate to a Basic data statistic in the example using the user interface:
-
Go to the Profiling section.
In the profiling section, there is a process that provides a high-level overview that helps uncover data quality issues, risks, and overall trends. Data profiling provides key insights into the data that companies can use to their advantage.
-
Select the table or column mentioned in the example description from the tree view on the left.
On the tree view you can find the tables that you have imported. Here is more about adding connection and importing tables.
-
Select the Basic data statistic tab.
This tab allows you to collect basic statistics about data sources during the data profiling stage. To do this, click the Collect statistics button in the upper right corner.
Run the example using the user interface
A detailed explanation of how to start DQOps platform and run the example is described here.
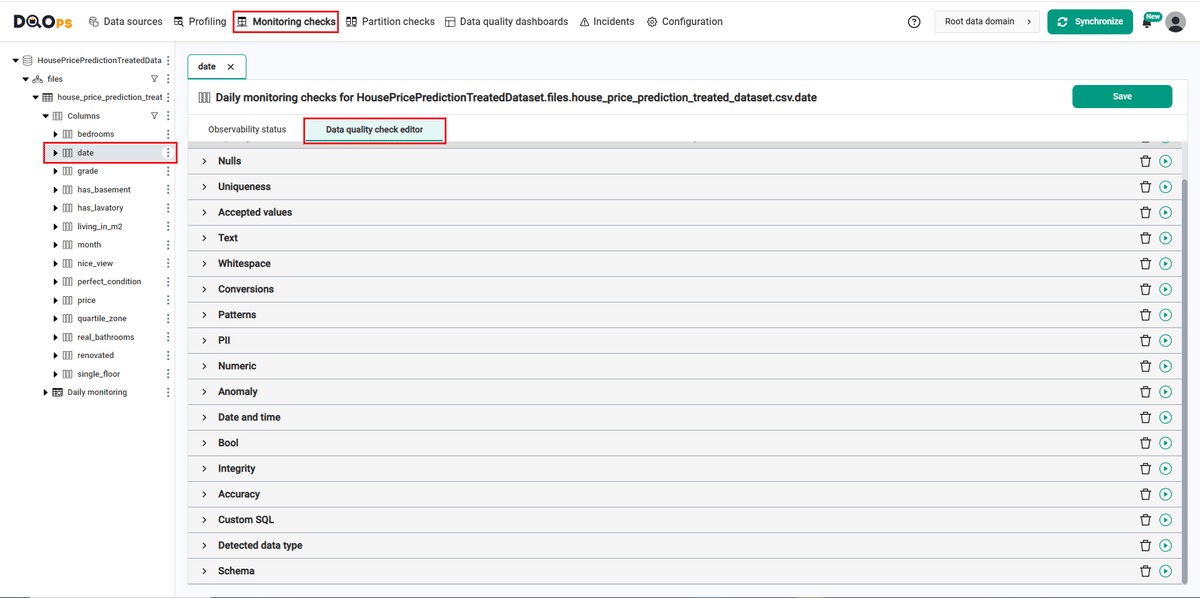
Navigate to a list of checks
To navigate to a list of checks prepared in the example using the user interface:
-
Go to the Monitoring section.
The Monitoring Checks section enables the configuration of data quality checks that are designed for the daily and monthly monitoring of your data source.
-
Select the table or column mentioned in the example description from the tree view on the left.
On the tree view you can find the tables that you have imported. Here is more about adding connection and importing tables.
-
Select the Data quality checks editor tab.
This tab displays a list of data quality checks in the check editor. Learn more about navigating the check editor.
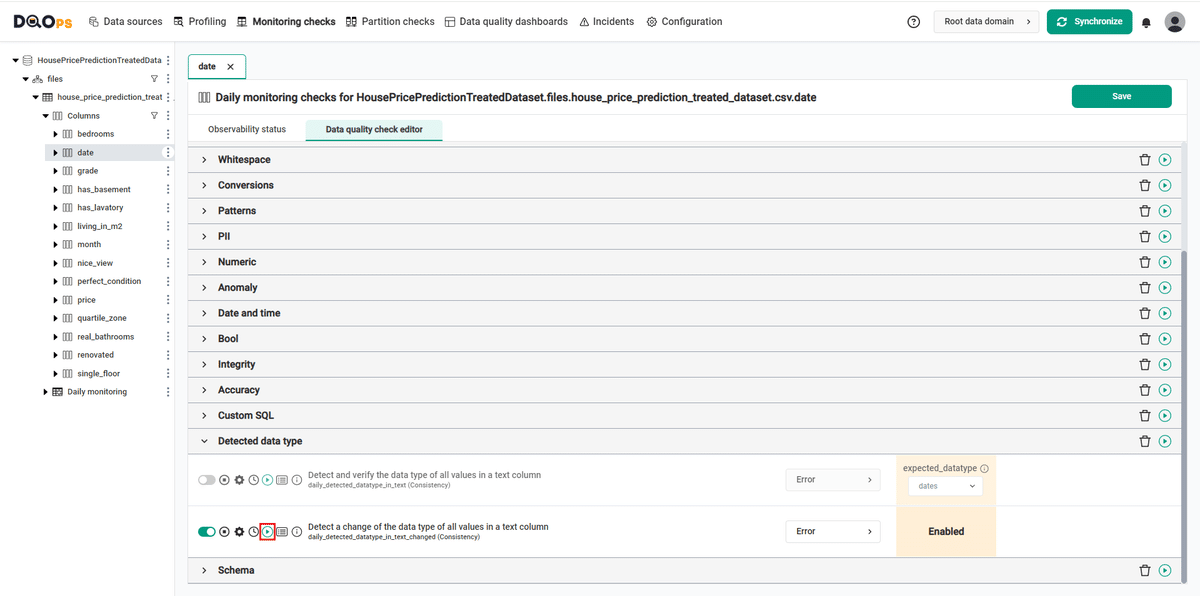
Run checks
Run the activated check using the Run check button.
You can also run all the checks for an entire subcategory of checks using the Run check button at the end of the line with the check subgroup name.
View detailed check results
Access the detailed results by clicking the Results button. The results should be similar to the one below.
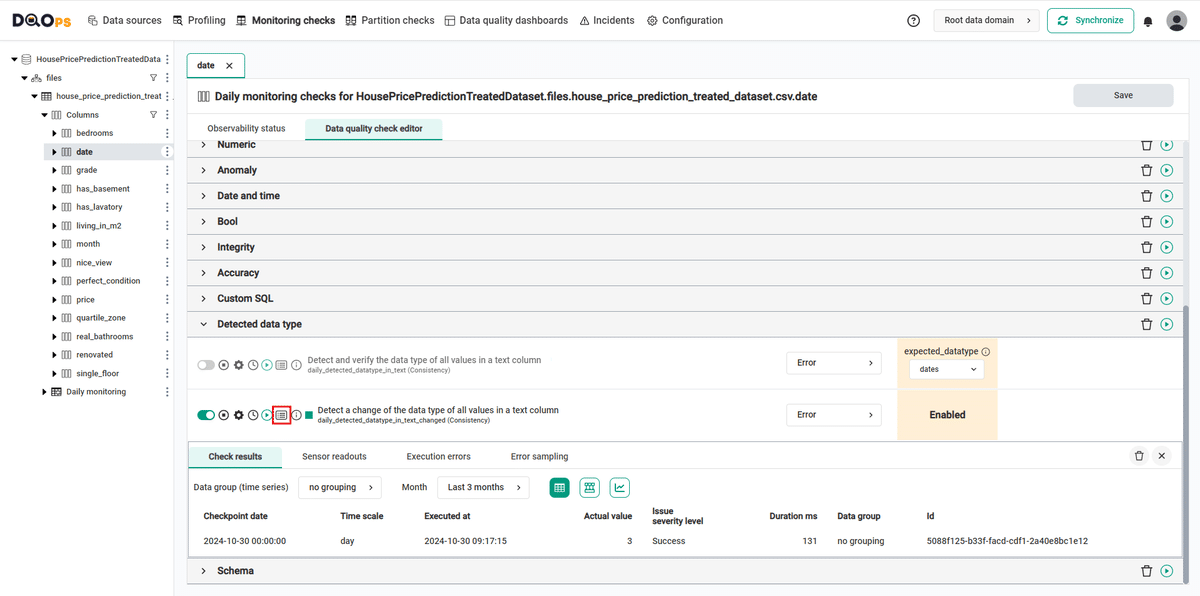
Within the Results window, you will see four categories: Check results, Sensor readouts, Execution errors, and Error sampling. The Check results category shows the severity level that result from the verification of sensor readouts by set rule thresholds. The Sensor readouts category displays the values obtained by the sensors from the data source. The Execution errors category displays any error that occurred during the check's execution. The Error sampling category displays examples of invalid values in the column.
The check in the example gives the correct result (notice the green square to the left of the check's name).
Add a row to the table containing a different data type
Now we will add the new row with a different datatype in the date column, so when we run the checks again we can see the error alerts.
| date | price | bedrooms | grade | has_basement | living_in_m2 | renovated | nice_view | perfect_condition | real_bathrooms | has_lavatory | single_floor | month | quartile_zone |
|---|---|---|---|---|---|---|---|---|---|---|---|---|---|
| 2014-09-26 00:00:00 | 305000.0 | 1 | 1 | False | 76.18046 | False | False | True | 1 | False | True | 9 | 2 |
Evaluate results after changing the data type
Because the daily checks stores the most recent result for each day when the data quality check was evaluated, the checks were run on the next day.
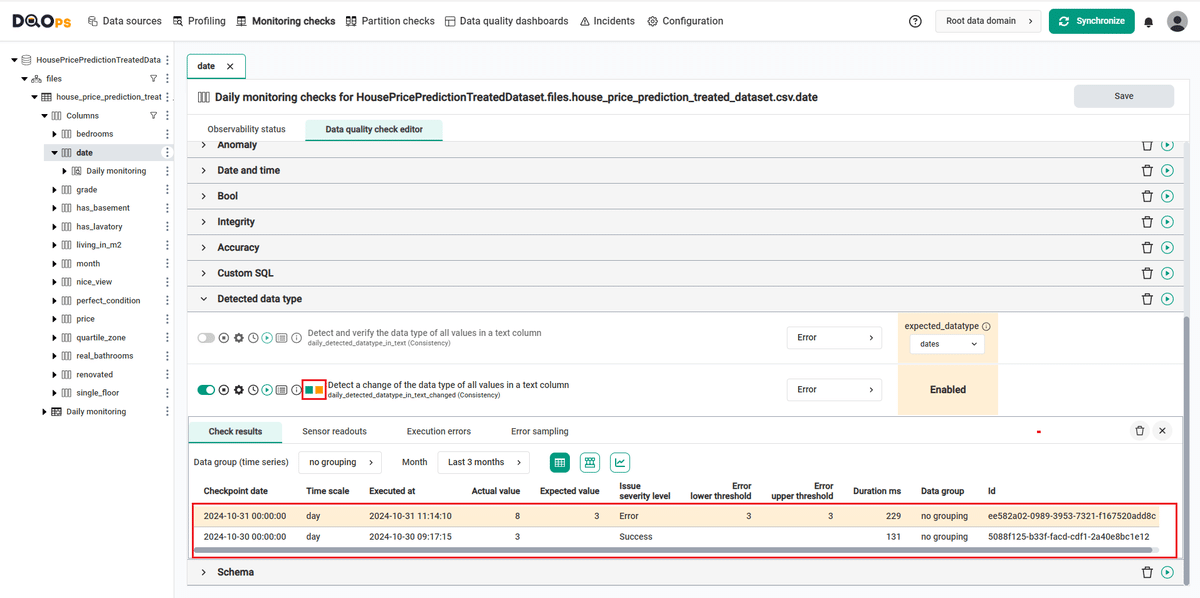
- for the
datecolumn where we have added the row that changed the data type, we can see an error alert in thedaily_detected_datatype_in_text_changedcheck.
Synchronize the results with the cloud account
Synchronize the results with your DQOps cloud account using the Synchronize button located in the upper right corner of the user interface.
Synchronization ensures that the locally stored results are synced with your DQOps Cloud account, allowing you to view them on the dashboards.
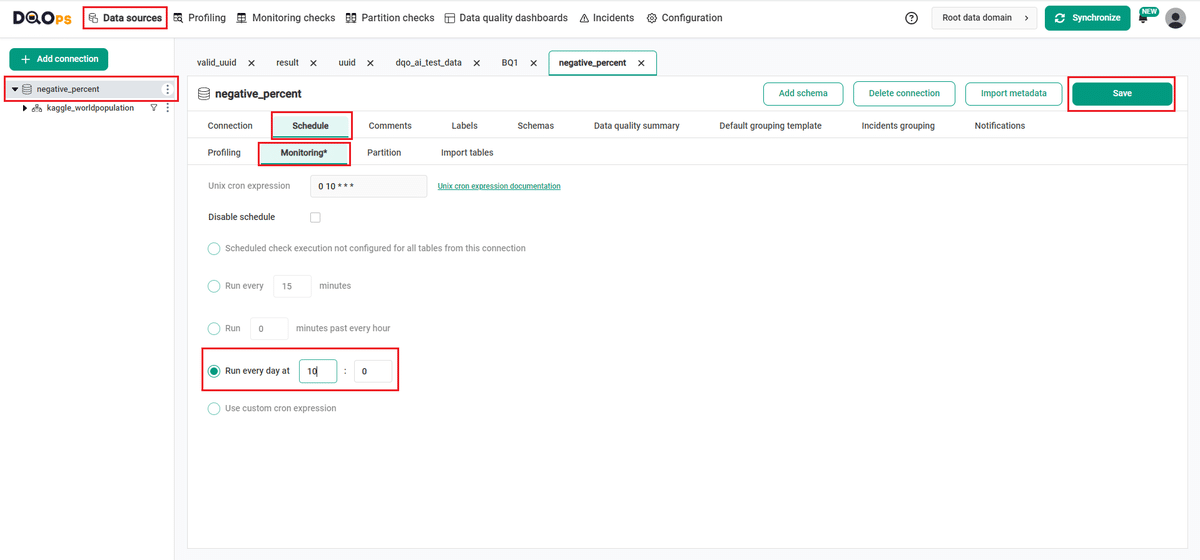
Change a schedule at the connection level
With DQOps, you can easily customize when checks are run by setting schedules. You can set schedules for an entire connection, table, or individual check.
After importing new tables, DQOps sets the schedule for 12:00 P.M. (noon) every day. Follow the steps below to change the schedule.
-
Navigate to the Data Source section.
-
Choose the connection from the tree view on the left.
-
Click on the Schedule tab.
-
Select the Monitoring daily tab
-
Select the Run every day at and change the time, for example, to 10:00. You can also select any other option.
-
Once you have set the schedule, click on the Save button to save your changes.
By default, scheduler is active. You can turn it off by clicking on notification icon in the top right corner of the screen, and clicking the toggle button.

Once a schedule is set up for a particular connection, it will execute all the checks that have been configured across all tables associated with that connection.
You can read more about scheduling here.
You might also want to check the Running checks with a scheduler example.
YAML configuration file
The YAML configuration file stores both the table details and checks configurations.
The highlighted fragments in the YAML file below represent the segment where the detect data type changes check are configured.
If you want to learn more about checks and threshold levels, please refer to the DQOps concept section.
apiVersion: dqo/apiVersion: dqo/v1
kind: table
spec:
   incremental_time_window:
      daily_partitioning_recent_days: 7
      monthly_partitioning_recent_months: 1
   columns:
      date:
         type_snapshot:
            column_type: STRING
            nullable: true
         monitoring_checks:
            daily:
               datatype:
                  daily_detected_datatype_in_text_changed:
                     error: {}
      price:
         type_snapshot:
            column_type: STRING
            nullable: true
Next steps
- You haven't installed DQOps yet? Check the detailed guide on how to install DQOps using pip or run DQOps as a Docker container.
- For details on the table schema checks used in this example, go to the check details section.
- DQOps provides you with summary statistics about your table and column. This information can be valuable in deciding which data quality checks and threshold levels should be set to monitor data quality. For more details about Basic data statistics, click here.
- DQOps allows you to keep track of the issues that arise during data quality monitoring and send alert notifications directly to Slack. Learn more about incidents and Slack notifications.
- The data in the table often comes from different data sources and vendors or is loaded by different data pipelines. Learn how data grouping in DQOps can help you calculate separate data quality KPI scores for different groups of rows.