One of the fundamental dimensions of data quality is timeliness
This metric can be measured in several ways, depending on the metric to check.
In this article, we will show how to set up a table timeliness check column_datatime_difference_percent.
We will use the bigquery-public-data.austin_crime.crime dataset for the example.
Table of Contents

Data quality best practices - a step-by-step guide to improve data quality
- Learn the best practices in starting and scaling data quality
- Learn how to find and manage data quality issues
Running BigQuerry example
We will utilize the BigQuery dataset to illustrate how the data freshness check functions. Prior to executing this example, ensure that your GCP project environmental variable is properly defined. In case any issues arise, refer to our guide on getting started with DQOps.
You will find there a paragraph defining prerequisites for running an example.
The table used in our example is called bigquery-public-data.austin_crime.crime. For the purpose of demonstration, we use columns clearance_date and timestamp.
Those two contain timestamps we will calculate the average difference for. For better problem depiction here are the first 10 rows for chosen columns:
unique_key, clearance_date, and timestamp
					+-------------+----------------------+----------------------+
| unique_key  |    clearance_date    |      timestamp       |
+-------------+----------------------+----------------------+
|  2015150483 | 2015-01-27T12:00:00Z | 2015-01-15T12:00:00Z |
| 20151542027 | 2015-07-24T12:00:00Z | 2015-06-03T12:00:00Z |
| 20152001758 | 2015-08-15T12:00:00Z | 2015-07-19T12:00:00Z |
| 20151340282 | 2015-06-15T12:00:00Z | 2015-05-14T12:00:00Z |
| 20151871268 | 2015-10-27T12:00:00Z | 2015-07-06T12:00:00Z |
| 20155032413 | 2015-10-19T12:00:00Z | 2015-07-24T12:00:00Z |
|  2015900289 | 2015-04-23T12:00:00Z | 2015-03-31T12:00:00Z |
| 20151060966 | 2015-04-23T12:00:00Z | 2015-04-16T12:00:00Z |
| 20151460876 | 2015-07-15T12:00:00Z | 2015-05-26T12:00:00Z |
| 20155024205 | 2015-12-17T12:00:00Z | 2015-06-05T12:00:00Z |
+-------------+----------------------+----------------------+
The next step is to add a connection and import tables. DQOps’s documentation provides a simple guide for these two actions.
Check configuration
After establishing the connection and importing the table’s configuration you can access it by running the following line of code:
table edit -c=<connection_name> -t=austin_crime.crime
We should now take a look at the YAML configuration file. This is a place where we can change conditions on how our check works.
					# yaml-language-server: $schema=https://cloud.dqo.ai/dqo-yaml-schema/TableYaml-schema.json
apiVersion: dqo/v1
kind: table
spec:
  target:
    schema_name: austin_crime
    table_name: crime
  time_series:
    mode: current_time
    time_gradient: day
  checks:
    timeliness:
      column_datetime_difference_percent:
        parameters:
          column1: clearance_date
          column2: timestamp
          max_difference: 10
        rules:
          min_count:
            low:
              min_value: 90.0
            medium:
              min_value: 80.0
            high:
              min_value: 70.0
  columns:
    unique_key:
      type_snapshot:
        column_type: INT64
        nullable: true
    ...
    clearance_date:
      type_snapshot:
        column_type: TIMESTAMP
        nullable: true
    ...
    timestamp:
      type_snapshot:
        column_type: TIMESTAMP
        nullable: true
    ...
Our interest at this point focuses on a part of the YAML file shown below
					  checks:
    timeliness:
      column_datetime_difference_percent:
        parameters:
          column1: clearance_date
          column2: timestamp
          max_difference: 10
        rules:
          min_count:
            low:
              min_value: 90.0
            medium:
              min_value: 80.0
            high:
              min_value: 70.0
As you can find on the DQOps documentation site, column_datetime_differnece_percent checks take three parameters. Two of them are column 1 and column 2. Between the time provided in those two columns, the check calculates the time difference. The third parameter is max_difference which sets up a time threshold after which we consider our data to be out of date.
Note that you can also define the time_scale in which you want your data to be shown. By default, time_scale is set to DAY, but you can change it to HOUR, MINUTE, or SECOND.
Running the check
In order to run the check you can just use the check run command and specify the connection and the table:
check run –connection=<connection_name> –table=austin_crime.crime
					Check evaluation summary per table:
+----------+------------------+------+--------------+-------------+------------+---------------+-------------+
|Connection|Table             |Checks|Sensor results|Valid results|Alerts (low)|Alerts (medium)|Alerts (high)|
+----------+------------------+------+--------------+-------------+------------+---------------+-------------+
|test      |austin_crime.crime|1     |1             |0            |0           |0              |1            |
+----------+------------------+------+--------------+-------------+------------+---------------+-------------+
To see the execution details use can specify the run mode equal to debug:
check run –connection=<connection_name> –table=austin_crime.crime –mode=debug
					**************************************************
Executing quality checks on table austin_crime.crime from connection test
**************************************************
**************************************************
Executing a sensor for a check column_datetime_difference_percent on the table austin_crime.crime using a sensor definition table/timeliness/column_datetime_difference_percent
**************************************************
**************************************************
Jinja2 engine has rendered the following template:
table/timeliness/column_datetime_difference_percent/bigquery.sql.jinja2
**************************************************
**************************************************
Executing SQL on connection test (bigquery)
SQL to be executed on the connection:
SELECT
    100.0*SUM(
        CASE
            WHEN
                ABS(DATETIME_DIFF(CAST(analyzed_table.clearance_date AS DATETIME), CAST(analyzed_table.timestamp AS DATETIME), DAY)) < 10 THEN 1
            ELSE 0 END
            )/COUNT(*) AS actual_value, CAST(CURRENT_TIMESTAMP() AS date) AS time_period
FROM `bigquery-public-data`.`austin_crime`.`crime` AS analyzed_table
GROUP BY time_period
ORDER BY time_period
**************************************************
**************************************************
Finished executing a sensor for a check column_datetime_difference_percent on the table austin_crime.crime using a sensor definition table/timeliness/column_datetime_difference_percent, sensor result count: 1
Results returned by the sensor:
+-----------------+-----------+
|actual_value     |time_period|
+-----------------+-----------+
|58.01757017355903|2022-06-23 |
+-----------------+-----------+
**************************************************
**************************************************
Finished executing rules (thresholds) for a check column_datetime_difference_percent on the table austin_crime.crime, verified rules count: 1
Rule evaluation results:
+-----------------+--------------+----------------+-------------+------------+-------------------+---------------+--------+-------------------+------------+----------+------------------+----------------------------------+-----------------+---------------------------------------------------+------------------------+-----------+--------+-------------------+---------+----------------+------------------+---------------+
|actual_value     |expected_value|time_period     |time_gradient|dimension_id|connection_hash    |connection_name|provider|table_hash         |schema_name |table_name|check_hash        |check_name                        |quality_dimension|sensor_name                                        |executed_at             |duration_ms|severity|rule_hash          |rule_name|high_lower_bound|medium_lower_bound|low_lower_bound|
+-----------------+--------------+----------------+-------------+------------+-------------------+---------------+--------+-------------------+------------+----------+------------------+----------------------------------+-----------------+---------------------------------------------------+------------------------+-----------+--------+-------------------+---------+----------------+------------------+---------------+
|58.01757017355903|70.0          |2022-06-23T00:00|day          |0           |7701720396464728665|test           |bigquery|6240082149560342038|austin_crime|crime     |192313333026701629|column_datetime_difference_percent|timeliness       |table/timeliness/column_datetime_difference_percent|2022-06-23T12:07:29.705Z|4371       |3       |4146619101597371801|min_count|70.0            |80.0              |90.0           |
+-----------------+--------------+----------------+-------------+------------+-------------------+---------------+--------+-------------------+------------+----------+------------------+----------------------------------+-----------------+---------------------------------------------------+------------------------+-----------+--------+-------------------+---------+----------------+------------------+---------------+
**************************************************
Check evaluation summary per table:
+----------+------------------+------+--------------+-------------+------------+---------------+-------------+
|Connection|Table             |Checks|Sensor results|Valid results|Alerts (low)|Alerts (medium)|Alerts (high)|
+----------+------------------+------+--------------+-------------+------------+---------------+-------------+
|test      |austin_crime.crime|1     |1             |0            |0           |0              |1            |
+----------+------------------+------+--------------+-------------+------------+---------------+-------------+
Results
As for the date 2022-06-23, the timeliness, according to the definition for this case, the ratio between an absolute value of a DateTime difference between two selected columns and the number of records is lesser than 10 days, Is around 58.02%, resulting in a high severity.
In order to visualize the results on the dashboards, you have to synchronize the data in the first place:
cloud sync data
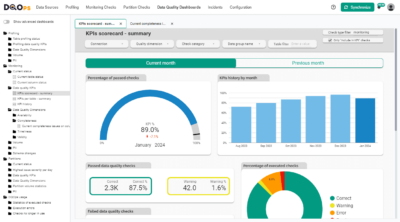
After a while, the synchronized results data should be available on the dashboards. To access them run the following command:
cloud login
Which will open DQOps Cloud in your browser.
Conclusion
Data timeliness is one of the main data quality metrics. It ensures that the data you want to use is up to date or points to data that appeared late.
In this article, we’ve demonstrated how easily you can analyze one of the data timeliness metrics.
For more information, we highly recommend you take a look at the DQOps documentation page and other articles.


