A data quality metric is a measurable value that assesses a specific aspect of data quality, such as its completeness, accuracy, timeliness, or consistency. Some metrics can be measured objectively and automatically, while others are subjective and rely on feedback from data users about their perception of data quality when using the data.
Measuring data quality with metrics allows organizations to understand their data’s health and identify areas for improvement. Numeric metrics provide a reliable way to compare the health of different data sources and data assets. They are also a reliable measure to assess if recent changes to the data platform have impacted data quality.
What is a Metric
In the simplest terms, a metric is a numerical measurement that quantifies a specific characteristic of an object. It provides a way to objectively assess and compare different aspects of the thing being measured. Common examples of metrics in everyday life include length, weight, temperature, and time.
In the realm of data quality, metrics play a crucial role in evaluating the health and trustworthiness of data. They help us determine if the data within a database is accurate, complete, consistent, timely, and relevant to its intended use. Additionally, metrics can also shed light on how easily accessible and usable the data is for those who need it.
Reliable metrics are characterized by their consistency. If you measure the same attribute multiple times under the same conditions, you should expect to get the same result unless the attribute itself has changed. This principle applies equally to data quality metrics. For example, a metric that counts the number of records in a database table will remain constant unless new records are added or existing ones are deleted.
Metrics provide a baseline measurement that serves as a reference point for future assessments. By periodically re-measuring and comparing the results to the baseline, we can track changes over time and identify trends or anomalies that may require attention. This allows us to proactively manage data quality and ensure that the data remains fit for its purpose.
Objective vs Subjective Metrics
There is a wide range of data quality metrics available to assess the health of data and the platforms that store it. These metrics fall into two main categories: objective and subjective.
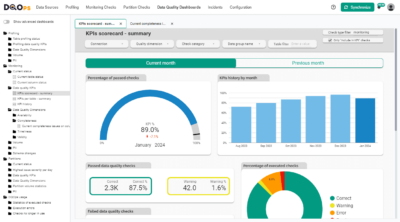
Objective metrics are the most reliable as they directly measure data quality by evaluating its conformance to specific data quality dimensions such as accuracy, consistency, validity, or timeliness. These metrics can be captured automatically using data observability platforms that periodically run data quality checks and track metrics like the Data Quality KPI score or the percentage of records that pass validation. The Data Quality KPI, which measures the percentage of successful data quality checks, is a powerful metric that can be aggregated over time (daily, monthly) to track changes in data health. It’s also useful for comparing the health of different tables within a database.
Subjective metrics, on the other hand, gauge the perceived data quality from the perspective of the users who access and utilize it. They answer questions like, “Do you think the data is fresh?” or “Is the data easy to find and understand?”. These metrics cannot be automated and typically rely on surveys conducted periodically (often annually) among data stakeholders. Due to their reliance on user perception, subjective metrics can be volatile and influenced by factors beyond the actual state of the data. For instance, a user might rate real-time data as outdated if they experienced delays in accessing it, even if the data itself is always up-to-date.
The most popular data quality metrics are described in the infographic below.

Objective Data Quality Metrics
Objective data quality metrics are determined by performing tests on the data. These tests, known as data quality checks, verify whether the data meets specific expectations, such as a minimum number of rows required for the dataset to be usable.
Data quality platforms connect to the data source being analyzed and run these checks, capturing metrics like the percentage of rows containing null values, which is an example of a data completeness metric. Organizations go beyond one-time assessments and use data observability platforms to continuously monitor data sources by running these checks at regular intervals, sometimes as frequently as hourly or daily.
Data quality checks are grouped into categories called data quality dimensions, which focus on detecting similar categories of data quality issues. For example, timeliness measures if the data is up-to-date, uniqueness ensures there are no duplicates, and consistency verifies that the data matches information found elsewhere.
Data quality metrics aggregated at a higher level, such as for an entire table or database, are called data quality KPIs (Key Performance Indicators). Calculating these requires a dedicated database to store metrics collected from all tables and columns over time. These KPIs provide trustworthy measures that can be shared with data owners. Their primary benefit lies in their sensitivity to change – even a slight shift in a data quality KPI can signal a potential data quality issue that needs attention.
Data Quality Dimensions
Objective data quality metrics analyze the health of data within specific data quality dimensions. These dimensions provide a useful framework for communicating data quality metrics and issues to business stakeholders.
The most commonly used data quality dimensions include:
- Data Completeness: Measures if all necessary information is present in the data. For example, a customer database is missing addresses for 20% of the records, which would indicate an issue with completeness.
- Data Consistency: Checks if the data is in agreement with itself and other related data. An example of inconsistency would be if a product’s sales figures in one report don’t match the figures in another report from a different department.
- Data Timeliness: Evaluates if the data is up-to-date and current. If a report shows inventory levels from last week, even though new stock arrived yesterday, it highlights a timeliness problem.
- Data Validity: Assesses if the data adheres to the expected rules, formats, ranges, and types. A phone number field containing text instead of numbers is an example of invalid data.
- Data Uniqueness: Verifies if each piece of data is unique and there are no duplicates. A customer database with multiple entries for the same person with slightly different name spellings demonstrates a lack of uniqueness.
- Data Accuracy: Determines if the data reflects real-world trusted information. For example, if the HR database states a freelancer lives in the UK, but their bank account is in France, the location data is likely inaccurate.
Subjective Data Quality Metrics
Subjective data quality metrics capture how users perceive and experience data quality. They are typically gathered through surveys where data stakeholders provide numerical scores reflecting their experience and trust in the data across various metrics.
These metrics can be broadly categorized into three main groups:
- Ease of Use Metrics: These assess the “discoverability” of data, or how easily users can find the relevant datasets they need.
- Time Metrics: This category focuses on various time-related aspects, such as the speed of accessing data or the time it takes to derive insights from it.
- Relevancy Metrics: These metrics evaluate whether the data is fit for its intended purpose and contains the information that users expect and require.
Easy of Use Metrics
Ease of use metrics measure how quickly and efficiently users can locate and utilize relevant data to gain valuable insights. They focus on the overall user experience and the ease with which data can be discovered, understood, and applied.
Key ease of use metrics include:
- Data Discoverability: Assesses how easily users can find the specific datasets they need within the data platform or system. For example, a user struggling to locate the sales data for a particular region, wasting valuable time navigating through a complex data catalog, indicates poor discoverability.
- Time to Insights: Evaluates the speed at which users can extract meaningful information and insights from the data. If it takes several hours to generate a simple report due to slow query performance or a lack of user-friendly visualization tools, it points to a long time to insights.
- Data Usability: Measures the overall ease with which users can interact with and navigate the data platform or system. A user finding the data platform interface confusing and unintuitive, leading to frustration and decreased productivity, is an example of poor usability.
- Documentation Coverage: Assesses the availability and quality of documentation that explains the data, its structure, and its intended use. A user encountering a dataset with unclear column names and no accompanying data dictionary, hindering their ability to understand and utilize the data effectively, reflects inadequate documentation coverage.
Time Metrics
Time metrics focus on aspects of data quality that can be quantified in units of time, such as seconds, minutes, hours, or even days. These metrics provide insights into the speed and efficiency of various data-related processes and user experiences.
Key time metrics include:
- Data Response Time: Measures how quickly a system or application responds to user requests or queries involving data. For example, if a dashboard takes several minutes to load after a filter is applied, it indicates a slow response time, potentially hindering user productivity and decision-making.
- Data Freshness (Perceived): Evaluates how up-to-date users perceive the data to be, even if the data itself is technically fresh. If users believe the data is outdated due to infrequent updates or delays in accessing it, it impacts their confidence in its relevance, even if the underlying data is current.
- Data Accessibility (Time to Access): Measures the duration it takes for users to gain the necessary access rights and permissions to view or utilize specific data. For instance, if a new employee has to wait two weeks to access essential data for their role, it negatively affects their onboarding and productivity.
Relevancy Metrics
Relevancy metrics gauge how well the data aligns with user needs and expectations, encompassing both its trustworthiness and its suitability for specific purposes.
Key relevancy metrics include:
- Data Trustfulness: Measures the degree to which users believe the data is accurate, reliable, and of high quality. If frequent errors or inconsistencies are discovered in reports, it erodes trust in the data, leading users to question its validity and make decisions based on potentially flawed information.
- Data Ambiguity: Evaluates whether there is confusion or uncertainty arising from multiple datasets containing similar or overlapping information. If users are unsure which dataset to rely on as the “source of truth” due to inconsistencies or a lack of clarity, it creates ambiguity and hampers decision-making.
- Data Relevance: Assesses how well the data meets the specific needs and use cases of its intended audience. If a marketing team receives only sales data but lacks crucial customer demographic information, it limits their ability to create targeted and effective campaigns, indicating a lack of relevance.
Other Notable Metrics
Beyond the metrics discussed previously, organizations should also diligently monitor and assess the security and integrity of their data assets. These types of metrics are particularly crucial for organizations that must adhere to industry-specific data quality regulatory compliance standards.
For instance, the NIS 2 Cybersecurity regulations within the European Union mandate that applications safeguard their systems against cyberattacks. Confirming compliance necessitates monitoring security-related metrics such as login attempts or high-volume outbound data transfers, which could indicate a potential data breach.
These metrics should be actively monitored by security departments and evaluated using specialized tools capable of analyzing log files and detecting suspicious access patterns. This proactive approach to security monitoring ensures the ongoing protection of sensitive data and helps organizations maintain compliance with relevant regulations.
Data quality best practices - a step-by-step guide to improve data quality
- Learn the best practices in starting and scaling data quality
- Learn how to find and manage data quality issues
What is the DQOps Data Quality Operations Center
DQOps is a data observability platform designed to monitor data and assess the data quality trust score with data quality KPIs. DQOps provides extensive support for configuring data quality checks, applying configuration by data quality policies, detecting anomalies, and managing the data quality incident workflow.
DQOps is a platform that combines the functionality of a data quality platform to perform the data quality assessment of data assets. It is also a complete data observability platform that can monitor data and measure data quality metrics at table level to measure its health scores with data quality KPIs.
You can set up DQOps locally or in your on-premises environment to learn how DQOps can monitor data sources and ensure data quality within a data platform. Follow the DQOps documentation, go through the DQOps getting started guide to learn how to set up DQOps locally, and try it.
You may also be interested in our free eBook, “A step-by-step guide to improve data quality.” The eBook documents our proven process for managing data quality issues and ensuring a high level of data quality over time. This is a great resource to learn about data quality.


