Financial Data Analysis
Financial data analysis is the cornerstone of smart decision-making for any business. Companies store vast amounts of financial information in ERP systems, databases, and data lakes. This data is a goldmine for understanding how costs and revenues are distributed across business units, cost centers, and product lines.
Financial data analysis also helps forecast future costs and revenue. The sooner an organization gathers information about transactions, the sooner analysts can prepare forecasts and empower leaders to act decisively.
Furthermore, many industries, particularly banks, must regularly report summarized financial information to regulatory bodies. This data cannot be altered after submission and must be sent on a strict schedule.
In every scenario, collecting complete and accurate financial data is vital. No important transactions should be missed. This data must be collected and verified swiftly after the reporting period ends, but well in advance of deadlines for regulatory submissions or internal financial reports. Ensuring data quality for regulatory compliance is a required step before submission.
Incomplete, late, or error-ridden data (such as invalid cost center codes or transactions referencing non-existent entities) can severely hamper timely financial analysis. These problems, known as data quality issues, must be proactively monitored and addressed through data cleansing.
You can analyze the quality of financial data for free
Before you continue reading, DQOps Data Quality Operations Center is a data quality platform that analyzes data quality. It is strictly designed to detect common data quality issues that affect financial data and supports data reconciliation (data comparison) checks to ensure data accuracy.
Please refer to the DQOps documentation to learn how to start validating data quality for free.
Financial Data Quality Management
In the world of data, a data quality issue is any error that impacts the trustworthiness of information. Data quality, as a core practice within data management, focuses on detecting, monitoring, and resolving these issues.
Data quality issues can be categorized into distinct types, such as completeness or timeliness. These categories, known as data quality dimensions, simplify communication about data problems with data owners and business leaders.
Applying data quality practices to financial data serves several crucial purposes:
- Analyze financial data quality: Gain a clear picture of your financial data’s health.
- Plan corrective actions (data cleansing): Strategize how to fix identified data quality issues.
- Establish continuous monitoring (data observability): Set up a system to detect new data quality problems that could impact financial analysis. When a new issue arises, the system triggers an alert, notifying the data owner. Analysts can then review the issue and decide whether it warrants immediate action.
Data quality analysis for financial data relies on specialized tests called data quality checks, which detect various common issues.
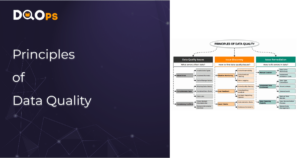
Key Data Quality Dimensions for Financial Data
- Data Completeness: Identifies missing data. Incomplete data can lead to underreporting of figures in financial analysis.
- Data Timeliness: Identifies delayed data that arrives after analysis deadlines. Late data can hinder timely reporting and decision-making.
- Data Uniqueness: Detects duplicate records, such as transactions reported twice. Duplicates can inflate costs or revenues in financial reports.
- Data Validity: Detects values in incorrect formats, such as a wrongly formatted cost center code. Invalid data can lead to inaccurate financial calculations.
- Data Consistency: Detects values that seem unusual compared to historical data. Inconsistent data could indicate errors or anomalies.
- Data Accuracy: Detects discrepancies between your data and a trusted source. For instance, the sum of transactions might not match the total sum of outbound money transfers. Inaccurate data can lead to misleading financial conclusions.
Data quality is assessed using data quality KPIs (Key Performance Indicators), which are metrics that measure how well the data adheres to each dimension and reveal prevailing data quality issues.
How to Measure Data Quality
Data quality is measured by running data quality checks using a data observability platform. These platforms can validate all your checks daily or monthly, depending on how often you analyze financial data and your reporting deadlines. This ensures your data remains free from data quality issues.
There are two main ways to set up data quality checks:
- Python Code: Technical teams, like data engineers who transform and load financial data from ERP systems into data warehouses and lakes, often prefer implementing data quality checks directly in Python code. While this approach offers flexibility, it can limit the involvement of financial experts in reviewing data quality. However, free libraries are available to facilitate this process.
- No-Code Data Quality Platforms: These platforms provide a user-friendly interface that empowers data analysts to configure data quality checks without relying on engineers or developers. This approach allows analysts to verify their expectations about data quality for any data source, fostering greater collaboration and ownership.
The most popular data quality checks and methods of analyzing the quality of financial data are described in an infographic below.
Data Quality Checks
To ensure reliable financial data analysis and identify potential data quality issues, performing specific checks on your data is crucial. Here are some of the most important checks to consider:
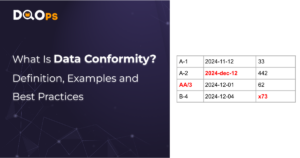
- Validate Text Formats for Numbers and Dates: In financial data, many fields like transaction_amount or invoice_date may be stored as text, even though they represent numbers or dates. This check ensures these values are in the correct format, preventing errors when performing calculations or comparisons. For example, ensuring all dates follow the “YYYY-MM-DD” format allows for accurate sorting and filtering of financial data by time period.
- Check Numbers for Sensible Values: This validation identifies numeric values that are outside a reasonable range. For example, a negative value in the sales_revenue field would be flagged as an anomaly, prompting further investigation. Similarly, a salary value exceeding a predefined threshold might indicate a data entry error.
- Confirm Category Values are Valid: Financial data often includes categorical fields like cost_center or department. This check ensures these fields only contain values from an approved list, maintaining consistency and preventing errors due to typos or inconsistent naming conventions.
- Match Codes to the Right Format: Many financial systems use specific codes for entities like invoices or customers. This check validates these codes against a predefined format, usually using regular expressions. For example, an invoice_number might need to adhere to a specific pattern like “INV-[0-9]{6}”. This ensures consistency and facilitates easy identification and retrieval of financial documents.
- Verify Key Data Types Remain Consistent: The data type of a column (e.g., numeric, date, text) is crucial for accurate analysis. This check monitors important columns to ensure their data type remains unchanged over time. Any unexpected change might indicate an issue in the data pipeline or source system, potentially impacting financial calculations and reporting.
Configuring Data Quality Checks
There are three primary ways to define data quality checks and set their parameters, such as minimum or maximum acceptable values in a price column:
- Manual Configuration by Experts: This approach relies on the expertise of data analysts who understand the data structure and its role in financial analysis. While time-consuming, manual configuration is often essential to establish a high level of data quality, especially for data submitted to regulatory bodies. Analysts can proactively define checks to prevent the recurrence of known data quality issues.
- Data Quality Rule Mining Engine: Many advanced data quality platforms offer a rule mining engine that analyzes your financial data’s structure and proposes suitable data quality checks. This approach streamlines the process, as users only need to confirm or discard suggested checks, reducing manual effort.
- Data Observability Platform: These platforms focus on analyzing data quality and detecting changes like anomalies or values outside normal ranges. They excel when the financial data source is already of good quality, and the goal is to receive notifications when new issues arise that could impact financial analysis.
The choice of configuration method often depends on the organization’s data quality maturity, available resources, and specific requirements for financial data analysis.
Comparing Data to Reference Data
One of the most reliable and important methods for ensuring financial data validity and usability for analysis is comparing it to a trusted source of truth. This process, commonly known as data reconciliation, involves retrieving data from your analyzed source (like transaction lists, invoices, or charges), aggregating the totals, and then comparing those total revenues or costs to the same values stored in another platform.
For example, the detailed fact table listing all transactions used for financial analysis can be compared against an extract of charges for each cost center provided by a financial controller.
Since tables containing financial data are often aggregated and this aggregation process can introduce discrepancies, it’s vital to compare data at different aggregation levels. The table storing summary data for a report (like end-of-month balances for each account) should be compared to the original transaction list by summing all transaction values for each account.
These comparisons should incorporate filters based on reporting periods, allowing you to compare transactions only within daily, monthly, or annual timeframes. To detect discrepancies between datasets that differ in aggregation levels (by cost center, product line, business unit, etc.), the data quality platform must support applying grouping before aggregation and comparison.
The implementation of data quality practices in the organization will require investment and assigning dedicated resources. Not all organizations are ready to assign a budget for data quality activities. You can follow a more structured process to identify a use case for implementing data quality. A strong use case that shows the benefits of implementing data quality can convince business sponsors to prioritize data quality activities.
Data quality best practices - a step-by-step guide to improve data quality
- Learn the best practices in starting and scaling data quality
- Learn how to find and manage data quality issues
What is the DQOps Data Quality Operations Center
DQOps is a data observability platform designed to monitor data and assess the data quality trust score with data quality KPIs. DQOps provides extensive support for configuring data quality checks, applying configuration by data quality policies, detecting anomalies, and managing the data quality incident workflow.
DQOps is designed to allow non-technical users to configure data quality checks manually or by using a rule mining engine that can automatically detect the most common data quality issues. DQOps is also a complete data observability platform that can monitor the quality of data and send notifications when a data quality issue is detected. A dedicated screen supports data reconciliation for comparing data across different data sources. For example, it is possible to compare data in a data lake to reference data in a CSV file that was received from a finance department.
You can set up DQOps locally or in your on-premises environment to learn how DQOps can monitor data sources and ensure data quality within a data platform. Follow the DQOps documentation, go through the DQOps getting started guide to learn how to set up DQOps locally, and try it.
You may also be interested in our free eBook, “A step-by-step guide to improve data quality.” The eBook documents our proven process for managing data quality issues and ensuring a high level of data quality over time. This is a great resource to learn about data quality.