Data observability provides a holistic understanding of your data’s health, enabling proactive identification and resolution of data issues. Think of it as a comprehensive health checkup for all your data assets. Data observability solutions are designed to continuously monitor data health, schema changes, and data anomalies. This means they can detect changes in the structure of your data or the values stored within it, which might indicate a problem that could affect your databases and business operations.
Data observability goes beyond simply monitoring data quality. These tools observe the state of many data stores to provide end-to-end visibility into your data environment. This includes monitoring data pipeline processing logs (records of how data is being processed), cloud events (activities happening in your cloud environment), and cost and usage events (to detect potential budget overruns). When a potential issue is detected, data observability tools send notifications to the appropriate teams, such as data support, data engineering, and data owners, allowing them to review and fix the problem quickly.
You can have a data observability platform for free
Before you continue reading, DQOps Data Quality Operations Center is a data observability platform recognized by Gartner as one of the data observability reference vendors.
Please refer to the DQOps documentation to learn how to download and install it in your environment.
The Scope of Data Observability
Data observability platforms cast a wide net to monitor various aspects of your data ecosystem. To connect to your data sources, they utilize database connectors like JDBC drivers. These connectors allow the platform to synchronize metadata, such as the list of tables and columns, defining the scope of what will be observed. The platform then runs SQL queries to capture key data quality metrics. These metrics can include simple counts of rows in a table or identifying the timestamp of the most recent record to measure data freshness – how up-to-date your information is.
Beyond basic connectivity, data observability platforms often leverage platform-specific APIs (Application Programming Interfaces). This allows them to gather more detailed metadata, including how tables are being used, descriptions of tables and columns, and even the cost of running the data platform itself.
Importantly, data observability extends beyond just the data itself. These platforms also delve into the infrastructure surrounding your data. They access data pipeline processing logs, which provide a record of how data is being processed and transformed. Additionally, they can analyze custom logs created by data engineers to track the results of data quality checks performed within the data pipeline, both before and after data is loaded. By combining these health metrics from tables and processing logs, data observability platforms create a comprehensive view of the current state of your data’s health.
Data Observability and Data Pipeline Integration
Data pipelines are the backbone of any modern data environment. They are responsible for ingesting raw data from various sources, transforming it into a usable format, and then loading it into target systems for analysis or other purposes. Modern data pipelines are typically implemented in code, which allows for greater flexibility and scalability, enabling them to handle massive datasets and perform complex transformations, including real-time data quality validation.
While data observability platforms provide comprehensive monitoring, they operate as standalone systems alongside your data pipelines. This separation is crucial for maintaining independence and objectivity. To bridge this gap, data pipelines can communicate with data observability platforms using client APIs (Application Programming Interfaces). These APIs enable pipelines to interact with the platform, for example, by checking the latest data quality health status of a source before ingesting new data, preventing the propagation of corrupted information. Another common use case is triggering a data quality scan from the pipeline after a new batch of data has been processed and loaded.
This separation between data pipelines and data observability platforms is essential because it allows the observability platform to objectively monitor the performance and reliability of the pipelines themselves. It provides a trustworthy and independent assessment of pipeline events. If the data observability platform were embedded within the pipeline, it wouldn’t be able to detect issues such as a pipeline failing to run for several days due to an error, or a pipeline crashing immediately after starting because of outdated credentials. This independent oversight ensures that your data pipelines are operating as expected and that any issues are quickly identified and addressed.
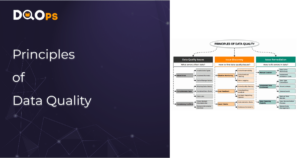
What Issues Data Observability Platforms Detect
Data observability platforms act as vigilant guardians, constantly scanning your data environment for any signs of trouble. Their primary goal is to detect changes in data structure or events that could compromise the reliability of your data. They are designed to uncover a wide range of problems that might otherwise go unnoticed until they impact end-users or even customers. By leveraging AI and advanced algorithms, data observability platforms can identify these issues before they disrupt business operations.
Data Quality Issues
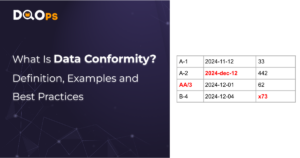
Data observability platforms perform various data quality checks at regular intervals. They can scan an entire dataset on schedule or analyze only new data batches. These checks detect common issues like missing values in required columns or invalid data formats. For example, a tax_id field should contain a valid tax identifier in the correct format.
These platforms utilize internal job schedulers, similar to the CRON scheduler, to automate these checks. You can also configure specific data quality checks by defining data quality policies. These policies specify which checks to run and on which tables or columns. For example, a policy might state that all columns named customer_id in tables starting with fact_ cannot contain null values.
Table Schema Changes
Changes to the structure of tables in upstream systems (data sources), such as adding new columns or changing data types, can disrupt data pipelines. Often, application developers or vendors of external SaaS platforms fail to notify data consumers about these changes, or notifications might be missed.
Data observability tools track table metadata and raise alerts when unexpected changes occur, ensuring your pipelines remain compatible with the latest data structure.
Data Anomalies
The appearance of unusual or unexpected values in your data can signal a change in data collection processes or modifications in upstream data pipelines. Data observability tools collect various metrics about your data sources regularly. They use AI algorithms to detect anomalies over time, such as a sudden increase in row count, unusually high or low values, or unexpected delays in data delivery, which could indicate problems with data loading jobs.
Missing or Outdated Data
Missing data is a common indicator of data reliability issues. Data observability platforms detect two main types of missing data:
- Timeliness Issues: These relate to delays in receiving new data. Data freshness is a key metric here, measured by comparing the timestamp of the most recent record to the current time. For example, if the latest record was created yesterday, the data delay (freshness) is one day.
- Completeness Issues: This involves scanning column values within a dataset to detect missing entries. Completeness problems often arise when a dataset’s schema changes, but the data pipeline’s code is not updated accordingly. This can result in columns that previously contained values now having mostly or only null values.
Data Pipeline Processing Errors
Data engineers often implement custom data quality solutions within data pipelines. Data observability platforms can analyze the logs generated by these solutions to detect problems or count specific errors to trigger alerts when they occur too frequently.
They can also monitor the logs of data orchestration tools like Airflow to identify issues such as job failures or excessive processing times.
Budget Overruns
Cloud-based data platforms offer scalability and flexibility but can also lead to unexpected costs if not managed carefully. Data observability platforms can monitor resource usage and cost metrics to help prevent budget overruns. They can track the cost of running queries, storing data, and utilizing other cloud services, providing alerts when costs approach predefined thresholds.
How Data Quality Issues are Handled
Data observability platforms don’t just detect issues; they also facilitate their resolution. They use various notification mechanisms to alert the appropriate stakeholders, ensuring that the right people are aware of the problem and can take action. This might involve notifying a data support team, a data engineering team, or a data steward, depending on the nature of the issue.
These platforms also track the lifecycle of data quality incidents. Because they continuously monitor data assets, they might detect the same issue multiple times until it’s resolved. To prevent alert fatigue (being overwhelmed by too many notifications), data observability platforms often use clustering techniques. This groups similar alerts into incidents, providing a more manageable and organized view of the problems that need attention. These incidents then become work items assigned to data stakeholders for resolution.
Common notification mechanisms used by data observability platforms include:
- Email: Sending email alerts to designated individuals or teams.
- Messaging Platforms: Sending notifications to collaboration platforms like Slack or Microsoft Teams.
- Webhooks: Triggering actions in other systems via webhooks. This can be used to automatically create tickets in project management tools like Jira or ServiceNow, streamlining the incident management process.
By providing timely notifications and efficient incident management capabilities, data observability platforms help organizations resolve data issues quickly, minimizing their impact on business operations and ensuring data remains reliable and trustworthy.
Data Lineage
Achieving end-to-end data observability requires understanding the impact radius of a data quality issue. This means identifying all downstream tables, datasets, and other data assets that could be affected by corrupted data flowing through the system. Knowing this impact radius allows data operations teams to take proactive steps, such as stopping downstream data pipelines, to prevent further propagation of bad data and avoid the need for extensive data cleansing later on.
Data lineage plays a crucial role in this process. It provides the linkage between data sources (upstream datasets) and target tables (downstream data assets). It essentially maps the journey of data as it flows through your systems. Because data observability tools need access to the most up-to-date lineage information to assess the impact of an incident, they often maintain their own data lineage repositories. These repositories are kept current by replicating lineage metadata from data catalogs or dedicated data lineage tracking platforms.
Data lineage is also invaluable for root cause analysis. For example, if data is missing in a fact table in your data warehouse, and the corresponding table in the operational database (OLTP system) used by the source application is also outdated, it suggests the issue originates with the application itself, not the data pipelines. This helps pinpoint the source of the problem and direct troubleshooting efforts effectively.
By understanding the flow of data and its dependencies, data observability platforms, empowered by data lineage, provide a comprehensive view of your data environment, enabling faster incident resolution and more effective data quality management.
Data quality best practices - a step-by-step guide to improve data quality
- Learn the best practices in starting and scaling data quality
- Learn how to find and manage data quality issues
What is the DQOps Data Quality Operations Center
DQOps is a data observability platform designed to monitor data and assess the data quality trust score with data quality KPIs. DQOps provides extensive support for configuring data quality checks, applying configuration by data quality policies, detecting anomalies, and managing the data quality incident workflow.
DQOps is a platform that combines the functionality of a data quality platform to perform the data quality assessment of data assets. It is also a complete data observability platform that can monitor data and measure data quality metrics at table level to measure its health scores with data quality KPIs.
You can set up DQOps locally or in your on-premises environment to learn how DQOps can monitor data sources and ensure data quality within a data platform. Follow the DQOps documentation, go through the DQOps getting started guide to learn how to set up DQOps locally, and try it.
You may also be interested in our free eBook, “A step-by-step guide to improve data quality.” The eBook documents our proven process for managing data quality issues and ensuring a high level of data quality over time. This is a great resource to learn about data quality.