Why tables should be prioritized
Data quality initiatives can be quite extensive, involving everything from implementing data governance practices to cleansing data and fixing identified issues. These projects often require substantial time and resources, which can strain budgets.
A more manageable approach is to adopt an agile methodology for your data quality project. The data team creates a backlog of potential data quality issues and tables to analyze. Then, they work through these items in iterations, focusing on one or a few tables at a time. This approach allows for thorough data profiling, issue identification, and targeted cleansing. It also helps the team gain valuable domain knowledge and understand the business context surrounding the data. However, to maximize efficiency and deliver the most business value, it’s crucial to prioritize tables based on their estimated business value and criticality. This ensures that the most critical data quality issues are addressed first.
This article outlines a practical approach to prioritizing tables, proven effective in numerous data quality projects. It’s a valuable resource for any data team looking to improve data quality in an efficient and impactful way.
Table of Contents
Table priority levels
To effectively prioritize tables, we need a clear framework for categorizing them based on their impact on the business. We propose a four-tiered system of priority levels:
Critical Priority: These are the mission-critical tables where data errors can have severe consequences, such as regulatory non-compliance, financial loss, or major operational disruptions. These tables require the highest level of attention and data quality assurance.
High Priority: These tables are essential for key business processes and decision-making. Maintaining high data quality in these tables is crucial for operational efficiency and informed decision-making.
Normal Priority: These tables contribute to the overall data integrity and operational efficiency of the organization. While not as critical as the high-priority tables, data quality issues here can still lead to inconveniences or minor disruptions.
Low Priority: These tables contain less critical or infrequently used data. While data quality is still important, issues in these tables have a minimal impact on business operations or decision-making. These tables can be addressed after higher-priority tables have been handled.
This prioritization framework allows for a focused and strategic approach to data quality initiatives. By addressing the most critical tables first, you can mitigate the most significant risks and ensure the integrity of your most valuable data assets. Remember, the specific priority levels assigned to tables may vary depending on your organization’s unique needs and data landscape, so it’s crucial to conduct a thorough assessment to tailor this framework to your specific context.
Critical Priority Tables
In the world of data management, some tables are more important than others because they directly affect things like following the rules, keeping finances in order, and making sure the business runs smoothly. It’s really important to make sure the data in these tables is correct. Let’s look at three types of these really important tables:
Tables with a List of Transactions Requiring Regulatory Compliance
Think of these tables as the financial and legal records of your organization. They include things like invoices, purchase orders, and tax documents that need to be accurate so you can pass audits and follow the rules. Even small mistakes can cause problems like fines or legal action, which can hurt your company’s reputation and its money.
It’s super important to have strong data quality checks in these tables. These checks protect your organization from breaking the rules, make sure your financial reports are correct, and give everyone confidence in your company.
Primary Dictionary Tables
These tables might not seem exciting, but they’re really important for your data. They define the basic terms your business uses – things like product types, customer groups, and locations. Many other tables use these definitions, so they’re key to making sure your data is consistent and correct.
If there are mistakes in these primary dictionary tables, it can cause problems all over your data. People might misunderstand things, make wrong analyses, and make bad decisions.
Reference Tables (Client or Product Lists)
These tables hold the main data that your business uses to operate. Client lists, product catalogs, supplier lists – these are the things you use to interact with the outside world.
Imagine sending an invoice to the wrong address or advertising a product you don’t sell anymore. These kinds of mistakes, which come from incorrect reference data, can hurt your relationships with customers, mess up your supply chain, and make people trust your organization less.
Keeping the data in these reference tables clean and correct is really important for things to run smoothly, communicate effectively, and build trust with the people you work with.
Basically, these critical priority tables are the foundation of your data-driven business. Making sure the data in them is good isn’t just a good idea; it’s necessary to follow the rules, stay financially healthy, and keep your organization’s good reputation.
High Priority Tables
Once the most critical tables have been fortified with robust data quality checks, the focus shifts to the high priority tables. These tables, while not directly tied to compliance or financial reporting, are indispensable for smooth business operations, informed decision-making, and overall efficiency.
Non-Critical Transaction Tables (e.g., Shipments)
These tables chronicle the day-to-day activities that keep your business running. They track crucial events like shipments, orders, and customer interactions. While not subject to the same regulatory scrutiny as financial transactions, these tables are vital for understanding your operational performance, identifying bottlenecks, and optimizing processes.
Inaccurate or incomplete data in these tables can lead to missed deliveries, delayed orders, and dissatisfied customers. Prioritizing their data quality ensures that your business operates like a well-oiled machine.
Data Vault: Hub and Link Tables
For organizations employing the Data Vault modeling approach, hub and link tables form the core of their data architecture. Hub tables capture the essence of business entities, while link tables establish relationships between them. Think of them as the nouns and verbs of your data language.
Ensuring data quality within these tables is paramount for maintaining the integrity of your entire Data Vault. Any inconsistencies or errors here can propagate throughout the system, leading to a domino effect of inaccurate insights and flawed analyses.
Cleansed Tables
These tables represent a unique category within the high priority group. They have been specifically identified for advanced cleansing and improvement prior to the full-scale data quality project. These tables might have been flagged during initial assessments as having significant data quality issues or playing a crucial role in downstream processes.
By prioritizing these cleansed tables in the second stage, you ensure that they are brought up to a higher standard of data quality, paving the way for a smoother and more effective overall data quality initiative. They also serve as a testament to your commitment to continuous improvement and data-driven decision-making.
In conclusion, high priority tables are the engines that drive your business operations and decision-making. By ensuring their data quality, you optimize efficiency, minimize risks, and empower your organization to make informed choices based on reliable information.
Normal Priority tables
With the critical and high-priority tables addressed, we move on to the normal priority tier. These tables play a supportive role in your data ecosystem, often serving as intermediaries or providing refined views of your data. While not as immediately critical as the previous categories, maintaining their data quality is crucial for accurate reporting, insightful analysis, and efficient data processing.
Landing Zone Tables
These tables act as the first stop for incoming raw data, often residing in the bronze layer of a data lake or data warehouse. They serve as a staging area where data is initially captured before undergoing further transformation and cleansing. While errors in these tables can impact downstream processes, they are often easier to rectify as they typically don’t require changes in source systems like CRM or ERP.
Prioritizing data quality checks in landing zone tables helps identify and correct issues early in the data pipeline, ensuring a clean and reliable foundation for subsequent data transformations.
Derived Tables (Fact and Dimension Tables)
These tables, commonly found in data marts or data warehouses, provide structured and summarized views of your data. They are the building blocks for reports, dashboards, and other analytical outputs. Fact tables store quantitative measurements, while dimension tables provide context and descriptive attributes.
Maintaining data quality within derived tables is crucial for accurate reporting and meaningful insights. Errors here can lead to misleading visualizations, flawed conclusions, and ultimately, poor decision-making.
Data Vault: Satellite Tables
In the Data Vault model, satellite tables capture additional attributes and context about hub entities. They provide a flexible and adaptable way to store evolving data elements without impacting the core hub and link tables.
While not as critical as the foundational hub and link tables, satellite tables still contribute to the richness and depth of your data. Ensuring their data quality helps preserve the integrity of your Data Vault and supports comprehensive analysis.
Tables Used in Dashboards
Any table that feeds into a dashboard or report falls under this category. These tables have undergone transformation and cleansing and are expected to be of high quality. However, data quality issues can still arise due to incorrect transformations or calculations.
Prioritizing these tables ensures that your dashboards and reports present accurate and reliable information, enabling confident decision-making based on trustworthy data.
Low Priority Tables
The final tier in our prioritization framework comprises the low-priority tables. These tables, while still valuable, contain data that is less critical or less frequently used for immediate business operations or decision-making. Maintaining their data quality is important, but they can be addressed after higher-priority tables have been handled.
Event Stream/Clickstream Tables
These tables capture a wealth of information about user interactions with websites, applications, or digital platforms. They track clicks, page views, and other user behaviors, offering valuable insights for analytics and marketing optimization.
However, the priority level of these tables can vary. If they are used in real-time to drive crucial business processes, such as optimizing marketing campaigns or personalizing user experiences, they may warrant a higher priority. But if they are primarily collected for future analysis by data scientists or for long-term trend tracking, they can be safely categorized as low priority.
Log Tables
Log tables serve as the system’s diary, recording events and activities within your applications or infrastructure. They are indispensable for troubleshooting, identifying errors, and monitoring system performance.
While log data can be invaluable for technical teams, it rarely directly impacts business operations or decision-making. Thus, log tables are generally considered low priority from a data quality perspective.
Secondary Dictionary Tables
These tables provide supplementary reference data that enriches your data ecosystem but is not as foundational as primary dictionary tables. They might include less frequently used codes, classifications, or lookup values.
While ensuring accuracy in secondary dictionary tables is still important, errors here are less likely to cause widespread disruptions or misinterpretations compared to errors in primary dictionary tables.
In conclusion, low priority tables encompass data that is supportive, archival, or less frequently used for immediate business needs. While their data quality should not be neglected, they can be addressed strategically after higher-priority tables have been thoroughly vetted and improved.
Managing Table Backlog
To seamlessly integrate table prioritization with an agile data quality project, it’s essential to structure your workload effectively. We recommend breaking down the assessment and cleansing tasks for each table into individual features and adding them to your project’s backlog.
Most task management platforms like Jira or Azure DevOps offer the functionality to assign priorities to tasks. Utilize this feature to map the table priority levels (critical, high, normal, low) to corresponding numeric priority levels in your chosen platform. For instance:
- 1 – Critical
- 2 – High
- 3 – Normal
- 4 – Low
This direct mapping ensures that your team focuses on the most impactful tables first, aligning with the strategic prioritization framework.
It’s important to note that you don’t need to meticulously define tasks for every single table from the outset. Start with a simple yet effective approach:
- Create an Excel file listing all the tables relevant to your data quality initiative.
- For each table, assign a priority level (critical, high, normal, low) based on the criteria we’ve discussed.
- Ensure a balanced distribution of priorities within your backlog, reflecting the relative importance of different table types within your data landscape.
This streamlined approach provides a clear starting point for your data quality journey, allowing your team to progressively refine and expand the backlog as they gain deeper insights into your data ecosystem.
Remember, agility is key. Regularly review and adjust your backlog based on evolving business needs, new data sources, or emerging data quality challenges. By embracing this adaptable approach, you can ensure that your data quality efforts remain aligned with your organization’s strategic objectives and deliver maximum value.
Tracking Data Quality Project Progress
As your data quality project unfolds, your team will implement numerous data quality checks on tables and columns. These checks actively monitor your data, flagging any invalid entries like duplicates or incorrectly formatted values. This ongoing vigilance is crucial for maintaining data integrity and ensuring the accuracy of your insights.
To measure the progress and effectiveness of your data quality project, it’s important to track several key metrics:
- Tables and Columns with Configured Data Quality Checks (within the current iteration/sprint): This metric provides a snapshot of your team’s progress in implementing data quality checks. It helps gauge the scope of your efforts and identify any potential bottlenecks in the process.
- Data Quality Issues Detected (during the current iteration/sprint): This metric reveals the actual impact of your data quality checks. By quantifying the number of issues detected, it helps prioritize follow-up cleansing tasks and provides tangible evidence of the project’s effectiveness.
While these metrics are valuable for the data team’s internal planning and execution, they might not resonate with business sponsors who are more interested in the overarching benefits of improved data quality.
To bridge this communication gap, it’s crucial to employ data quality KPIs (Key Performance Indicators) that measure the overall health of your data. These KPIs can be calculated at the table level or aggregated for groups of tables based on their priority levels.
One effective way to implement data quality KPIs is by leveraging platforms like DQOps, a data quality and observability solution. DQOps offers a complimentary data quality data warehouse and a suite of dashboards that facilitate the calculation and visualization of data quality KPIs. You can leverage the table priority levels to group similar tables and gain insights into the overall data quality health of each priority group.
By presenting these data quality KPIs to business sponsors, you can effectively communicate the tangible value and positive impact of your data quality initiatives. This helps secure continued support and resources for your project, ensuring that data quality remains a top priority within your organization.
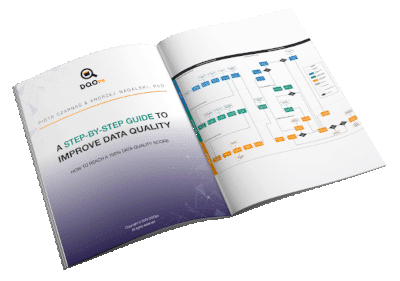
Data quality best practices - a step-by-step guide to improve data quality
- Learn the best practices in starting and scaling data quality
- Learn how to find and manage data quality issues
What is the DQOps Data Quality Operations Center
DQOps is a data quality platform designed to monitor data and assess the data quality trust score with data quality KPIs. DQOps provides extensive support for configuring data quality checks, applying configuration by data quality policies, detecting anomalies, and managing the data quality incident workflow.
DQOps has built-in support for grouping tables into priority levels. An integrated data quality data warehouse uses the table’s priority as one of the grouping dimensions used on 50+ data quality dashboards. DQOps also provides dedicated dashboards for tracking the progress of table cleansing, sorting tables by their priority, and the data quality health score, allowing the data teams to focus on the tables that still require improvement.
You can set up DQOps locally or in your on-premises environment to learn how DQOps can monitor data sources and ensure data quality within a data platform. Follow the DQOps documentation, go through the DQOps getting started guide to learn how to set up DQOps locally, and try it.
You may also be interested in our free eBook, “A step-by-step guide to improve data quality.” The eBook documents our proven process for managing data quality issues and ensuring a high level of data quality over time.