Open source data quality tools are a fantastic way to kickstart your data quality journey. These tools provide a cost-effective solution for teams to identify and address data quality issues without the upfront investment of commercial products. This is crucial because many organizations find themselves in a catch-22: business sponsors often require proof of data quality problems before approving budget for a tool, but demonstrating those problems usually necessitates a tool in the first place.
Open source tools break this cycle, empowering data teams to proactively profile their data, uncover hidden issues, and build a compelling case for data quality investment. But choosing the right tool requires careful consideration. It’s essential to involve a diverse group of stakeholders in the selection process, including data engineers, analysts, stewards, and scientists. This collaborative approach ensures the chosen tool meets the needs of everyone involved, from those building data pipelines to those performing ad-hoc analysis.
Modern data quality strategies emphasize a “shift-left” approach, integrating data quality checks early in the data lifecycle. Open source data quality tools are invaluable for implementing this, enabling teams to validate data before it even lands in their data warehouse. However, their utility extends far beyond the initial ingestion stage. Analysts, stewards, and scientists can leverage these tools to profile datasets, validate hypotheses, and ensure they’re working with reliable, high-quality information.
Table of Contents
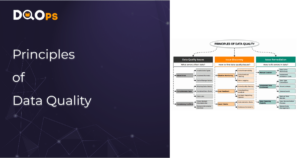
What is Data Quality
Data quality has two meanings. First, it is a measure of how good and usable data is for its intended purpose. For example, high-quality customer data would contain all the necessary contact information for a marketing campaign. Second, data quality refers to the practice of ensuring that data is healthy and usable.
Data becomes unusable when it lacks required values, is polluted with too many outliers, or is in the wrong format. Unhealthy data requires extra effort to clean and improve its quality to a usable level.
Here are some of the most common data quality problems that open source data quality tools can help you find:
- Missing data: Find columns that contain any or too many missing values. For example, a column used as a business key should always be provided.
- Duplicate values: Columns that should contain unique values may have duplicates. Duplicate values can corrupt the results of SQL queries that perform joins and aggregations on these columns.
- Values out of range: Many columns have a reasonable range of valid values, such as a “price” column in an e-commerce database for a store that sells products priced between $5-$500. A product worth -$5 or $5000 must be a mistake.
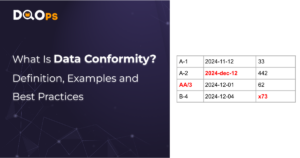
- Values in a wrong format: Data ingestion often uses flat files as a data source. It is easy to make a mistake when a date column value that should be sent as “2024-12-02” is formatted as “December 2nd, 2024” because the data publishing code was recently updated and uses the local localization settings of the server.
- Unknown categorical values: Many columns are expected to store only values from a list of approved and agreed-upon values, such as status codes. A data quality tool can verify that a “status” column contains only the values “open,” “closed,” and “rejected”.
These are just a few examples of common data quality issues. Open-source data quality tools provide a variety of checks to help you identify and address these problems, ensuring your data is accurate, consistent, and reliable.
Who Needs a Data Quality Tool
Data quality is everyone’s responsibility, but different teams interact with data in unique ways and have distinct needs when it comes to data quality tools. While data engineers might focus on preventing bad data from entering the system, data analysts and scientists are more concerned with understanding the nuances of existing data. Let’s break down the specific needs of various roles:
- Data Engineers: They build data pipelines and need tools to define and automate data quality checks within those pipelines. They prefer code-based configurations for version control and easy integration.
- Data Analysts: They explore datasets to uncover insights. They need a tool that provides a clear overview of data quality and allows them to define custom checks, ideally with a user-friendly interface and no-code options.
- BI Developers: They create dashboards and reports. They need a tool that allows them to quickly investigate data quality issues reported by users, with intuitive visualizations and easy-to-use exploration features.
- Data Scientists: They build machine learning models and need tools to deeply analyze and profile data, identify anomalies, and handle diverse data sources.
- Data Operations and DevOps Teams: They respond to data quality issues in production systems and need a tool with real-time monitoring, alerts, and incident management capabilities.
By understanding the needs of each role, organizations can choose an open source data quality tool that empowers everyone to contribute to maintaining high data quality.
How to Choose an Open Source Data Quality Tool
With a clear understanding of your team’s needs, you can evaluate open source data quality tools based on these essential features:
- Data Pipeline Integration: The tool should seamlessly integrate into your data pipelines, allowing you to embed data quality checks and store configurations in version-controlled files.
- Comprehensive Checks: It should support a wide array of data quality checks, covering common issues like missing values, duplicates, and outliers, as well as more specialized checks like detecting future dates or invalid categorical values.
- Broad Connectivity: The tool should connect to various data sources, including databases, data lakes, and different file formats, enabling end-to-end data quality monitoring across your entire data landscape.
- Efficient Rule Generation: Creating data quality rules can be time-consuming. Look for tools that streamline this process with features like automated rule suggestions or reusable templates.
- Data Observability: Modern data quality tools should support continuous data monitoring beyond just pipeline checks. This includes detecting anomalies, tracking data drift, and providing alerts on unexpected changes.
- User-Friendly Interface: A user-friendly interface with no-code options empowers non-technical users, such as data analysts, to participate in data quality initiatives.
- Incident Management: For production systems, the tool should provide robust incident management capabilities, including real-time alerts, notifications, and workflow automation to quickly address data quality issues.
- Reporting and Visualization: To gain buy-in for data quality initiatives, the tool should offer reporting and visualization features that clearly communicate the state of data quality and the impact of data quality issues.
Great Expectations
Great Expectations (GX) is a popular open-source Python library for data quality validation. It allows you to define “expectations” – essentially assertions about your data – and validate your data against those expectations. While GX has gained popularity for its code-centric approach and flexibility, it has certain limitations, especially when compared to more comprehensive data quality platforms.
Here’s a critical evaluation of Great Expectations based on the key features we’ve outlined:
Data Pipeline Integration
GX performs well in this aspect, allowing you to define expectations as code and integrate them into your data pipelines. However, this code-centric approach can be challenging for non-technical users, potentially limiting broader adoption within an organization.
Comprehensive Checks
GX offers a wide range of built-in expectations. However, it’s important to be aware that GX has two categories of checks: those that are pushed down to SQL databases and those that require loading the entire dataset into memory using Pandas. This limitation can make certain checks impractical for large datasets, hindering scalability.
					validator.expect_column_values_to_not_be_null("pickup_datetime")
validator.expect_column_values_to_be_between(
    "passenger_count", min_value=1, max_value=6
)
validator.save_expectation_suite(discard_failed_expectations=False)
Example of data quality checks configured in Great Expectations.
Broad Connectivity
GX supports common data sources like CSV files and SQL databases, but its limited selection of connectors may not be sufficient for organizations with diverse data ecosystems. This can create gaps in data quality coverage across the entire data landscape.
Efficient Rule Generation
GX offers profilers and data assistants to help generate expectations. However, the profiler lacks a user interface and generates configuration files that require manual merging, making it less user-friendly, especially for incremental profiling and collaboration among team members.
Data Observability
The open-source version of GX does not support true data observability. Observability requires tracking data quality metrics over time and detecting anomalies, which necessitates a database to store historical data. This functionality is not available in the open-source version, limiting its ability to proactively identify and address data quality issues.
User-Friendly Interface
The GX UI, which provides a more visual approach to data quality, is a paid feature available only in the GX Cloud version. The open-source version is limited to a local command-line tool with basic HTML reporting, which may not be suitable for all users, particularly those who prefer a no-code approach.
Incident Management
The open-source version of GX lacks any incident management capabilities. It simply logs detected data quality violations, leaving it to users to manually monitor and address these issues. This can be time-consuming and inefficient, especially for organizations with complex data pipelines and frequent data updates.
Reporting and Visualization
GX generates static HTML reports for data quality. These reports, while informative, lack interactive features like drill-downs or filtering, and cannot be exported to formats like PDF. This limits their usefulness for sharing with business stakeholders and generating comprehensive data quality reports.
Conclusion
While Great Expectations provides a solid foundation for code-centric data quality validation, its limitations in connectivity, user-friendliness, data observability, and incident management become apparent when compared to more extensive data quality platforms. For organizations with diverse data sources, non-technical users, or a need for advanced monitoring and incident management, GX might not fully address all data quality requirements.
Soda Core
Soda Core is an open-source command-line tool and Python library for data quality testing. It allows you to define data quality checks using a YAML-based language called SodaCL and scan your data sources for violations. While Soda Core offers a good starting point for data quality efforts, it has limitations, particularly when compared to more comprehensive data quality platforms.
Here’s a critical evaluation of Soda Core based on the key features we’ve outlined:
Data Pipeline Integration
Soda Core integrates well with data pipelines, allowing you to define checks in YAML files and execute them using the command-line interface. However, these YAML files lack schema validation and code completion in popular text editors, making them prone to errors during manual editing.
Comprehensive Checks
Soda Core supports a decent range of data quality checks, covering common issues like missing values, duplicates, and schema validation. However, advanced checks, such as anomaly detection, are reserved for the paid Soda Cloud offering, limiting the open-source version’s capabilities for proactive data quality monitoring.
					checks for stocks:
  - row_count > 0:
      attributes:
        pipeline_stage: Pre-ingestion
        data_quality_dimension:
          - Completeness
        data_domain: Product
        weight: 3
  - values in (store_id) must exist in stores (store_id):
      attributes:
        pipeline_stage: Pre-ingestion
        data_quality_dimension:
          - Consistency
        data_domain: Product
        weight: 2
Example of data quality checks configured in Soda Core.
Broad Connectivity
Soda Core supports around 20 data sources, which is an improvement over Great Expectations. However, this might still be insufficient for organizations with highly diverse data environments.
Efficient Rule Generation
Soda Core offers a command-line profiler to help generate data quality rules. However, the output requires manual integration into existing checks, and while filters can be used to apply checks across multiple tables, this process can still be cumbersome for large datasets or complex rule sets.
Data Observability
Soda Core does not support true data observability in its open-source version. It lacks the ability to track historical data quality metrics and detect anomalies over time. While anomaly detection is reportedly under development, its scope and capabilities remain unclear.
User-Friendly Interface
Soda Core is primarily a command-line tool. While a simple user interface is available in the paid Soda Cloud version, the open-source version lacks any visual tools for defining or managing data quality checks, potentially hindering adoption by less technical users.
Incident Management
Soda Core offers basic error reporting through return codes when executed in a data pipeline. However, it lacks dedicated incident management features like alerts, notifications, or workflow automation. This leaves the burden of building custom incident management solutions on the data engineering team.
Reporting and Visualization
The open-source version of Soda Core has no reporting capabilities. Reporting features are exclusive to the paid version, and even then, they lack customization options, limiting their flexibility and usefulness for comprehensive data quality analysis and communication.
Conclusion
Soda Core provides a decent foundation for basic data quality testing with its command-line interface and YAML-based checks. However, its limitations in rule generation, data observability, user interface, incident management, and reporting become apparent when compared to more comprehensive data quality platforms. For organizations seeking advanced features, broader connectivity, a user-friendly experience, and proactive data quality monitoring, Soda Core might not be the ideal solution.
Deequ
Deequ is an open-source Scala library built specifically for data quality testing on Apache Spark. It allows you to define data quality constraints and metrics using Scala code and evaluate them against your Spark DataFrames. While Deequ offers some valuable features for Spark users, its narrow focus and lack of certain functionalities limit its broader appeal and applicability.
Here’s a critical evaluation of Deequ based on the key features we’ve outlined:
Data Pipeline Integration
As a Spark-native library, Deequ integrates seamlessly into Spark workflows. However, its code-based interface, exclusively using Scala or Python with Spark sessions, can be a barrier for non-programmers and those unfamiliar with Spark.
Comprehensive Checks
Deequ provides a reasonable selection of built-in checks for common data quality issues like completeness, uniqueness, and data type validation. However, it lacks more advanced checks and functionalities, such as time-series anomaly detection or custom SQL-based validations, which are often found in more comprehensive data quality platforms.
					    val verificationResult = VerificationSuite()
      .onData(data)
      .addCheck(
        Check(CheckLevel.Error, "integrity checks")
          // we expect 5 records
          .hasSize(_ == 5)
          // 'id' should never be NULL
          .isComplete("id")
          // 'id' should not contain duplicates
          .isUnique("id")
          // 'productName' should never be NULL
          .isComplete("productName")
          // 'priority' should only contain the values "high" and "low"
          .isContainedIn("priority", Array("high", "low"))
          // 'numViews' should not contain negative values
          .isNonNegative("numViews"))
      .addCheck(
        Check(CheckLevel.Warning, "distribution checks")
          // at least half of the 'description's should contain a url
          .containsURL("description", _ >= 0.5)
          // half of the items should have less than 10 'numViews'
          .hasApproxQuantile("numViews", 0.5, _ <= 10))
      .run()
Example of data quality checks configured in Deequ.
Broad Connectivity
Deequ’s connectivity is limited exclusively to Apache Spark. While this allows for analyzing various data formats accessible through Spark, it lacks direct integration with other data sources like databases or cloud storage services. This narrow focus restricts its use in diverse data environments.
Efficient Rule Generation
Deequ offers basic rule generation capabilities through its analyzers and constraint suggestion features. However, this process requires writing code in Scala or Python, which can be cumbersome and less efficient compared to tools with visual rule builders or more automated approaches.
Data Observability
Deequ offers a basic form of data observability through its metrics repository, which can store historical data quality metrics and detect certain types of anomalies. However, its observability features are limited compared to platforms that provide comprehensive data lineage, anomaly detection, and alerting capabilities
User-Friendly Interface
Deequ lacks any form of user interface. Its reliance on code-based configuration and interaction can be a significant hurdle for non-technical users and may limit broader adoption within an organization.
Incident Management
Deequ does not provide any incident management features. It simply evaluates data quality checks and provides results, leaving it to users to build custom solutions for monitoring, alerting, and managing data quality incidents.
Reporting and Visualization
Deequ offers very limited reporting capabilities. Users can retrieve historical metrics from the metrics repository using code, but there are no built-in visualization or reporting features. This makes it difficult to communicate data quality insights effectively and hinders collaboration with stakeholders.
Conclusion
Deequ is a useful tool for Spark users who require code-based data quality testing within their Spark workflows. However, its limitations in connectivity, user interface, rule generation, incident management, and reporting restrict its broader applicability. Organizations with diverse data sources, non-technical users, or a need for advanced data quality monitoring and management features may find Deequ insufficient for their needs.
DataHub
DataHub, an open-source data catalog and data governance platform developed by Acryl Data and LinkedIn, offers a unique approach to data quality. While not strictly a dedicated data quality tool like Great Expectations or Soda Core, DataHub incorporates data quality features within its broader functionality, focusing primarily on metadata health and observability.
Here’s an evaluation of DataHub’s data quality capabilities:
Data Pipeline Integration
DataHub offers a comprehensive client library for integrating with data pipelines. However, its data model can be complex for configuring basic settings, making the user interface a more practical option for many users.
Comprehensive Checks
DataHub’s data quality checks are limited to custom SQL-based assertions. This allows for flexibility but lacks the breadth of pre-built checks offered by dedicated data quality tools. Notably, DataHub emphasizes metadata health checks, identifying issues like undocumented or unused datasets, but these are primarily available in the paid Cloud version.

Broad Connectivity
DataHub boasts a wide array of connectors, integrating with various data sources, data lineage tools, and BI platforms. This extensive connectivity is a significant advantage, enabling a holistic view of data quality across the data landscape.
Efficient Rule Generation
DataHub does not provide specific features for generating data quality rules, primarily due to its focus on custom SQL checks and metadata health.
Data Observability
DataHub incorporates data observability features, tracking metadata changes and providing insights into data usage patterns. It can even manage incidents detected by its observability module. However, advanced features like subscriptions and notifications are reserved for the paid Cloud version.
User-Friendly Interface
DataHub offers a user-friendly interface primarily focused on metadata management, search, and discovery. While the interface facilitates data discovery and understanding data context, defining data quality checks still requires writing SQL code.
Incident Management
DataHub includes robust incident management workflows, encompassing metadata change approvals and incident handling for its observability module. However, accessing the full potential of these features, including subscriptions and notifications, requires upgrading to the paid cloud version.
Reporting and Visualization
As a data catalog, DataHub’s reporting focuses on metadata exploration and presenting data quality information within the context of discovered data assets. It lacks dedicated data quality reporting features with visualizations or customizable dashboards.
Conclusion
DataHub offers a unique perspective on data quality by integrating it with data cataloging and governance functionalities.
Its strengths lie in broad connectivity, data observability features, and incident management capabilities. However, its limitations in comprehensive checks, rule generation, and reporting might not fully satisfy organizations seeking a dedicated data quality solution. DataHub is a valuable tool for organizations prioritizing metadata management and data discovery, with data quality features as a supplementary benefit.
Dbt Tests
dbt is a popular open-source data transformation tool that has become a staple in modern data stacks. While not primarily a data quality platform, dbt includes basic data quality testing features that are often the first line of defense for data teams. However, it’s crucial to understand the limitations of these features, as they may not be sufficient for comprehensive data quality management.
Here’s an evaluation of dbt’s data quality capabilities:
Data Pipeline Integration
dbt’s greatest strength in the context of data quality is its seamless integration with data pipelines. Since dbt manages data transformations and dependencies, it can easily incorporate data quality checks within the transformation workflow.
Comprehensive Checks
dbt offers a very limited set of built-in data quality checks, essentially mirroring common SQL constraints like not_null, unique, accepted_values, and relationships. This limited scope restricts its ability to address a broader range of data quality issues.
					version: 2

models:
  - name: orders
    columns:
      - name: order_id
        tests:
          - unique
          - not_null
      - name: status
        tests:
          - accepted_values:
              values: ['placed', 'shipped', 'completed', 'returned']
      - name: customer_id
        tests:
          - relationships:
              to: ref('customers')
              field: id
All data quality checks supported in dbt Tests shown in one example.
Broad Connectivity
The open-source version of dbt supports a wide range of popular data sources, making it compatible with diverse data environments. This broad connectivity is a significant advantage for organizations using dbt for data transformation.
Efficient Rule Generation
dbt does not offer any data profiling or rule generation capabilities. Users must manually define data quality checks using SQL, which can be time-consuming and inefficient, especially for large datasets or complex rules.
Data Observability
The open-source version of dbt lacks data observability features. While the paid dbt Cloud version tracks transformation errors, it does not monitor data anomalies or provide comprehensive data quality monitoring over time.
User-Friendly Interface
dbt operates primarily through configuration files and lacks a visual user interface in its open-source version. This can create a barrier for less technical users who prefer a no-code approach to data quality management.
Incident Management
dbt does not include incident management features in its open-source version. Users must rely on external tools or custom solutions to manage data quality incidents and alerts.
Reporting and Visualization
dbt’s reporting for data quality checks is minimal. It either creates tables that are overwritten with each run, losing historical data, or logs errors to files. This lack of comprehensive reporting and visualization hinders data quality analysis and communication with stakeholders.
Conclusion
While dbt’s built-in data quality tests provide a basic level of validation within data transformation workflows, their limited scope and lack of advanced features like rule generation, data observability, incident management, and reporting make them insufficient for comprehensive data quality management. Organizations relying solely on dbt tests for data quality might overlook critical issues and lack the tools for proactive monitoring and incident response.
Apache Griffin
Apache Griffin is an open-source data quality solution designed for big data environments. While it may not be as widely known as some other tools, Griffin offers a unique capability: validating data quality rules for streaming data sources like Apache Kafka, alongside traditional batch processing for Apache Spark and Hive. This makes it a compelling option for organizations dealing with real-time data streams.
Here’s an evaluation of Apache Griffin’s data quality capabilities:
Data Pipeline Integration
Griffin integrates with data pipelines by deploying a driver within an Apache Spark cluster. Configuration is handled through JSON files, which can be less user-friendly than other formats like YAML.
Comprehensive Checks
Griffin supports basic data quality checks, but its focus leans heavily towards statistical analysis and profiling. It lacks many common data quality checks found in other tools, such as pattern validation or checks for specific data quality issues beyond missing or duplicate values.
					{
  "name": "batch_accu",
  "process.type": "batch",
  "data.sources": [
    {
      "name": "src",
      "baseline": true,
      "connectors": [
        {
          "type": "hive",
          "version": "1.2",
          "config": {
            "database": "default",
            "table.name": "demo_src"
          }
        }
      ]
    }, {
      "name": "tgt",
      "connectors": [
        {

          "type": "hive",
          "version": "1.2",
          "config": {
            "database": "default",
            "table.name": "demo_tgt"
          }
        }
      ]
    }
  ],
  "evaluate.rule": {
    "rules": [
      {
        "dsl.type": "griffin-dsl",
        "dq.type": "accuracy",
        "out.dataframe.name": "accu",
        "rule": "src.id = tgt.id AND src.age = tgt.age AND src.desc = tgt.desc",
        "details": {
          "source": "src",
          "target": "tgt",
          "miss": "miss_count",
          "total": "total_count",
          "matched": "matched_count"
        },
        "out": [
          {
            "type": "metric",
            "name": "accu"
          },
          {
            "type": "record",
            "name": "missRecords"
          }
        ]
      }
    ]
  },
  "sinks": ["CONSOLE", "HDFS"]
}
Data quality checks configured in Apache Griffin.
Broad Connectivity
Griffin’s connectivity is limited to Apache Spark, Hive, and Kafka. While this covers common big data platforms, it lacks the broader connectivity of other tools that support various databases and cloud services.
Efficient Rule Generation
Griffin does not offer rule generation features. Its profiling module focuses on statistical analysis, calculating metrics like standard deviations and storing the output on HDFS. This output is not directly translated into executable data quality rules.
Data Observability
Griffin does not provide data observability features. It focuses on testing basic metrics and lacks incident management workflows to notify support teams about data quality issues.
User-Friendly Interface
Griffin does not have a user interface. All interactions are done through configuration files and command-line tools, which can be a barrier for non-technical users.
Incident Management
Griffin lacks incident management capabilities. Users must manually analyze results and build their own incident management workflows to handle data quality issues.
Reporting and Visualization
Griffin does not offer a built-in reporting interface. While it can generate profiling data and store it on HDFS, users must manually query this data and create reports. This lack of reporting features hinders data quality analysis and communication.
Conclusion
Apache Griffin offers a unique solution for data quality validation in batch and streaming environments, particularly for Spark and Kafka users. However, its limited connectivity, lack of rule generation, data observability, user interface, incident management, and reporting features make it less comprehensive than other data quality platforms. Organizations seeking a broader range of checks, easier rule management, and advanced data quality monitoring capabilities may find Griffin insufficient for their needs.
DQOps
DQOps stands out as a comprehensive source-available data quality platform that offers features typically found only in commercial, SaaS-based solutions. Although it is not a pure open-source platform, its source code is provided to users on Github by a Business Source License 1.1. Born from a rewrite and improvement of a system built for the world’s biggest advertiser, DQOps is a second-generation solution designed to address the long-term data quality needs of diverse users.
Here’s a breakdown of what makes DQOps a compelling choice:
Data Pipeline Integration
DQOps runs locally without requiring a database for configuration storage. Its YAML-based configuration files are intuitively named after the tables they test and offer in-place documentation, validation, and code completion in popular editors like VS Code, enhancing usability for data engineers.
Comprehensive Checks
With over 150 built-in data quality checks, DQOps provides extensive coverage for common data quality issues across all supported data sources. Its checks go beyond basic validation, incorporating anomaly detection powered by machine learning algorithms, enabling proactive identification of data quality issues.

Broad Connectivity
DQOps connects to over 20 data sources, including popular SQL databases and cloud storage services like AWS, Azure, and Google Cloud, ensuring compatibility with diverse data environments.
Efficient Rule Generation
DQOps leverages heuristics and machine learning to intelligently suggest data quality checks and parameters, streamlining the process of rule creation. Its user-friendly interface allows for iterative and incremental rule generation, empowering both technical and non-technical users to contribute to data quality improvement.
Data Observability
DQOps combines data observability and data quality testing into a single product. It stores historical data quality metrics locally in Parquet files, enabling anomaly detection and trend analysis without relying on a paid cloud service. ML-powered anomaly detection models in DQOps can detect subtle issues in data volume, completeness, uniqueness, and distribution.
User-Friendly Interface
DQOps provides a comprehensive user interface, empowering all users to profile datasets, identify data quality issues, and contribute to data quality initiatives. Its unique feature of custom data quality checks defined as Jinja2 templates allows data engineers to create reusable checks that can be easily configured by non-technical users through the UI.
Incident Management
DQOps distinguishes between data quality issues and incidents, reducing alert fatigue by grouping similar issues into manageable incidents. It offers flexible incident notification workflows configurable through the UI or by example, streamlining incident response and resolution.
Reporting and Visualization
DQOps excels in reporting capabilities by providing reporting screens with visualizations to showcase data quality health and historical trends. Its local data quality data lake stores all historical results, enabling users to build custom reports and analyses. The SaaS version offers over 50 customizable dashboards and even provides complimentary access to these dashboards for the free version, facilitating communication with business stakeholders.
Conclusion
DQOps is a powerful and comprehensive source-available data quality platform that addresses the needs of diverse users and supports long-term data quality improvement initiatives. Its combination of code-first configuration, a user-friendly interface, advanced rule generation, data observability, incident management, and robust reporting makes it a compelling choice for organizations seeking a complete and accessible data quality solution. DQOps empowers everyone to embark on their data quality journey, identify issues, and collaborate effectively to improve data health.
Data quality best practices - a step-by-step guide to improve data quality
- Learn the best practices in starting and scaling data quality
- Learn how to find and manage data quality issues
Combining Data Quality and Data Observability
While often mentioned in the same breath, data quality and data observability are distinct concepts. Data quality focuses on proactively profiling and testing data to understand its structure and identify potential issues. This involves defining specific data quality checks, either manually or with the assistance of automated rule generation.
Data observability, on the other hand, takes a more reactive approach. It continuously monitors data health, detecting anomalies and changes in data patterns over time. By leveraging machine learning and historical data, data observability platforms can identify potential data quality issues without explicit rules or thresholds.
A truly comprehensive data quality solution should combine both approaches. It should allow you to:
- Proactively define and validate data quality rules: Identify and address known data quality issues through explicit checks and thresholds.
- Continuously monitor data health: Detect anomalies and unexpected changes in data patterns that might indicate underlying data quality issues.
- Gain insights from historical data: Track data quality trends over time to understand how data health evolves and identify areas for improvement.
DQOps is a prime example of a platform that effectively combines data quality and data observability. It empowers users to define explicit data quality checks while also providing automated anomaly detection and historical data analysis, offering a holistic approach to data quality management. This combination enables organizations to proactively address known issues while also being alerted to unexpected changes and trends that might otherwise go unnoticed.
Other Features to Consider in Data Quality Tools
While core features like connectivity and rule generation are essential, several other functionalities can significantly enhance the effectiveness and usability of data quality tools. These features, though less frequently discussed, can be crucial for addressing specific data quality challenges and supporting advanced data quality management initiatives.
Here are some key features to consider:
Data Quality Checks with Data Segmentation
Data sources often contain data from various streams or business units, making it essential to analyze data quality at a granular level. Data segmentation allows you to run data quality checks on specific subsets of data, enabling more targeted analysis and accountability. For example, if a dataset includes a “country” column, data quality scores can be calculated for each country individually, providing insights into regional data quality and notifying the appropriate data owners. DQOps is unique in offering a hierarchical data segmentation for multi-level analysis.
Custom Data Quality Checks
While many tools claim to support custom data quality checks, they often limit this to uploading SQL queries with hardcoded table and column names. DQOps takes a more flexible approach by allowing users to define templated queries using Jinja2. These templates can be easily parameterized and configured through the user interface, empowering non-technical users to leverage custom checks without writing code.
Customizable Data Quality Reports
Communicating data quality insights to stakeholders often requires tailored reports that go beyond basic visualizations. DQOps addresses this by providing customizable data quality dashboards. Unlike tools that limit reporting to search screens within the user interface, DQOps offers a dedicated data quality metrics warehouse, enabling users to build custom reports and dashboards with a wide range of visualizations and analysis options. This level of customization is unmatched even among commercial data quality tools.
Data Quality and Data Lineage Integration
Understanding the flow of data is crucial for effective data quality management. DQOps offers two approaches to data lineage integration. It provides a client interface for synchronizing with external data lineage repositories like Marquez, the reference implementation of the OpenLineage standard. Additionally, DQOps includes incident-level data lineage tracking, using machine learning and similarity search to identify related source and target datasets, even without pre-defined lineage information.
Data Quality Scalability
Handling data quality in large-scale environments requires addressing specific scalability challenges. DQOps excels in this area by supporting incremental data quality monitoring for large datasets, parallel execution of checks across multiple data sources, and efficient handling of numerous checks on a single table. Its unique “partition checks” and built-in job scheduler optimize performance and minimize the load on data sources, enabling effective data quality management even for petabyte-scale datasets.
By considering these additional features, organizations can choose a data quality tool that not only addresses their current needs but also supports future growth and more advanced data quality initiatives. DQOps, with its comprehensive feature set and open-source accessibility, provides a compelling option for organizations seeking a robust and scalable data quality solution.
What is the DQOps Data Quality Operations Center
DQOps is a source-available data quality and observability platform designed to monitor data and assess the data quality trust score with data quality KPIs. DQOps provides extensive support for configuring data quality checks, applying configuration by data quality policies, detecting anomalies, and managing the data quality incident workflow.
DQOps is a platform that combines the functionality of a data quality platform to perform the data quality assessment of data assets. It is also a complete data observability platform that can monitor data and measure data quality metrics at table level to measure its health scores with data quality KPIs.
You can set up DQOps locally or in your on-premises environment to learn how DQOps can monitor data sources and ensure data quality within a data platform. Follow the DQOps documentation, go through the DQOps getting started guide to learn how to set up DQOps locally, and try it.
You may also be interested in our free eBook, “A step-by-step guide to improve data quality.” The eBook documents our proven process for managing data quality issues and ensuring a high level of data quality over time. This is a great resource to learn about data quality.