The process of analyzing data quality consists of various stages
Firstly, you need to design, build and integrate data from various sources. Next, you have to create and implement programs or queries to check data quality. Once you have done that, you need to store the results of data quality checks. After this, you should prepare and manage dashboards showcasing data quality results and finally, analyze the results.
In this article, we will discuss the storage of data quality check results.
We will walk you through the steps involved in creating a dataset and table in Bigquery using data definition language, built-in editor, cloud console, and cloud shell. You will also learn why it’s important to store data quality results. To keep it simple, we will cover one of the simpler cases of quality check – NULL count for each day in the dataset.
You don't need to build a data quality database
Before you continue reading, DQOps Data Quality Operations Center is a data quality platform that stores all data quality results locally in Parquet files. You can replicate the files into your data lake and have a private (on-premise) data quality warehouse, or you can use the DQOps Cloud SaaS offering and additionally get access to 50+ data quality dashboards.
Please refer to the DQOps documentation to learn how to start monitoring your data quality.
Table of Contents
The importance of proper results storage
It’s important to note that the process of analyzing data quality does not conclude with simply checking the data quality. Throughout the process, it is crucial to collect data, track its continuity, and create dashboards.
Sometimes, the connection between the data source and the analyzed table may be disrupted, leading to a data quality error message if queried during that time. However, a single event may not be indicative of a larger problem, as the data source may still be in its implementation stage or the issue may only occur sporadically.
Without historical data quality records for a specific table, it becomes difficult to identify and address potential issues. To gain a broader understanding of data quality, it is important to collect enough data to conduct a thorough analysis and display changes in data quality over time in dashboards.

Data quality best practices - a step-by-step guide to improve data quality
- Learn the best practices in starting and scaling data quality
- Learn how to find and manage data quality issues
Technologies we use
In the following example, we will use Google Cloud BigQuery, which is a serverless, highly scalable data warehouse. BigQuery is designed to handle data of petabyte size. So, using this technology, you can quickly load your data, run interactive queries, run batch queries, and create virtual tables from your data. This and other advantages of BigQuery attract the attention of corporations with a large volume of data. The same companies also need to check the quality of the data and use BigQuery to JSONize data quality.
Therefore, even though we use a very small dataset (46 MB), we highly recommend using Google Cloud BigQuery for cloud projects.
The dataset
In the example, we will use data from a free dataset acquired from here.
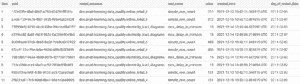
This dataset contains all the transactions occurring for a UK-based and registered, non-store online retail in two years.
First rows of the table:

Preparation of DQ check results
In our table, we will need the following pieces of information:
- Uuid: identifier.
- Value: result value for each test (Data Quality check).
- Tested resource: the name of the tested table or column.
- Test name: to navigate the test giving the ability to understand received values.
- Created time: time of the creation of the row in the table.
- Day of tested data: tested data information about the day.
The table can be created using an SQL statement.
In BigQuery, when we refer to a table, the syntax is as follows (keep in mind this part):
`[project_name].[dataset_name].[table_name]`
In our case the DDL is:
					CREATE TABLE `dqo-learning.data_quality.dq_check_results` (
	`uuid` STRING NOT NULL,
	`tested_resource` STRING NOT NULL,
	`test_name` STRING NOT NULL,
	`value` BIGNUMERIC NOT NULL,
	`created_time` TIMESTAMP NOT NULL,
	`day_of_tested_data` DATE NOT NULL
);
The table can be created using Google Console’s BigQuery UI as well.
Use the drop-down menu to navigate to the BIG DATA section. Click on Bigquery. We highly recommend pinning the most frequently used services.

On the left-hand side of the UI, you will find the name of your current project. Click Create dataset if you have not done so already.

The Project ID is automatically filled. In the Dataset ID field name your dataset, and select data location. Also keep in mind that location choice affects latency. There are more options to be configured, but for this tutorial, you can leave the default. Click CREATE DATASET.

Once the dataset is successfully created (it will appear under the project name on the left-hand side), you can start adding data. Click Create table.

Now you have to name your table, and specify the data source or select an empty table.

You can see all of the currently possible options below. Select where you want to get the data from. In this case, we would like to create an empty table and insert data using an SQL statement (it enables us to select certain data from other tables). To do that, select the Empty table in the Source field.

In our case, we have to specify the schema (because of INSERT statement construction, see Insertion preparation section)
Click Add filed under the Schema section.

Add and fill all of the necessary fields.

Notice the difference in terminology; here in the Mode section, we selected REQUIRED, which corresponds to the NOT NULL constraint.
Another way to define the schema is to use the JSON format. Enable Edit as text and define the schema as below.
					[
    {
        "mode": "REQUIRED",
        "name": "uuid",
        "type": "STRING"
    },
    {
        "mode": "REQUIRED",
        "name": "tested_resource",
        "type": "STRING"
    },
    {
        "mode": "REQUIRED",
        "name": "test_name",
        "type": "STRING"
    },
    {
        "mode": "REQUIRED",
        "name": "value",
        "type": "BIGNUMERIC"
    },
    {
        "mode": "REQUIRED",
        "name": "created_time",
        "type": "TIMESTAMP"
    },
    {
        "mode": "REQUIRED",
        "name": "day_of_tested_data",
        "type": "DATE"
    }
  ]
Click Create table. If everything was set up correctly, a new table should appear under the database on the left panel.

The preferred method utilizes Google Cloud Storage and Cloud Shell. And we recommend saving the schemas in the GCS Bucket. In our case, the bucket (dqo-learning-bigquery) has the following structure.
First, BigQuery can not directly use a schema from a bucket. We have to copy a JSON file to a local machine, which we can then pass in BigQuery.
The following command copies a JSON file from the bucket and utilizes it in the table creation command.
					dqo-learning
│
└───dqo-learning-bigquery
    │
    └───schema
        │   schema.json
gsutil cp gs://dqo-learning-bigquery/schema/schema.json schema.json && bq mk --table data_quality.example_table_name $_
Run the following command to display the information about the table.
bq show data_quality.dq_check_results
The output confirms that the table was created properly.

Implementing a data quality check (null count)
Next, let’s go through a real-world example by creating a simple null count as below. This data quality check counts NULLs for each day, which are stored in the table.
					SELECT SUM(
		CASE
			WHEN Customer_ID IS NULL THEN 1
			ELSE 0
		END
	) AS VALUE,
	DATE(
		FORMAT_TIMESTAMP("%Y-%m-%d", InvoiceDate) AS day_of_tested_data
		FROM `dqo-learning.data_quality.online_retail_II`
		GROUP BY DATE(FORMAT_TIMESTAMP("%Y-%m-%d", InvoiceDate))
A few rows returned from the data quality test:

Improving readability
Let’s improve code readability by using CTE (Common Table Expression) without changing the logic of the query.
The query below prepares (extracts) only necessary pieces of information from the table
					WITH data_preparation AS (
	SELECT Customer_ID AS tested_column,
		DATE(FORMAT_TIMESTAMP("%Y-%m-%d", InvoiceDate)) AS day_of_tested_data
	FROM `dqo-learning.data_quality.online_retail_II`
)
Data Quality check is implemented in the next part:
					SELECT SUM(
		CASE
			WHEN tested_column IS NULL THEN 1
			ELSE 0
		END
	) AS value,
	day_of_tested_data
FROM data_preparation
GROUP BY day_of_tested_data
Preparing data quality results
The DQ test now returns two columns, “value” and “day_of_tested_data”, but the DQ check result table needs more columns to be set (we set schema for six columns, and each of them can not contain NULL values). To save arrangement, the DQ check part is being moved to another CTE:
					dq_check AS (
	SELECT SUM(
			CASE
				WHEN tested_column IS NULL THEN 1
				ELSE 0
			END
		) AS value,
		day_of_tested_data
	FROM data_preparation
	GROUP BY day_of_tested_data
)
This SELECT statement returns all of the necessary columns.
					SELECT GENERATE_UUID() AS uuid,
	'dqo-learning.data_quality.online_retail_II' AS tested_resource,
	'simple_row_count' AS test_name,
	value,
	CURRENT_TIMESTAMP() AS created_time,
	day_of_tested_data
FROM dq_check
The result is:

Finally, by adding only one line at the beginning of the SQL query, the insertion is ready to be executed.
The complete SQL query in its full glory with INSERT statement is written below:
					INSERT INTO `dqo-learning.data_quality.dq_check_results` (
		uuid,
		tested_resource,
		test_name,
		value,
		created_time,
		day_of_tested_data
	) WITH data_preparation AS (
		SELECT Customer_ID AS tested_column,
			DATE(FORMAT_TIMESTAMP("%Y-%m-%d", InvoiceDate)) AS day_of_tested_data
		FROM `dqo-learning.data_quality.online_retail_II`
	),
	dq_check AS (
		SELECT SUM(
				CASE
					WHEN tested_column IS NULL THEN 1
					ELSE 0
				END
			) AS value,
			day_of_tested_data
		FROM data_preparation
		GROUP BY day_of_tested_data
	)
SELECT GENERATE_UUID() as uuid,
	'dqo-learning.data_quality.online_retail_II' AS tested_resource,
	'simple_row_count' as test_name,
	value,
	CURRENT_TIMESTAMP() as created_time,
	day_of_tested_data
FROM dq_check
When executed, similar information should appear:

From now on, it is possible to query created readings. Let’s go ahead and do that:
					SELECT *
FROM `dqo-learning.data_quality.dq_check_results` AS r
WHERE r.day_of_tested_data >= '2011-02-01'
	AND r.day_of_tested_data < '2011-03-01'
ORDER BY r.day_of_tested_data
What to do next?
Once you have obtained the results, the next step would be to use Business Intelligence (BI) tools like Data Studio, PowerBI, or Tableau to visualize them. Then, you can establish a consistent process of performing data quality checks, saving the outcomes, and creating visual representations of them.
Conclusion
Storing data quality check results is as important as performing data quality analysis. It binds the processes of gathering and analyzing data. Proper data storage management is crucial for using data for advantageous decision-making.
Choosing a complete data monitoring solution, such as the DQOps data quality platform, which includes a dedicated private data warehouse for storing all data quality results, can save you a lot of work.
To learn how to start measuring data quality, check out the DQOps getting started guide.
You can also download our free eBook “A Step-by-Step Guide to Improve Data Quality,” which describes our proven process for assessing data quality, monitoring it, and reacting to data quality issues.