Data quality improvement is a process of identifying and fixing problems in your data. It also means finding out why these problems happen and stopping them from happening again. Bad data, like incorrect or missing information, can cost a company a lot of money. For example, if a company has the wrong address for a customer, it can cause big problems when the company tries to contact them. This can make customers lose trust in the company. Other data problems can waste the time of business users and data analysts who need to use the data for their work.
When these problems are noticed by people inside the company and by customers, the company needs to fix the data. But fixing data quality issues is not just about correcting existing errors, like fixing a customer’s address. These errors will happen again if you don’t find and fix the root cause. For example, maybe the people entering the customer data don’t know how to do it correctly, or the computer program they use doesn’t check for errors. This can lead to problems like wrong zip codes or phone numbers in the wrong format. To fix these problems for good, you need to follow a data quality improvement process. This process helps you find the root cause of the problems and make changes to the computer programs or even the way the company does business to prevent these errors from happening again.
This article describes a proven data quality improvement process and describes all its steps.
Table of Contents
What is Data Quality
Data quality has two main meanings. First, it’s about how good your data is and how well you can use it. Think of it like this: if you’re planning a marketing campaign, high-quality customer data would have all the contact information you need (like names, emails, and phone numbers) and it would be accurate and up-to-date. This makes your data “fit for purpose” – it’s ready to be used for what you need it for.
Second, data quality is also about the work we do to keep our data healthy and usable. Data becomes unusable when it has problems, like missing information, incorrect values, or if it’s simply in the wrong format. This “unhealthy” data needs extra work to clean it up and make it usable.
Data becomes unusable when it has problems like:
- Missing values: Important information is missing.
- Outliers: Values that are far outside the expected range.
- Incorrect format: Data is not in the way your systems expect it.
When data is unhealthy, you have to spend extra time and effort cleaning it up so you can actually use it. Here are some common data quality problems that data quality tools can help you find:
- Missing data: Imagine a column in your database that’s supposed to have a unique identifier for each customer. If that’s missing, it’s a big problem!
- Duplicate values: Let’s say you have a column for customer IDs. Each ID should be unique, but sometimes you might find duplicates, which can really mess up your analysis.
- Values out of range: If you have an online store that sells items between $5 and $500, a product listed at -$5 or $5000 is probably a mistake.
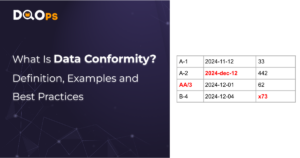
- Values in a wrong format: Sometimes data comes from different sources, and the format might not be consistent. For example, a date might be written as “2024-12-02” in one place and “December 2nd, 2024” in another.
- Unknown categorical values: Some columns should only have specific values. For instance, a “status” column might only allow “open,” “closed,” and “rejected.” A data quality tool can check if there are any unexpected values in that column.
Essentially, good data quality means your data is complete, accurate, consistent, and ready for you to use.
When to Improve Data Quality
It’s important to keep an eye on your data and know when it’s time to roll up your sleeves and improve its quality. Here are some key indicators that signal the need for data quality improvement:
- Data is not usable: If your datasets are full of errors or missing information, you won’t be able to use them effectively for tasks like analytics or AI projects. Cleaning and validating your data is crucial before you can get real value from it.
- Data reliability issues: When users consistently report problems with the data, such as missing values or outdated information, it’s a clear sign that data quality needs attention. These issues often point to underlying problems with how data is collected, processed, or stored.
- Compliance requirements: Sometimes, regulations or industry standards require you to maintain a certain level of data quality. For example, in banking, there are strict rules about how customer data must be handled and protected.
- Too much cleaning: If you find that your teams are spending a huge amount of time just cleaning and fixing data, it’s a sign of a systemic problem. Instead of constantly reacting to errors, you need to address the root causes of poor data quality.
- Users don’t trust the data: If users have noticed errors or inconsistencies in the data, they might start to lose trust in it. This can lead to people making decisions based on faulty information, which can have serious consequences.
- High operational costs: When data quality is poor, it can lead to a lot of wasted time and effort. Data teams might be constantly firefighting, trying to fix errors and respond to urgent requests. This prevents them from focusing on more strategic work that can add value to the organization.
By recognizing these situations, you can proactively address data quality issues and prevent them from becoming major obstacles.
Data Quality Improvement Goals
Every data quality improvement project needs a clear goal. This helps you focus your efforts and measure your success. Before you start, it’s important to figure out the biggest problem you want to solve.
Some common goals include:
- Accuracy: Making sure your data is correct and free from errors. This might mean reducing the number of incorrect customer addresses or product descriptions.
- Completeness: Ensuring that all the necessary data is present. For example, making sure that all customer records have a valid phone number or email address.
- Consistency: Making sure your data is consistent across different systems and databases. This might involve standardizing data formats or resolving discrepancies between different data sources.
- Timeliness: Ensuring that your data is up-to-date. This is particularly important for things like financial reports or inventory management.
- Validity: Making sure your data conforms to defined rules and standards. This might involve checking that data falls within allowed ranges or adheres to specific formats.
It’s important that your goals are:
- Measurable: You should be able to track your progress and measure your success. This often involves using data quality metrics, such as the percentage of complete records or the number of duplicate entries.
- Achievable: Your goals should be realistic and attainable within the available time and resources.
- Time-bound: Set a clear deadline for achieving your goals to maintain focus and momentum.
For example, your goal might be to reduce the number of duplicate customer records by 50% within the next three months. Or, you might aim to achieve a data quality score of 95% by the end of the year. By setting clear and measurable goals, you can ensure that your data quality improvement efforts are effective and deliver real value to your organization.
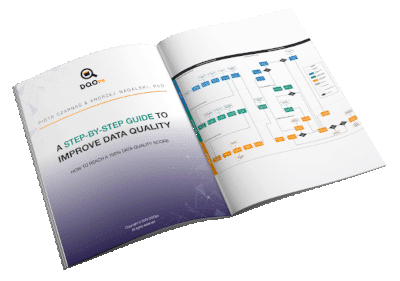
Data quality best practices - a step-by-step guide to improve data quality
- Learn the best practices in starting and scaling data quality
- Learn how to find and manage data quality issues
Sources of Data Quality Errors
Data quality problems can pop up for many different reasons. Here are some of the most common sources of errors:
- Data collection issues: If you don’t have good processes for collecting data, it’s easy for errors to creep in. For example, if you have a form that allows users to enter data without any validation checks, you might end up with missing values, incorrect formats, or inconsistent data.
- Data reliability issues: The systems that store and process your data can also introduce errors. For example, if your data pipelines are unreliable, you might experience data loss, delays, or even corruption.
- Incompatible data sources: Many organizations get data from multiple sources. If these sources have different standards or formats, it can lead to inconsistencies and errors when you try to combine the data.
- Legacy solutions: Older systems and applications can be a major source of data quality problems. These systems might be poorly documented, difficult to maintain, and prone to errors. Any changes to these systems can also introduce new bugs or inconsistencies.
By understanding these sources of errors, you can take steps to prevent them and improve the overall quality of your data. This might involve implementing data validation rules, improving data pipeline reliability, establishing data standards, or modernizing legacy systems.
Roles Involved In Data Quality Improvement
Improving data quality is a team effort. It’s best to run it like a project, with different people playing different roles. Here are some of the key players:
- Project Manager: This person keeps the project on track. They manage the budget, make sure everyone is working together, and help prioritize which problems to fix first. They also make sure that everyone communicates clearly, so the technical teams understand what the business needs.
- Business Data Owner: This is the person “in charge” of the data. They understand how the data is collected, used, and stored. They often sponsor the data quality improvement project and make sure it aligns with the business’s goals.
- Business Data Stewards: These are experts on the business side who really know how the data is used in everyday work. They help decide which data quality problems are the most important to fix and which ones might not be a big deal.
- Data Engineering Teams: These are the technical experts who manage the systems where the data is stored and processed. They fix data quality problems in the systems and make changes to prevent future errors. They might add steps to automatically fill in missing data or standardize data formats.
- Technical Data Stewards (Data Quality Testers): These individuals are responsible for assessing and testing the data to ensure it meets the requirements defined by the business. They use data quality tools and techniques to identify and report on data quality issues.
- Data Consumers: These are people who use the data, like data analysts and data scientists. They provide valuable feedback on data quality problems because they work with the data every day. They often find errors that others might miss because they’re building reports and models that rely on accurate data.
- Data Operations Teams: Once the data quality improvements are in place, these teams take over. They monitor the data, run the data quality checks, and keep everything running smoothly. If any new data quality problems pop up, they are the first to know and will work with everyone else to fix them.
- Software Engineers: Sometimes, the root cause of data quality problems lies within the applications that people use to collect or work with data. In these cases, software engineers need to get involved to fix bugs, add validation rules, or make other changes to the applications.
By working together, these different roles can ensure that data quality improvement projects are successful and deliver real benefits to the organization.
Stages of Data Quality Improvement Process
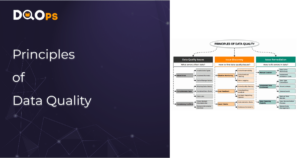
Improving data quality is an ongoing process that requires a structured approach. It usually involves three key stages: Data Quality Assessment, Data Quality Improvement, and Data Quality Prevention.
Data Quality Assessment is the first step where you take a close look at your data to understand its current condition. This involves figuring out what data you have, where it comes from, and what kind of problems it might have. Data owners, data stewards, and data quality testers work together to identify the most important datasets, define what good data quality means in this context, and use tools to uncover any data quality issues.
Next comes Data Quality Improvement, where you take action to fix the problems you found during the assessment. This might involve cleaning up existing data, correcting errors in your systems, or even changing the way you collect data in the first place. Data engineers are key players in this stage, working to fix data pipelines, implement data quality rules, and improve data processing systems. Data stewards also provide guidance on which data quality issues should be addressed first and how to fix them effectively.
Finally, Data Quality Prevention focuses on stopping data quality problems from happening again. This might involve setting up systems to monitor your data, implementing automatic data quality checks, and establishing clear rules and processes for managing data. Everyone has a role to play in prevention. Data engineers will set up automated checks and monitoring systems, data stewards will define data quality rules and standards, and data consumers will be responsible for reporting any new data quality issues they encounter.
By following these stages, you can create a continuous cycle of data quality improvement, ensuring that your data remains accurate, reliable, and valuable over time.
The following infographic provides examples of implementing a data quality improvement process according to these phases.
Data Quality Assessment
Data quality assessment is like a detective investigation where you gather clues about the health of your data. You need to talk to everyone who might know something about potential data problems. This includes people on the business side, like data owners and data stewards, who understand how the data is used in everyday operations. They can tell you about issues that have caused problems for the business, such as impacting sales, affecting customer satisfaction, or creating extra work for employees. You also need to talk to technical teams, like data scientists, BI developers, and data analysts. They can provide examples of data quality issues that have made their work harder. For instance, they might have tried to use a dataset that was full of errors or missing values, making it difficult to build accurate reports or models.
But talking to people is only part of the story. You also need to use tools and techniques to dig deeper into your data. This is where data profiling and automated data quality testing come in. Data profiling is like creating a summary of your data. It helps you understand the structure of your data by looking at samples and calculating statistics, such as the number of unique values in each column, the distribution of different values, and the frequency of missing data. This gives technical data stewards a good overview but doesn’t necessarily pinpoint specific data quality issues.
To find those issues, you need a data quality tool with a rule mining engine. This allows you to define various data quality checks and rules, and then run those checks against your data to identify potential errors. These tools can detect things like values that are outside of the expected range, inconsistent formats, duplicate entries, and missing values. Some tools, like DQOps, even use machine learning to help you configure these checks and rules automatically. You should also configure checks that specifically target the data quality issues reported by business and technical users during your interviews. By knowing how many issues are detected, you can estimate the effort required to fix them.
The assessment phase will uncover both known and new data quality issues. It’s important to discuss these issues with both business and technical users to confirm if they are valid and how important they are to fix. Some issues might be minor and have little impact on the business, while others might be critical and require immediate attention. Even if fixing an issue is expensive or time-consuming, it might be worth it if the cost of not fixing it is even greater. This means trying to evaluate the potential business impact and financial loss to the organization if these issues are not addressed. You should prioritize issues that cause costly problems but are relatively inexpensive to fix.
This assessment process should be repeated for each group of datasets or data domains within your organization. Here’s a breakdown of the steps involved:
- Pick critical datasets: Start by identifying the datasets that are causing the most trouble and need immediate attention. For example, a dataset containing customer information might have incorrect addresses, leading to failed deliveries and frustrated customers.
- Set expectations: Talk to users about the data quality problems they’ve encountered and what they consider to be acceptable data quality. For instance, users might have noticed inconsistencies in product descriptions across different sales channels, causing confusion and potentially lost sales.
- Test quality: Use data quality tools to check for known problems and common errors. This might involve looking for values that are outside of the expected range, such as negative values for quantities or dates in the future.
- Approve improvements: Once you’ve identified data quality issues, discuss them with users and business sponsors to get their approval for data cleansing actions. For example, data owners might need to approve a plan to standardize data formats across different systems.
Data Quality Improvement
The data quality improvement phase is where you roll up your sleeves and actually start fixing the problems you’ve identified. This involves two main areas: fixing the data that’s already been collected and stored, and fixing the root cause of the problems to prevent them from happening again. This might mean updating your data collection process, adding data quality checks to your systems, or even making changes to the applications that people use to enter and work with data.
Think of this improvement project like an agile software development project. You’ll have a list of tasks (a backlog), sorted by their priority. The most important data quality issues—those that have the biggest impact on the business—should be tackled first. This ensures that your data quality improvement project delivers value to the organization as quickly as possible. The project manager will help plan the work in short cycles, like weekly or bi-weekly sprints. The most critical problems are assigned to the upcoming sprint and given to the team members who can help. This might include data engineers who can add data quality checks to data pipelines or write scripts to clean up incorrect data. Business data stewards might review the fixes or provide guidance on how to address the problems without disrupting business operations. Technical data stewards might also need to configure additional data quality checks to confirm that the errors have been fixed.
The ultimate goal of the improvement process is to eliminate the source of the problems. This is how you achieve a real return on your investment in data quality. There are many potential causes to investigate, and some problems can be fixed at different stages of the data lifecycle. For example, you might add validation rules to data entry screens in business applications, like CRMs, to prevent incorrect data from being entered in the first place. If that’s not feasible, you might implement automated data quality checks in your data pipelines that can fix data as it’s being processed. For instance, a pipeline could look up missing information in external data sources or standardize data formats.
Of course, you also need to deal with the data that’s already been affected. If old data is still needed for business processes, you might need to clean it up. Small errors in a few records can be fixed manually in master data management systems. But if the errors affect many records, you’ll need dedicated scripts to fix thousands or even millions of records. Since these cleansing scripts often require coding, it’s a good practice to have data engineers build a library of reusable scripts that can be used in the future if the problem resurfaces.
Because this is an agile process, after fixing a batch of errors, you’ll go back to your prioritized list and tackle the next most important issues in the next iteration. This creates a continuous cycle of improvement.
Here are the key steps in the data quality improvement process:
- Prioritize: Decide which problems are the most important to fix by considering both the severity of the issue and how critical the data is to the business. For example, duplicate records in a sales database might have a bigger impact than inconsistent formatting in a customer feedback survey.
- Find the root cause: Trace the data lineage to understand where the data comes from and how it’s transformed. This will help you pinpoint the source of the problem. For instance, you might discover that missing values are caused by a bug in a data entry form or a lack of validation rules in a data pipeline.
- Fix the cause: Work with data platform owners and software engineers to fix the underlying problems in your systems and applications. This might involve correcting code, updating data pipelines, or improving data collection processes. For example, you might add a data enrichment step to a pipeline to fill in missing values or implement validation rules in a data entry form to prevent invalid data from being entered.
- Clean the data: Assess the extent of incorrect data and clean up the data that’s actively being used. This might involve standardizing data formats, removing duplicate records, or correcting invalid values. For example, you might write a script to unify the format of phone numbers and remove any that are invalid.
Data Quality Prevention
Preventing data quality issues from recurring is a critical aspect of any data quality management strategy. Changes to business applications, data pipelines, or other systems can introduce new errors or reintroduce old ones. These changes may impact data structure, disable validation rules, or lead to data reliability problems that affect downstream applications and analyses. Therefore, a proactive approach to data quality prevention is essential.
Data quality checks configured during the assessment phase provide a valuable foundation for ongoing monitoring. Automating these checks and executing them at regular intervals enables continuous validation of data integrity. This proactive approach helps maintain data health and provides early warnings of potential issues.
Beyond schema changes, monitoring data distribution and identifying anomalies in data delivery are crucial. Data observability tools play a key role in this process. These tools track various database metrics and leverage machine learning to detect anomalies in real-time. For example, they can identify unexpected delays in data delivery, unusual spikes or dips in data values, or outliers that deviate significantly from expected ranges. Such anomalies may indicate underlying issues in data pipelines, source systems, or data entry processes.
Tracking data quality KPIs offers a quantitative measure of data reliability over time. These KPIs may include metrics such as the number of data quality issues detected and resolved, the time taken to resolve issues, and the overall trend of data quality improvements. Monitoring these KPIs provides valuable insights into the effectiveness of data quality initiatives and helps identify areas for further improvement.
Engaging data-literate users in data quality validation is another important aspect of prevention. Self-service data quality tools empower data analysts, data stewards, and data scientists to configure and execute data quality checks on datasets they use. This fosters a collaborative approach to data quality management and enables the creation of a comprehensive library of data quality checks that can be reused and monitored over time.
Here’s a summary of key data quality prevention measures:
- Observe anomalies: Utilize data observability tools to monitor for unusual patterns or outliers in data, such as unexpected spikes, dips, or delays in data delivery. These anomalies may indicate underlying issues in data pipelines or source systems.
- Retest quality: Schedule periodic execution of previously configured data quality checks to detect recurring issues. This helps ensure that previously resolved data quality problems do not reemerge.
- Self-service quality monitoring: Empower data-literate users to perform data quality tests and contribute their own checks for scheduling. This encourages broader participation in data quality management and leverages the expertise of those who work directly with the data.
- Benchmark and track: Continuously monitor data quality KPIs across datasets to identify any trends or declines in reliability. This provides a quantitative measure of data quality over time and helps identify areas for improvement.
How to Measure Data Quality Progress
Data quality improvement projects, like any other initiative, need to demonstrate a return on investment. Business sponsors want to see clear evidence of progress, but they’re usually not interested in the technical details of how problems are being fixed. Instead, they want to track the overall improvement in data quality and understand the impact on the business.
This is where data quality KPIs (Key Performance Indicators) come in. These are metrics that measure the health of your data. They can be calculated for individual tables, columns, or entire data sources. A common approach is to measure data quality scores for different data quality dimensions, such as completeness, consistency, validity, uniqueness, and timeliness. These dimensions represent different types of data quality issues that can affect your data.
One popular formula for calculating data quality KPIs at the table level is to measure the percentage of failed data quality checks over a specific period. For example, if you’re monitoring a table with 10 required columns and you check for null values daily, you’ll perform 300 checks in a month (30 days x 10 columns). If one column had missing values for three days, that would result in 3 failed checks out of 300, or a 1% failure rate. In this case, the data quality KPI score would be 99%.
Tracking data quality KPIs across all your datasets and data sources allows you to benchmark and compare the reliability of different platforms or data domains. This can help you identify areas that need more attention and allocate resources effectively. For example, if you see that one data source consistently has lower data quality scores than others, you might decide to invest more time and effort in improving its data quality.
By regularly monitoring and reporting on data quality KPIs, you can demonstrate the progress of your data quality improvement efforts and provide valuable insights to business sponsors and stakeholders. This helps ensure that your data quality initiatives are aligned with business goals and deliver tangible benefits to the organization.
The following screenshot shows how DQOps measures data quality KPIs in monthly periods to show the progress of data quality improvement to the business sponsors.

Data Profiling Tools
Data profiling is a crucial first step in the data quality assessment process. It helps technical data stewards, who may not have direct knowledge of the business processes, understand the structure and characteristics of the data they’re working with. Essentially, data profiling tools provide a summary of your data, highlighting key information about its content and quality.
These tools typically collect a variety of metrics and statistics, including:
- Sample values: Data profiling tools extract a representative sample of values from each column, giving you a glimpse into the actual data being stored.
- Metadata: They gather information about the dataset’s structure, such as the column names, data types, and any constraints or rules defined on the data.
- Completeness: They identify columns with missing values and measure the extent of missing data across the dataset.
- Uniqueness: They detect columns that contain only unique values, which are likely primary keys or important identifiers. For other columns, they count the number of distinct values, helping identify potential categorical or discrete variables.
- Statistical analysis: For numeric columns, they calculate statistical measures like mean, median, minimum, maximum, and standard deviation, providing insights into the distribution and range of values.
- Histograms: They generate visual representations of the data distribution, making it easier to understand the frequency and spread of different values.
All these metrics help the data quality team gain a comprehensive understanding of the data’s structure, content, and potential quality issues. Some teams might choose to write SQL queries and analyze the data manually, while others prefer using dedicated data profiling tools like the DQOps platform. These tools automate the data profiling process and provide a user-friendly interface for exploring and visualizing the results.
Data Quality Testing Tools
Data quality testing is the cornerstone of any successful data quality improvement process. To identify and confirm data quality issues, you need to test your datasets thoroughly. Each test, known as a data quality check, focuses on a specific metric or rule. For instance, a check might scan for duplicate values to ensure a column is unique, as specified by business requirements. While some data quality teams rely on manually created SQL queries for testing, this approach can be time-consuming, error-prone, and costly.
Dedicated data quality testing tools offer a more efficient and robust solution. These tools typically provide a built-in library of common data quality checks, covering a wide range of data quality dimensions like completeness, validity, consistency, and uniqueness. While a pre-defined list of checks might seem limiting, most tools offer flexibility for running custom checks as well. This often involves allowing users to write their own SQL queries to detect invalid records, which the tool then executes and reports on.
More advanced data quality testing tools, such as DQOps, go a step further by enabling the creation of reusable data quality checks designed as templates. This feature allows organizations to establish a standardized library of checks aligned with data governance policies. For example, you could create a template for validating account identifiers or tax ID formats. These templates can then be easily reused by anyone testing data, whether it’s during the assessment phase or when a data analyst wants to verify a table before using it in a report. This eliminates the need for users to write complex validation logic from scratch, saving time and ensuring consistency in data quality checks across the organization.
Data Cleaning Tools
Data cleansing is the process of fixing errors and inconsistencies in your data. The approach you take will depend on the extent of the issues and the nature of your data.
For minor errors affecting only a few records, manual correction within the source system might be the simplest solution. For instance, if a few customer records in your CRM are missing contact information, you can update them directly through the CRM’s interface.
When errors affect a larger number of records, specialized tools like master data management (MDM) systems become more efficient. MDM tools are designed for working with individual records and offer features like data enrichment (filling missing values by referencing other systems) and data transformation (applying expressions to modify data). For example, if a “ticket” dataset contains a “status” column with inconsistent casing (“CLOSED” and “closed”), an MDM tool can apply a transformation to standardize the values to uppercase.
However, manual corrections and MDM tools often require repeated effort when new invalid records are introduced. To address this, data cleansing logic can be automated and integrated directly into business applications. This approach, which typically involves software engineers, ensures that data is cleansed at the point of entry, preventing errors from propagating further.
Another effective approach is to delegate data cleansing tasks to data engineers. They can create dedicated data cleansing scripts, often using SQL UPDATE statements, to identify and correct specific types of errors. These scripts can be used both for one-time cleanup of existing data and for ongoing data cleansing within data pipelines. This ensures that incoming data is automatically cleansed and existing data is periodically validated and corrected.
By combining different data cleaning approaches and tools, organizations can effectively address data quality issues and maintain data integrity.
Data Observability Tools
Preventing data quality errors often hinges on proactively monitoring changes that might impact data quality and continuously testing data to ensure it meets requirements. Key sources of data quality issues include changes to data structure (schema) and data distribution. Fortunately, these are measurable aspects that can be monitored to detect anomalies and trigger timely interventions.
Data observability tools specialize in monitoring data quality by capturing and analyzing key metrics about datasets. These metrics might include schema information (e.g., column names and data types), row counts, and the number of unique values in columns. Significant changes in these metrics can signal potential data quality issues that require investigation.
These tools leverage machine learning to analyze time-series data and detect unexpected changes in these metrics. For example, if an “invoice” table typically grows at a stable rate of 1,000 records per day, a sudden increase of 30,000 records would raise an alert. This anomaly might indicate a data pipeline glitch, such as a batch of invoices being loaded twice, leading to duplicates.
Data quality tools that integrate data observability features, such as DQOps, can automatically detect these changes without requiring users to define specific checks for monitoring row counts or detecting duplicates. When an anomaly is detected, these tools initiate a data quality incident workflow, notifying operations teams to review and investigate the issue. While a sudden increase in invoice records might be legitimate (e.g., due to a merger or acquisition), it warrants investigation to rule out potential data quality problems.
By continuously monitoring data and proactively identifying anomalies, data observability tools help organizations maintain data quality, prevent errors, and ensure data reliability.
What is the DQOps Data Quality Operations Center
DQOps is a data quality and observability platform designed to monitor data and assess the data quality trust score with data quality KPIs. DQOps provides extensive support for configuring data quality checks, applying configuration by data quality policies, detecting anomalies, and managing the data quality incident workflow.
DQOps is a platform that combines the functionality of a data quality platform to perform the data quality assessment of data assets. It is also a complete data observability platform that can monitor data and measure data quality metrics at table level to measure its health scores with data quality KPIs.
You can set up DQOps locally or in your on-premises environment to learn how DQOps can monitor data sources and ensure data quality within a data platform. Follow the DQOps documentation, go through the DQOps getting started guide to learn how to set up DQOps locally, and try it.
You may also be interested in our free eBook, “A step-by-step guide to improve data quality.” The eBook documents our proven process for managing data quality issues and ensuring a high level of data quality over time. This is a great resource to learn about data quality.