Last updated: July 05, 2025
How to Detect NULL Values with Data Quality Checks? Examples
This sample shows how to use data quality checks to detect null values in the table and view the results on data quality dashboards.
Overview
The following example verifies that the number of null values in a column does not exceed the maximum accepted count.
PROBLEM
America’s Health Rankings provides an analysis of national health on a state-by-state basis by evaluating a historical and comprehensive set of health, environmental and socioeconomic data to determine national health benchmarks and state rankings.
The platform analyzes more than 340 measures of behaviors, social and economic factors, physical environment and clinical care data. Data is based on public-use data sets, such as the U.S. Census and the Centers for Disease Control and Prevention’s Behavioral Risk Factor Surveillance System (BRFSS), the world’s largest, annual population-based telephone survey of over 400,000 people.
We want to verify the number of null values on source column.
SOLUTION
We will verify the data of bigquery-public-data.america_health_rankings.ahr using monitoring
nulls_count column check.
Our goal is to verify that the number of null values in the source column does not exceed the set threshold.
If you want to learn more about checks and threshold levels, please refer to the DQOps concept section.
VALUE
If the number of nulls values exceed the set threshold, a error alert will be triggered.
Data structure
The following is a fragment of the bigquery-public-data.america_health_rankings.ahr dataset. Some columns were omitted for clarity.
The source column of interest contains NULL values.
| report_type | measure_name | state_name | subpopulation | source |
|---|---|---|---|---|
| 2021 Health Disparities | Maternal Mortality | United States | Non-Metropolitan Area | |
| 2021 Health Disparities | Dedicated Health Care Provider | Indiana | Other Race | CDC, Behavioral Risk Factor Surveillance System |
| 2021 Health Disparities | Dedicated Health Care Provider | Hawaii | Black/African American | CDC, Behavioral Risk Factor Surveillance System |
| 2021 Health Disparities | Dedicated Health Care Provider | Kansas | Other Race | CDC, Behavioral Risk Factor Surveillance System |
| 2021 Health Disparities | Dedicated Health Care Provider | Idaho | CDC, Behavioral Risk Factor Surveillance System | |
| 2021 Health Disparities | Dedicated Health Care Provider | New York | American Indian/Alaska Native | CDC, Behavioral Risk Factor Surveillance System |
| 2021 Health Disparities | Dedicated Health Care Provider | Indiana | Black/African American | CDC, Behavioral Risk Factor Surveillance System |
| 2021 Health Disparities | Dedicated Health Care Provider | Montana | High School Grad | CDC, Behavioral Risk Factor Surveillance System |
| 2021 Health Disparities | Dedicated Health Care Provider | Alabama | Male | CDC, Behavioral Risk Factor Surveillance System |
| 2021 Health Disparities | Dedicated Health Care Provider | Alaska | Male | CDC, Behavioral Risk Factor Surveillance System |
Run the example using the user interface
A detailed explanation of how to start DQOps platform and run the example is described here.
Navigate to a profiling section to collect basic statistics
To navigate to the profiling section using the user interface:
To propose a configuration of data quality checks, the rule miner requires basic data statistics.
Follow these steps to collect basic data statistics:
- Navigate to the Profiling section.
- Select the
ahrtable from the tree view on the left. This will open the Basic data statistics tab. - Click on the Collect statistics.
This will collect the basic statistics for the table and all columns.

Learn more about basic statistics in the Working with DQOps section.
Propose a configuration of data quality check using rule mining
After collecting the basic statistics, the rule mining screen can propose a configuration of data quality checks. To navigate to the rule miner, click on the Data quality rule mining tab in the Profiling section.
The rule mining screen allows you to view and select the automatically proposed configuration of data quality checks. DQOps proposes a list of data quality checks instantly upon entering the rule mining screen.
You can use filters to narrow down the list of data quality check proposals. Filter the results to include only checks from the nulls category by entering "nulls" in the Check category input field and source in the Column name field.
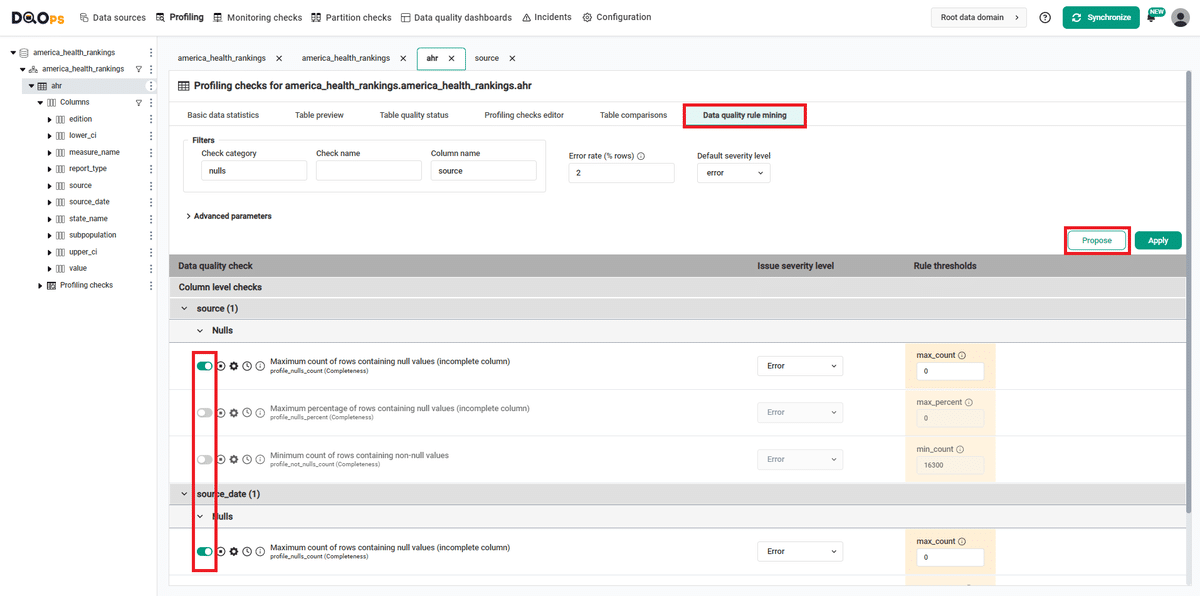
After clicking the Propose button, select checks from the proposed list for the selected columns using the switches. In the example, profile_nulls_count was selected for the source and source_data columns. Selected checks will throw an error if the number of null values exceeds 0.
Pressing the Apply button saves the configuration of data quality checks and their rules. A popup window will appear, notifying you that the checks have been activated and that you can run the activated check by clicking on the Confirm button.
Review Table quality status
After the Run checks job finishes, you can review the summary of the identified data quality issues on the Table quality status screen. Click on the Table quality status tab to navigate to that screen.

The Table quality status screen summarizes data quality issues identified for each column and each category of data quality checks. It includes the number of executed checks and detailed results per table and columns grouped by check categories or data quality dimensions. DQOps calculates a data quality KPI score, which is measured as the percentage of data quality checks that passed successfully.
At the bottom of the screen, you will find a table that displays the check results per category, table, and column.
The colored boxes indicate the current or the highest severity status: green for a correct result, yellow for a warning, orange for an error, red for a fatal error, and grey stripes for an execution error.
You can click on the colored box to view a list of checks that contribute to the result. Hovering over the check name will provide more details.
In this example, we have demonstrated how to use DQOps to verify that the source column contains the nulls values. By using the nulls_count column check, we can monitor if the number of nulls in a column exceeds a set threshold. If it does, DQOps will create an incident and can send a notification.
Follow the link to learn how to configure notifications.
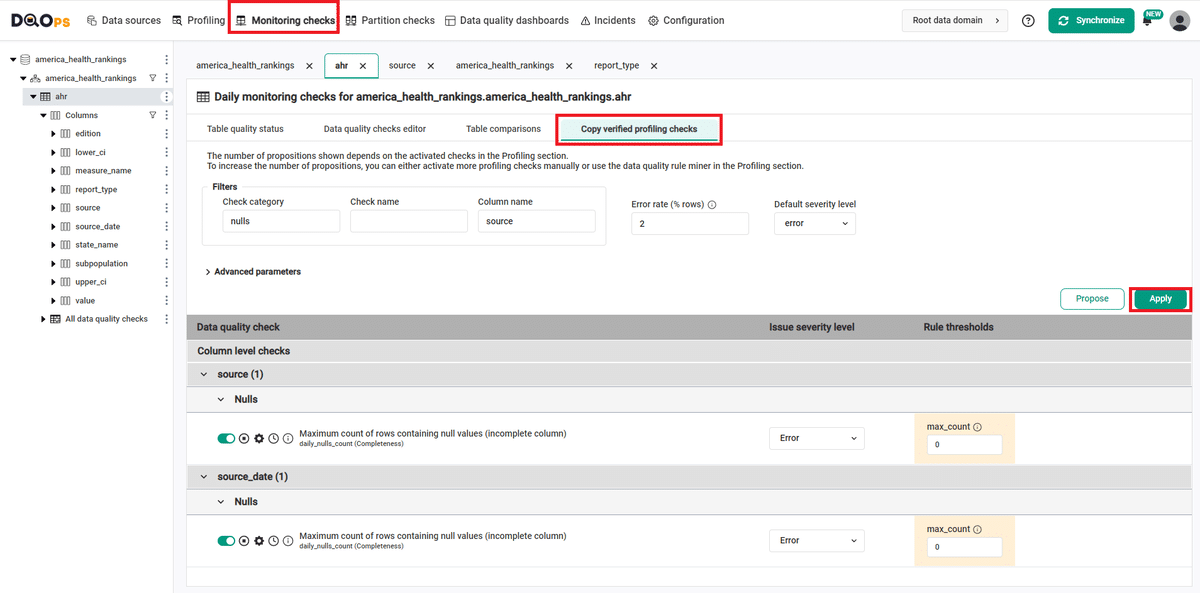
Copy the verified profiling check to the monitoring checks
To start monitoring data quality using a newly configured check we need to copy the configuration of the nulls_count check in the Profiling section to the Monitoring checks:
- Navigate to the Monitoring checks section.
- Select the table from the tree view on the left.
- Click on the Copy verified profiling checks tab.
- Click the Apply button.
- Click the Confirm button in the popup to run configured checks.
Run checks
Run the activated check using the Run check button.
You can also run all the checks for an entire subcategory of checks using the Run check button at the end of the line with the check subgroup name.

View detailed check results
Access the detailed results by clicking the Results button. The results should be similar to the one below.

Within the Results window, you will see three categories: Check results, Sensor readouts, and Execution errors. The Check results category shows the severity level that result from the verification of sensor readouts by set rule thresholds. The Sensor readouts category displays the values obtained by the sensors from the data source. The Execution errors category displays any error that occurred during the check's execution.
The actual value of null values in this example is 8, which is above the maximum threshold level set in the warning (5). The check gives a warning result (notice the yellow square to the left of the check name).
Synchronize the results with the cloud account
Synchronize the results with your DQOps cloud account using the Synchronize button located in the upper right corner of the user interface.
Synchronization ensures that the locally stored results are synced with your DQOps Cloud account, allowing you to view them on the dashboards.
ges/examples/current-completeness-issues-on-columns-dashboard.png){ loading=lazy; width="1200px" }
Change a schedule at the connection level
With DQOps, you can easily customize when checks are run by setting schedules. You can set schedules for an entire connection, table, or individual check.
After importing new tables, DQOps sets the schedule for 12:00 P.M. (noon) every day. Follow the steps below to change the schedule.

-
Navigate to the Data Source section.
-
Choose the connection from the tree view on the left.
-
Click on the Schedule tab.
-
Select the Monitoring daily tab
-
Select the Run every day at and change the time, for example, to 10:00. You can also select any other option.
-
Once you have set the schedule, click on the Save button to save your changes.
By default, scheduler is active. You can turn it off by clicking on notification icon in the top right corner of the screen, and clicking the toggle button.

Once a schedule is set up for a particular connection, it will execute all the checks that have been configured across all tables associated with that connection.
You can read more about scheduling here.
You might also want to check the Running checks with a scheduler example.
YAML configuration file
The YAML configuration file stores both the table details and checks configurations.
In this example, we set the maximum number of thresholds for checks to 0.
The highlighted fragments in the YAML file below represent the segment where the monitoring daily_nulls_count checks are configured.
If you want to learn more about checks and threshold levels, please refer to the DQOps concept section.
apiVersion: dqo/v1
kind: table
spec:
   incremental_time_window:
      daily_partitioning_recent_days: 7
      monthly_partitioning_recent_months: 1
   columns:
      edition:
         type_snapshot:
            column_type: INT64
            nullable: true
      report_type:
         type_snapshot:
            column_type: STRING
            nullable: true
      measure_name:
         type_snapshot:
            column_type: STRING
            nullable: true
      state_name:
         type_snapshot:
            column_type: STRING
            nullable: true
      subpopulation:
         type_snapshot:
            column_type: STRING
            nullable: true
      value:
         type_snapshot:
            column_type: FLOAT64
            nullable: true
      lower_ci:
         type_snapshot:
            column_type: FLOAT64
            nullable: true
      upper_ci:
         type_snapshot:
            column_type: FLOAT64
            nullable: true
      source:
         type_snapshot:
            column_type: STRING
            nullable: true
         profiling_checks:
            nulls:
               profile_nulls_count:
                  error:
                     max_count: 0
      source_date:
         type_snapshot:
            column_type: STRING
            nullable: true
         profiling_checks:
            nulls:
               profile_nulls_count:
                  error:
                     max_count: 0
Next steps
- You haven't installed DQOps yet? Check the detailed guide on how to install DQOps using pip or run DQOps as a Docker container.
- For details on the nulls_count check used in this example, go to the check details section.
- You might be interested in another completeness check that evaluates that the number of rows in a table does not exceed the minimum accepted count.
- Would you like to add your own connection? Here you can find information about supported databases and how to add new connection.
- DQOps provide you with summary statistics about your table and column. This information can be valuable in deciding which data quality checks and threshold levels should be set to monitor data quality. For more details about Basic data statistics, click here.