Last updated: October 22, 2024
How to monitor and detect table availability issues with data observability
This sample shows how to use data quality checks to detect table availability issues and view the results on data quality dashboards.
Overview
The following example shows how to verify the availability of a table in the database using a simple row count.
PROBLEM
For any database analysis, it is important that the tables exist and are available.
Typical table availability issues are:
- the table does not exist because it has been deleted,
- the table is corrupted and cannot be queried,
- the database is down or is unreachable,
- database credentials are incorrect,
- access rights to the table have changed.
In this example, we will use a simple row count to verify table availability in the database and ensure that queries can be executed without errors.
As an example we use America’s Health Rankings database. This database provides an analysis of national health on a state-by-state basis by evaluating a historical and comprehensive set of health, environmental and socioeconomic data to determine national health benchmarks and state rankings.
SOLUTION
We will verify the data using monitoring table_availability check. Our goal is to verify that table availability check failures do not exceed the set thresholds. In this check, you can only get two values in the result 1 or 0. If you get a value of 1, it means the table exists and is available, so the result is valid.
However, if you receive a value of 0, then there is a problem, and you need to run this check again after fixing the issue with the table. The number of failed attempts are failures, which we set in thresholds.
Table availability checks has a max_failures parameter which indicates a maximum number of consecutive check failures. A check is failed when the sensor's query failed to execute due to a connection error, missing table or a corrupted table.
In this example, we will set the following maximum failures at 0 for the check.
If you want to learn more about checks and threshold levels, please refer to the DQOps concept section.
VALUE
If the number of failures exceeds 0, a warning alert will be triggered.
Run the example using the user interface
A detailed explanation of how to start DQOps platform and run the example is described here.
Navigate to a list of checks
To navigate to a list of checks prepared in the example using the user interface:
-
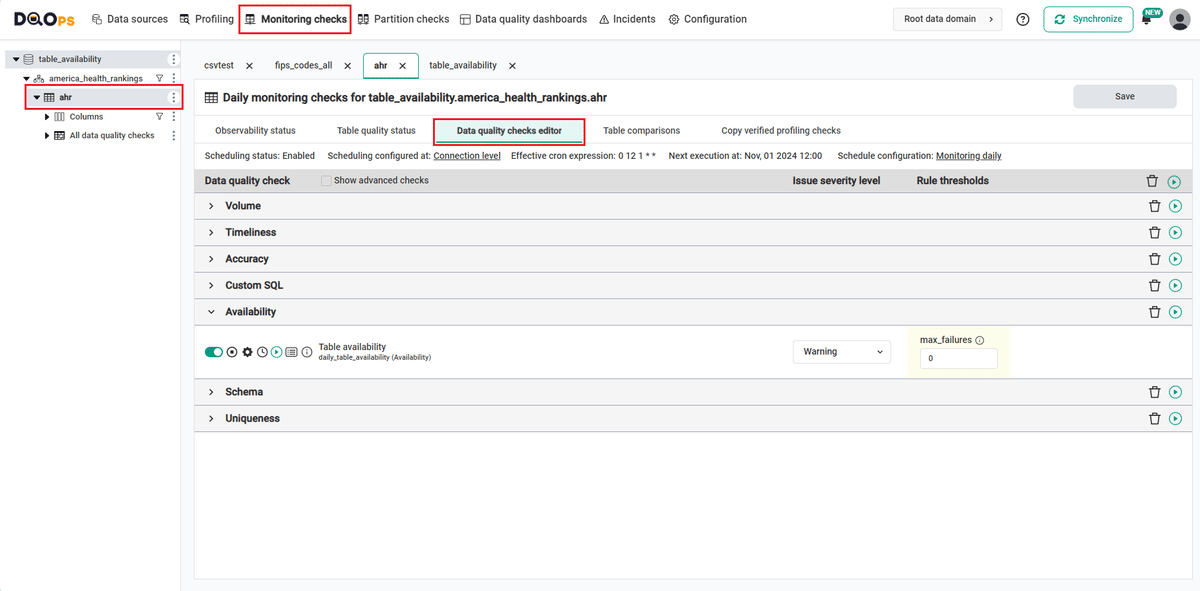
Go to the Monitoring section.
The Monitoring Checks section enables the configuration of data quality checks that are designed for the daily and monthly monitoring of your data source.
-
Select the table or column mentioned in the example description from the tree view on the left.
On the tree view you can find the tables that you have imported. Here is more about adding connection and importing tables.
-
Select the Daily checks tab.
This tab displays a list of data quality checks in the check editor. Learn more about navigating the check editor.
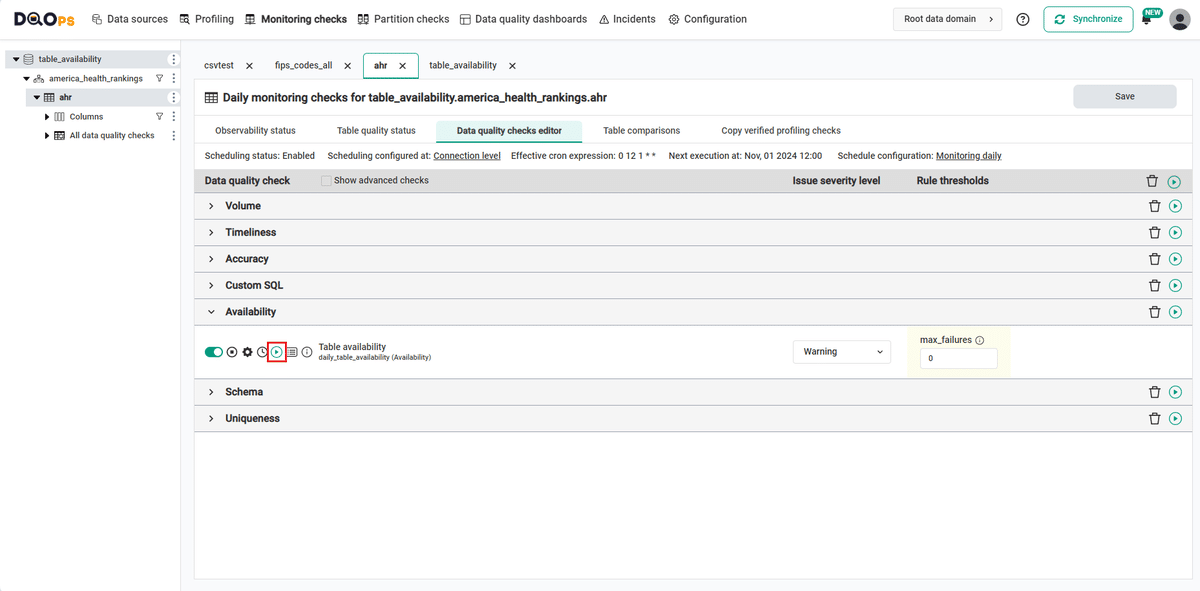
Run checks
Run the activated check using the Run check button.
You can also run all the checks for an entire subcategory of checks using the Run check button at the end of the line with the check subgroup name.
View detailed check results
Access the detailed results by clicking the Results button. The results should be similar to the one below.
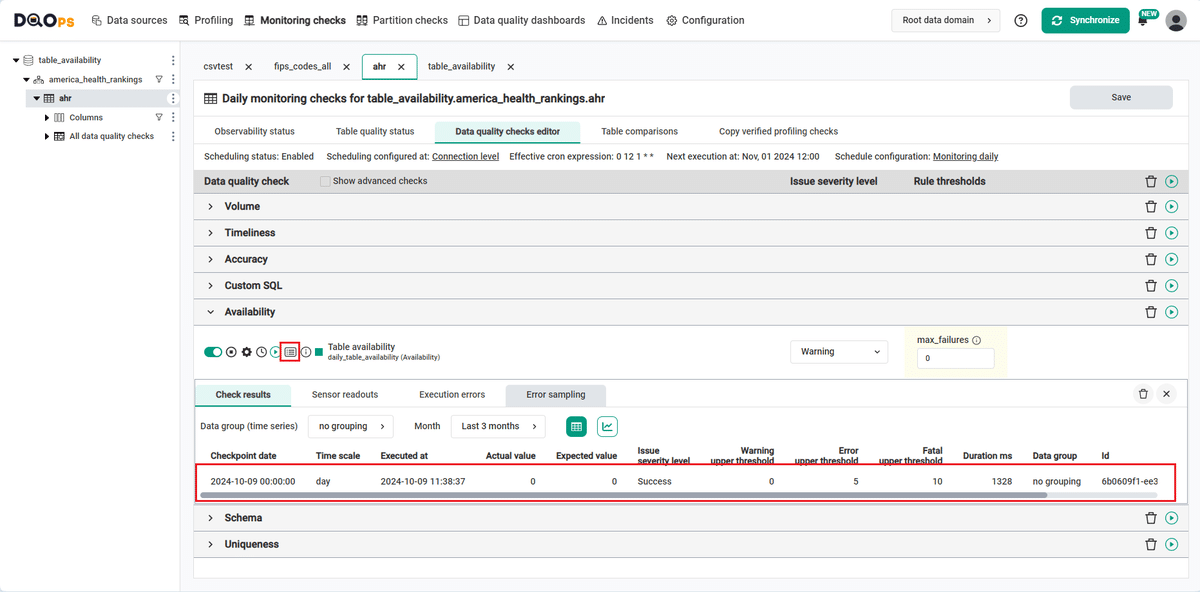
Within the Results window, you will see three categories: Check results, Sensor readouts, and Execution errors. The Check results category shows the severity level that result from the verification of sensor readouts by set rule thresholds. The Sensor readouts category displays the values obtained by the sensors from the data source. The Execution errors category displays any error that occurred during the check's execution.
The actual value in this example is 0. The check gives a correct result (notice the green square to the left of the check name).
Synchronize the results with the cloud account
Synchronize the results with your DQOps cloud account using the Synchronize button located in the upper right corner of the user interface.
Synchronization ensures that the locally stored results are synced with your DQOps Cloud account, allowing you to view them on the dashboards.
YAML configuration file
The YAML configuration file stores both the table details and checks configurations.
In this example, we have set the following maximum failures at 0 for the check.
The highlighted fragments in the YAML file below represent the segment where the monitoring daily_table_availability check is configured.
If you want to learn more about checks and threshold levels, please refer to the DQOps concept section.
apiVersion: dqo/v1
kind: table
spec:
   incremental_time_window:
      daily_partitioning_recent_days: 7
      monthly_partitioning_recent_months: 1
   monitoring_checks:
      daily:
         availability:
            daily_table_availability:
               warning:
                  max_failures: 0
   columns:
      edition:
         type_snapshot:
            column_type: INT64
            nullable: true
      report_type:
         type_snapshot:
            column_type: STRING
            nullable: true
In this example, we have demonstrated how to use DQOps to verify the availability of a table in the database. By using the table_availability check, we can monitor whether the tables exist and are available.
Next steps
- You haven't installed DQOps yet? Check the detailed guide on how to install DQOps using pip or run DQOps as a Docker container.
- For details on the table_availability check used in this example, go to the check details section.
- DQOps provides you with summary statistics about your table and column. This information can be valuable in deciding which data quality checks and threshold levels should be set to monitor data quality. For more details about Basic data statistics, click here.
- DQOps allows you to keep track of the issues that arise during data quality monitoring and send alert notifications directly to Slack. Learn more about incidents and Slack notifications.
- The data in the table often comes from different data sources and vendors or is loaded by different data pipelines. Learn how data grouping in DQOps can help you calculate separate data quality KPI scores for different groups of rows.