Last updated: July 22, 2025
What are Data Quality Dimensions? Definitions, Examples and Best Practices
Data quality dimensions are standards for evaluating the quality of data, to make sure it's suitable for its intended use. They are measured by quality checks.
What is a data quality dimension?
Data quality dimension is a term adopted by the data quality field to identify these aspects of data that can be measured and through which its quality can be quantified. While different experts have proposed different data quality dimensions and there is no standardization of their names or descriptions, almost all of them include some version of accuracy, completeness, consistency, timeliness, uniqueness, and validity.
DQOps additionally uses Integrity, Availability, and Reasonableness data quality dimensions because they identify issues that affect unstructured data in data lakes.
Data quality dimension types
The following table explains data quality dimensions supported by DQOps, showing both the definition of the dimension, and examples of typical data quality issues.
| Data quality dimension name | Data quality dimension definition | Potential data quality issues |
|---|---|---|
| Accuracy | The degree of closeness of data values to real values, often measured by comparison with a known source of correct information (the source of truth). | The data in a downstream data source does not match the original data from an upstream data source. Aggregated values computed in values do not match similar values from a different data source (financial data). |
| Availability | The degree to which the data source is available for usage with no access issues. | The table is missing. Credentials to the data source expired. Table is physically corrupted due to an unrecoverable hard disk failure. |
| Completeness | The degree to which all required - records in the dataset, - data values are present with no missing information. |
Required columns are empty. Tables are empty or too small. The percentage of null values exceeds an accepted threshold. |
| Consistency | The degree to which data values of two sets of attributes - within a record, - within a data file, - between data files, - within a record at different points in time comply with a rule. This dimension confirms that the quality of values is consistent across the time periods. |
An abnormal value outside regular boundaries is found using anomaly detection. The aggregated value (sum, min, max, avg) for one time period differs too much from an earlier period (yesterday, last month, etc.). |
| Integrity | The degree to which relational data is structurally correct. | Lookup by a foreign key value did not find a matching record in a dimension or dictionary table. |
| Reasonableness | The degree to which data values have are reasonable and make sense. | A sum of values in an aggregable column is within an accepted range. For example, the total revenue per day is within reasonable boundaries. |
| Timeliness | The degree to which the period between the time of creation of the real value and the time that the dataset is available is appropriate (the data is fresh). | The data is not up-to-date. The most recent record is not older than an accepted delay. |
| Uniqueness | The degree to which records occur only once in a data set and are not duplicated. | Duplicate values found in a key column that must contain only unique values. |
| Validity | The degree to which data values comply with pre-defined business rules such as the format, patterns, type, and range. E.g. zip codes. e-mails | Invalid phone format. Values not matching regular expression patterns. |
The list of data quality checks for each data quality dimension is found in sections below.
How data quality dimensions are measured
DQOps measures data quality by calculating a data quality KPI score. It is as a percentage of passed data quality checks out of all executed checks. The data quality KPI is represented as a percentage value. The following formula calculates the score.

The data quality KPI is calculated by grouping data quality check results by the data quality dimension. The following image shows a data quality KPI dashboard from DQOps, showing the results for each measured data quality dimension.

Best practices for monitoring data quality dimensions
Selecting data quality dimensions is one of the steps in the process of defining business needs for data quality monitoring. This is usually done by the Data Owner who understands the purpose of the data, the data model, and the business processes in their area of responsibility.
Before you can select data quality dimensions that are relevant for your organization, you must first identify current goals and scope in terms of data quality monitoring. This will make it easier to come up with the metrics to measure its quality.
Next, you need to identify the data elements that are critical or required for a specific business process that needs to be monitored. This data is typically referred to as critical data elements (CDEs). The Data Owner should also collect and define the expectations of data consumers regarding the condition of the data, that ensure its suitability for particular purposes.
It is also a good idea to review the list of previous data quality issues that the Data Owner would like to eliminate in the future.
Only after completing the previous steps, you can assess data quality dimensions that are important for your organization. For example, if the data must arrive on time and without delays - the organization should prioritize timeliness. If it is more important that the data arrives in a certain format - the organization should prioritize validity.
You can learn more about defining data quality requirements and how to set up the whole data quality monitoring process in our eBook "A step-by-step guide to improve data quality".
The purpose of data quality dimensions
Measuring data quality dimensions ensures data meets its purpose, establishes benchmarks for improvement, and builds trust in data-driven decisions. By quantifying key aspects, you can identify and prioritize improvements, ensuring reliable insights and data-driven decision making. It also helps track progress and justify data quality investments, fostering a shared understanding across the organization.
In short, measuring data quality dimensions transforms a vague concept like "good data" into concrete, actionable metrics that are essential for ensuring the trustworthiness of your data-driven processes.
Assess data current status
Measuring data quality dimensions allows you to assess data fitness for use by uncovering issues and determining its suitability for specific purposes. Data quality dimensions help identify problems like missing values (completeness), misspellings and wrong values (validity), inconsistencies and data anomalies (consistency), and outdated information (timeliness).
You can also use these dimensions to determine if your data is good enough for a particular task, such as basic reporting versus complex predictive modeling, since different use cases may have varying requirements across data quality dimensions.
The following image shows the data quality KPI scores divided by data sources, schemas, and tables. When a data quality dimension is selected on the dashboard, the results are filtered to show the scores only for that dimension.

Establish benchmark and track improvements
Data quality dimensions provide measurable attributes, transforming data quality assessments from subjective judgments to quantifiable metrics. This allows you to monitor progress over time and track whether your data cleansing initiatives, governance policies, or operational changes are positively impacting the quality of your data.
The following image shows the data quality KPI calculated for each data quality dimension. The initial scores (the benchmark) can be calculated during the data profiling phase.

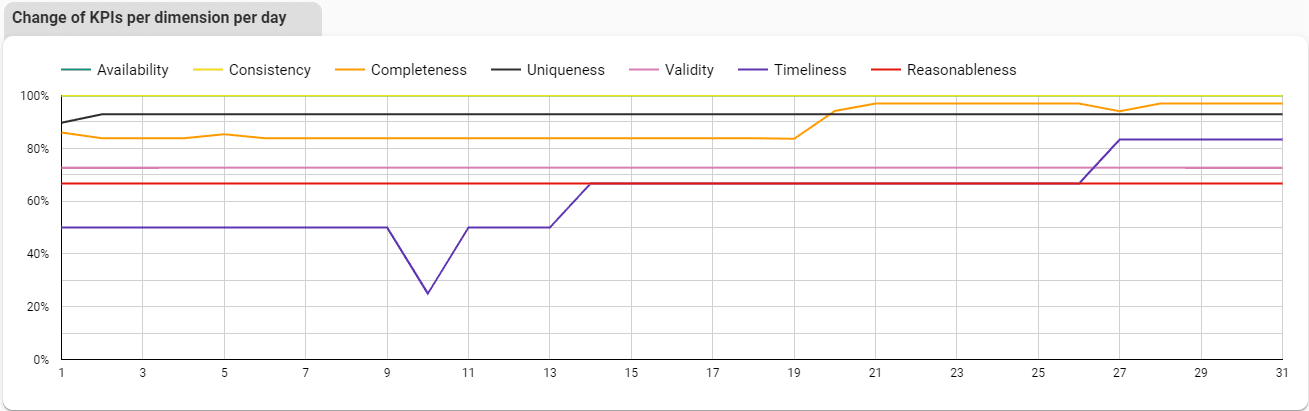
We can also track data quality improvement for each data quality dimension over time. The following chart shows the data quality KPIs for each day of the month and data quality dimension.
Facilitate data-driven decision making
Measuring data quality dimensions empowers data-driven decision making in two key ways. First, high-quality data builds trust in the insights and visualizations derived from it. You can be confident that your conclusions are based on reliable information, not flawed data.
Second, understanding the strengths and limitations of your data across various dimensions allows you to make informed business decisions. Data quality insights guide your actions and prevent you from basing critical choices on potentially inaccurate information.
Prioritize data quality effort
By measuring data quality dimensions, you can identify the areas where data quality issues have the biggest impact. This allows you to focus your resources on making improvements that will yield the greatest benefits. Additionally, tracking changes in data quality over time helps you demonstrate the return on investment (ROI) of data quality initiatives. This can be crucial for justifying continued investment in maintaining and improving data quality.
The best method to prioritize the data cleansing process is to filter data quality results by a data quality dimension with a low KPI score. Then, cleanse the tables with the lowest data quality score or those whose KPI score has dropped since the previous month.

Enhance trust and collaboration
Clearly defined and measured data quality dimensions establish transparent standards and
build trust among data consumers and those who manage it.
This creates a common vocabulary for discussing data quality, making collaboration between data producers and users more effective.
Everyone involved has a clear understanding of what constitutes high-quality data, which fosters better communication and collaboration.
Data quality dimensions reference
The following chapters describe every data quality dimension in detail and include a list of data quality checks that measure that dimension.
Data Accuracy
Data accuracy definition
The following table provides an overview of the accuracy data quality dimension.
| Dimension | Description | How DQOps measures data accuracy |
|---|---|---|
| Accuracy | The data accuracy dimension measures how much the data matches the source of truth. Simply speaking, it is about comparing tables. This process is also called data reconciliation. |
DQOps detects data accuracy issues by comparing data across tables and data sources. |
Table accuracy checks
The following table lists data quality checks that detect accuracy issues on tables.
| Data quality check name | Friendly name | Check category | Description | Standard check |
|---|---|---|---|---|
| total_row_count_match_percent | Maximum percentage of difference in total row count between tables | accuracy | A table-level check that compares the row count of the current (tested) table with the row count of another table that is referenced. This check ensures that the difference between the row counts is below the maximum accepted percentage of difference. This check runs an SQL query with an INNER JOIN clause to join another (referenced) table that must be defined in the same database. | |
| row_count_match | Maximum percentage of difference between row count of compared tables | comparisons | Table level comparison check that compares the row count of the current (parent) table with the row count of the reference table. | |
| column_count_match | Maximum percentage of difference between column count of compared tables | comparisons | Table level comparison check that compares the column count of the current (parent) table with the column count of the reference table. |
Column accuracy checks
The following table lists data quality checks that detect accuracy issues on columns.
| Data quality check name | Friendly name | Check category | Description | Standard check |
|---|---|---|---|---|
| total_sum_match_percent | The maximum difference in percent between the total sums of this column and the reference column | accuracy | A column-level check that ensures that the difference between the sum of all values in the tested column and the sum of values in another column in a referenced table is below a maximum accepted percentage of difference. This check runs an SQL query with an INNER JOIN clause to join another (referenced) table that must be defined in the same database. | |
| total_min_match_percent | The maximum difference in percent between the minimum value of this column and the reference column | accuracy | A column-level check that ensures that the difference between the minimum value in the tested column and the minimum value in another column in a referenced table is below a maximum accepted percentage of difference. This check runs an SQL query with an INNER JOIN clause to join another (referenced) table that must be defined in the same database. | |
| total_max_match_percent | The maximum difference in percent between the maximum value of this column and the reference column | accuracy | A column-level check that ensures that the difference between the maximum value in the tested column and the maximum value in another column in a referenced table is below a maximum accepted percentage of difference. This check runs an SQL query with an INNER JOIN clause to join another (referenced) table that must be defined in the same database. | |
| total_average_match_percent | The maximum difference in percent between the average value of this column and the reference column | accuracy | A column-level check that ensures that the difference between the average value in the tested column and the average value of another column in the referenced table is below the maximum accepted percentage of difference. This check runs an SQL query with an INNER JOIN clause to join another (referenced) table that must be defined in the same database. | |
| total_not_null_count_match_percent | The maximum difference in percent between the count of not null values of this column and the reference column | accuracy | A column-level check that ensures that the difference between the count of null values in the tested column and the count of null values in another column in a referenced table is below a maximum accepted percentage of difference. This check runs an SQL query with an INNER JOIN clause to join another (referenced) table that must be defined in the same database. | |
| sum_match | Maximum percentage of difference between sums of compared columns | comparisons | A column-level check that ensures that compares the sum of the values in the tested column to the sum of values in a reference column from the reference table. Compares the sum of values for each group of data. The data is grouped using a GROUP BY clause and groups are matched between the tested (parent) table and the reference table (the source of truth). | |
| min_match | Maximum percentage of difference between minimum values of compared columns | comparisons | A column-level check that ensures that compares the minimum value in the tested column to the minimum value in a reference column from the reference table. Compares the minimum values for each group of data. The data is grouped using a GROUP BY clause and groups are matched between the tested (parent) table and the reference table (the source of truth). | |
| max_match | Maximum percentage of difference between maximum values of compared columns | comparisons | A column-level check that ensures that compares the maximum value in the tested column to maximum value in a reference column from the reference table. Compares the maximum values for each group of data. The data is grouped using a GROUP BY clause and groups are matched between the tested (parent) table and the reference table (the source of truth). | |
| mean_match | Maximum percentage of difference between mean (average) values of compared columns | comparisons | A column-level check that ensures that compares the mean (average) of the values in the tested column to the mean (average) of values in a reference column from the reference table. Compares the mean (average) value for each group of data. The data is grouped using a GROUP BY clause and groups are matched between the tested (parent) table and the reference table (the source of truth). | |
| not_null_count_match | Maximum percentage of difference between the counts of not null values in compared columns | comparisons | A column-level check that ensures that compares the count of not null values in the tested column to the count of not null values in a reference column from the reference table. Compares the count of not null values for each group of data. The data is grouped using a GROUP BY clause and groups are matched between the tested (parent) table and the reference table (the source of truth). | |
| null_count_match | Maximum percentage of difference between the counts of null values in compared columns | comparisons | A column-level check that ensures that compares the count of null values in the tested column to the count of null values in a reference column from the reference table. Compares the count of null values for each group of data. The data is grouped using a GROUP BY clause and groups are matched between the tested (parent) table and the reference table (the source of truth). | |
| distinct_count_match | Maximum percentage of difference between the counts of distinct values in compared columns | comparisons | A column-level check that ensures that compares the count of distinct values in the tested column to the count of distinct values in a reference column from the reference table. Compares the count of distinct values for each group of data. The data is grouped using a GROUP BY clause and groups are matched between the tested (parent) table and the reference table (the source of truth). |
Data Availability
Data availability definition
The following table provides an overview of the availability data quality dimension.
| Dimension | Description | How DQOps measures data availability |
|---|---|---|
| Availability | The data availability dimension shows how reliable the data source is regarding accessibility. Simply speaking, the table can be queried during business hours. |
DQOps detects data availability issues by running a simple SQL query as part of the default configuration of data observability checks. |
Table availability checks
The following table lists data quality checks that detect availability issues on tables.
| Data quality check name | Friendly name | Check category | Description | Standard check |
|---|---|---|---|---|
| table_availability | Table availability | availability | A table-level check that ensures a query can be successfully executed on a table without server errors. It also verifies that the table exists and is accessible (queryable). The actual value (the result of the check) indicates the number of failures. If the table is accessible and a simple query can be executed without errors, the result will be 0.0. A sensor result (the actual value) of 1.0 indicates that there is a failure. Any value greater than 1.0 is stored only in the check result table and represents the number of consecutive failures in the following days. |
Data Completeness
Data completeness definition
The following table provides an overview of the completeness data quality dimension.
| Dimension | Description | How DQOps measures data completeness |
|---|---|---|
| Completeness | The data completeness dimension identifies missing data. Simply speaking, tables are empty, or columns contain null values. |
DQOps detects data completeness issues by running a row count query to detect empty or too small tables. The column completeness is measured by detecting null values or values that are probably null values, but a null placeholder text was found in a column. Common null placeholder values are 'n/a', 'null', 'undefined', 'None'. |
Table completeness checks
The following table lists data quality checks that detect completeness issues on tables.
| Data quality check name | Friendly name | Check category | Description | Standard check |
|---|---|---|---|---|
| column_count | Expected column count | schema | A table-level check that retrieves the metadata of the monitored table from the data source, counts the number of columns and compares it to an expected number of columns. | |
| row_count | Minimum row count (empty or too small table) | volume | This check detects empty or too-small tables. It captures the row count of a tested table. This check raises a data quality issue when the row count is below a minimum accepted value. The default value of the rule parameter min_count is 1 (row), which detects empty tables. When the data grouping is configured, this check will count rows using a GROUP BY clause and verify that each data grouping has an expected minimum number of rows. |
Column completeness checks
The following table lists data quality checks that detect completeness issues on columns.
| Data quality check name | Friendly name | Check category | Description | Standard check |
|---|---|---|---|---|
| nulls_count | Maximum count of rows containing null values (incomplete column) | nulls | Detects incomplete columns that contain any null values. Counts the number of rows having a null value. Raises a data quality issue when the count of null values is above a max_count threshold. | |
| nulls_percent | Maximum percentage of rows containing null values (incomplete column) | nulls | Detects incomplete columns that contain any null values. Measures the percentage of rows having a null value. Raises a data quality issue when the percentage of null values is above a max_percent threshold. Configure this check to accept a given percentage of null values by setting the max_percent parameter. | |
| nulls_percent_anomaly | Abnormal change in percentage of null values. Measured as a percentile of anomalous measures. | nulls | Detects day-to-day anomalies in the percentage of null values. Measures the percentage of rows having a null value. Raises a data quality issue when the rate of null values increases or decreases too much. | |
| not_nulls_count | Minimum count of rows containing non-null values | nulls | Verifies that a column contains a minimum number of non-null values. The default value of the min_count parameter is 1 to detect at least one value in a monitored column. | |
| not_nulls_percent | Maximum percentage of rows containing non-null values | nulls | Verifies that a column contains some null values by measuring the maximum percentage of rows that have non-null values. Raises a data quality issue when the percentage of non-null values is above max_percentage, which means that a column that is expected to have null values is The default value of the max_percentage parameter is 0.0, but DQOps supports setting a higher value to verify that the percentage of null values is not above a threshold. | |
| empty_column_found | Find an empty column | nulls | Detects empty columns that contain only null values. Counts the number of rows that have non-null values. Raises a data quality issue when the count of non-null values is below min_count. The default value of the min_count parameter is 1, but DQOps supports setting a higher number to assert that a column has at least that many non-null values. | |
| nulls_percent_change | Maximum percentage of change in the count of null values | nulls | Detects relative increases or decreases in the percentage of null values since the last measured percentage. Measures the percentage of null values for each day. Raises a data quality issue when the change in the percentage of null values is above max_percent of the previous percentage. | |
| nulls_percent_change_1_day | Maximum percentage of change in the count of null values vs 1 day ago | nulls | Detects relative increases or decreases in the percentage of null values since the previous day. Measures the percentage of null values for each day. Raises a data quality issue when the change in the percentage of null values is above max_percent of the previous percentage. | |
| nulls_percent_change_7_days | Maximum percentage of change in the count of null values vs 7 day ago | nulls | Detects relative increases or decreases in the percentage of null values since the last week (seven days ago). Measures the percentage of null values for each day. Raises a data quality issue when the change in the percentage of null values is above max_percent of the previous percentage. | |
| nulls_percent_change_30_days | Maximum percentage of change in the count of null values vs 30 day ago | nulls | Detects relative increases or decreases in the percentage of null values since the last month (30 days ago). Measures the percentage of null values for each day. Raises a data quality issue when the change in the percentage of null values is above max_percent of the previous percentage. | |
| column_exists | Verify if the column exists | schema | A column-level check that reads the metadata of the monitored table and verifies if the column still exists in the data source. The data quality sensor returns a value of 1.0 when the column is found or 0.0 when the column is not found. | |
| empty_text_found | Maximum count of empty text values | whitespace | This check detects empty texts that are not null. Empty texts have a length of zero. The database treats them as values different than nulls, and some databases allow the storage of both null and empty values. This check counts empty texts and raises a data quality issue when the number of empty values exceeds a max_count parameter value. | |
| whitespace_text_found | Maximum count of whitespace values | whitespace | This check detects empty texts containing only spaces and other whitespace characters. This check counts whitespace-only texts and raises a data quality issue when their count exceeds a max_count parameter value. | |
| null_placeholder_text_found | Maximum count of null placeholder values (i.e., None, n/a, null) | whitespace | This check detects text values that are well-known equivalents (placeholders) of a null value, such as null, None, n/a. This check counts null placeholder values and raises a data quality issue when their count exceeds a max_count parameter value. | |
| empty_text_percent | Maximum percentage of empty texts values | whitespace | This check detects empty texts that are not null. Empty texts have a length of zero. This check measures the percentage of empty texts and raises a data quality issue when the rate of empty values exceeds a max_percent parameter value. | |
| whitespace_text_percent | Maximum percentage of whitespace values | whitespace | This check detects empty texts containing only spaces and other whitespace characters. This check measures the percentage of whitespace-only texts and raises a data quality issue when their rate exceeds a max_percent parameter value. | |
| null_placeholder_text_percent | Maximum percentage of null placeholder values (i.e., None, n/a, null) | whitespace | This check detects text values that are well-known equivalents (placeholders) of a null value, such as null, None, n/a. This check measures the percentage of null placeholder values and raises a data quality issue when their rate exceeds a max_percent parameter value. |
Data Consistency
Data consistency definition
The following table provides an overview of the consistency data quality dimension.
| Dimension | Description | How DQOps measures data consistency |
|---|---|---|
| Consistency | The data consistency dimension ensures that the data stays consistent across different time periods. Simply speaking, there are no anomalies detected by time series analysis. The Britannica Dictionary provides the simplest definition of consistency, which says: "the quality or fact of staying the same at different times". |
Data consistency is the most misunderstood data quality dimension. Every data quality vendor uses a different definition. According to some definitions, data consistency refers to the accuracy and uniformity of data stored across multiple data sources. However, this definition is too close to data accuracy, which is measured by comparing tables across data sources (data reconciliation). Other versions define data consistency as representing data in the same format across time or different systems. This definition is also too close to the data validity dimension, which validates whether the data is in the right format. DQOps has chosen to follow a dictionary definition of consistency, which perfectly fits into the modern approach to data quality monitoring. DQOps uses time series anomaly detection, which is known as Data Observability. DQOps uses anomaly detection and data comparison within the same table to compare measures across time periods. For example, the daily row count today is close to the daily row count from yesterday. |
Table consistency checks
The following table lists data quality checks that detect consistency issues on tables.
| Data quality check name | Friendly name | Check category | Description | Standard check |
|---|---|---|---|---|
| column_count_changed | Detect change of column count | schema | A table-level check that detects if the number of columns in the table has changed since the last time the check (checkpoint) was run. This check retrieves the metadata of the monitored table from the data source, counts the number of columns and compares it to the last known number of columns that was captured and is stored in the data quality check results database. | |
| column_list_changed | Detect if columns were added or removed | schema | A table-level check that detects if the list of columns has changed since the last time the check was run. This check will retrieve the metadata of a tested table and calculate a hash of the column names. The hash will not depend on the order of columns, only on the column names. A data quality issue will be detected if new columns were added or columns that existed during the previous test were dropped. | |
| column_list_or_order_changed | Detect if the column list or order has changed | schema | A table-level check that detects if the list of columns and the order of columns have changed since the last time the check was run. This check will retrieve the metadata of a tested table and calculate a hash of the column names. The hash will depend on the order of columns. A data quality issue will be detected if new columns were added, columns that existed during the previous test were dropped or the columns were reordered. | |
| column_types_changed | Detect if the column list or data type has changed | schema | A table-level check that detects if the column names or column types have changed since the last time the check was run. This check calculates a hash of the column names and all the components of the column's data type: the data type name, length, scale, precision and nullability. A data quality issue will be detected if the hash of the column data types has changed. This check does not depend on the order of columns, the columns can be reordered as long as all columns are still present and the data types match since the last time they were tested. | |
| row_count_anomaly | Abnormal change in row count since the last known value | volume | This check detects anomalies in the day-to-day changes to the table volume (the row count). It captures the row count for each day and compares the row count change (increase or decrease) since the previous day. This check raises a data quality issue when the change is in the top anomaly_percent percentage of the biggest day-to-day changes. | |
| row_count_change | Maximum relative change in the row count since the last known value | volume | This check compares the current table volume (the row count) to the last known row count. It raises a data quality issue when the change in row count (increase or decrease) exceeds a maximum accepted percentage of change. | |
| row_count_change_1_day | Maximum relative change in the row count vs 1 day ago | volume | This check compares the current table volume (the row count) to the row count from the previous day. It raises a data quality issue when the change in row count (increase or decrease) since yesterday exceeds a maximum accepted percentage of change. | |
| row_count_change_7_days | Maximum relative change in the row count vs 7 days ago | volume | This check compares the current table volume (the row count) to the row count seven days ago. This check compares the table volume to a value a week ago to overcome weekly seasonability and to compare Mondays to Mondays, Tuesdays to Tuesdays, etc. It raises a data quality issue when the change in row count (increase or decrease) since a week ago exceeds a maximum accepted percentage of change. | |
| row_count_change_30_days | Maximum relative change in the row count vs 30 days ago | volume | This check compares the current table volume (the row count) to the row count 30 days ago. This check compares the table volume to a month ago value to overcome monthly seasonability. It raises a data quality issue when the change in row count (increase or decrease) since a value 30 days ago exceeds a maximum accepted percentage of change. |
Column consistency checks
The following table lists data quality checks that detect consistency issues on columns.
| Data quality check name | Friendly name | Check category | Description | Standard check |
|---|---|---|---|---|
| sum_anomaly | Abnormal change in the sum of numeric values. Measured as a percentile of anomalous values. | anomaly | This check calculates a sum of values in a numeric column and detects anomalies in a time series of previous sums. It raises a data quality issue when the sum is in the top anomaly_percent percentage of the most outstanding values in the time series. This data quality check uses a 90-day time window and requires a history of at least 30 days. | |
| mean_anomaly | Abnormal change in the mean (average) of numeric values. Measured as a percentile of anomalous values. | anomaly | This check calculates a mean (average) of values in a numeric column and detects anomalies in a time series of previous averages. It raises a data quality issue when the mean is in the top anomaly_percent percentage of the most outstanding values in the time series. This data quality check uses a 90-day time window and requires a history of at least 30 days. | |
| median_anomaly | Abnormal change in the median of numeric values. Measured as a percentile of anomalous values. | anomaly | This check calculates a median of values in a numeric column and detects anomalies in a time series of previous medians. It raises a data quality issue when the median is in the top anomaly_percent percentage of the most outstanding values in the time series. This data quality check uses a 90-day time window and requires a history of at least 30 days. | |
| min_anomaly | Abnormal change in the minimum of numeric values. Measured as a percentile of anomalous values. | anomaly | This check finds a minimum value in a numeric column and detects anomalies in a time series of previous minimum values. It raises a data quality issue when the current minimum value is in the top anomaly_percent percentage of the most outstanding values in the time series (it is a new minimum value, far from the previous one). This data quality check uses a 90-day time window and requires a history of at least 30 days. | |
| max_anomaly | Abnormal change in the maximum of numeric values. Measured as a percentile of anomalous values. | anomaly | This check finds a maximum value in a numeric column and detects anomalies in a time series of previous maximum values. It raises a data quality issue when the current maximum value is in the top anomaly_percent percentage of the most outstanding values in the time series (it is a new maximum value, far from the previous one). This data quality check uses a 90-day time window and requires a history of at least 30 days. | |
| mean_change | Maximum relative change in the mean (average) of numeric values since the last known value | anomaly | This check detects that the mean (average) of numeric values has changed more than max_percent from the last measured mean. | |
| mean_change_1_day | Maximum relative change in the mean (average) of numeric values vs 1 day ago | anomaly | This check detects that the mean (average) of numeric values has changed more than max_percent from the mean value measured one day ago (yesterday). | |
| mean_change_7_days | Maximum relative change in the mean (average) of numeric values vs 7 days ago | anomaly | This check detects that the mean (average) value of numeric values has changed more than max_percent from the mean value measured seven days ago. This check aims to overcome a weekly seasonability and compare Mondays to Mondays, Tuesdays to Tuesdays, etc. | |
| mean_change_30_days | Maximum relative change in the mean (average) of numeric values vs 30 days ago | anomaly | This check detects that the mean (average) of numeric values has changed more than max_percent from the mean value measured thirty days ago. This check aims to overcome a monthly seasonability and compare a value to a similar value a month ago. | |
| median_change | Maximum relative change in the median of numeric values since the last known value | anomaly | This check detects that the median of numeric values has changed more than max_percent from the last measured median. | |
| median_change_1_day | Maximum relative change in the median of numeric values vs 1 day ago | anomaly | This check detects that the median of numeric values has changed more than max_percent from the median value measured one day ago (yesterday). | |
| median_change_7_days | Maximum relative change in the median of numeric values vs 7 days ago | anomaly | This check detects that the median of numeric values has changed more than max_percent from the median value measured seven days ago. This check aims to overcome a weekly seasonability and compare Mondays to Mondays, Tuesdays to Tuesdays, etc. | |
| median_change_30_days | Maximum relative change in the median of numeric values vs 30 days ago | anomaly | This check detects that the median of numeric values has changed more than max_percent from the median value measured thirty days ago. This check aims to overcome a monthly seasonability and compare a value to a similar value a month ago. | |
| sum_change | Maximum relative change in the sum of numeric values since the last known value | anomaly | This check detects that the sum of numeric values has changed more than max_percent from the last measured sum. | |
| sum_change_1_day | Maximum relative change in the sum of numeric values vs 1 day ago | anomaly | This check detects that the sum of numeric values has changed more than max_percent from the sum measured one day ago (yesterday). | |
| sum_change_7_days | Maximum relative change in the sum of numeric values vs 7 days ago | anomaly | This check detects that the sum of numeric values has changed more than max_percent from the sum measured seven days ago. This check aims to overcome a weekly seasonability and compare Mondays to Mondays, Tuesdays to Tuesdays, etc. | |
| sum_change_30_days | Maximum relative change in the sum of numeric values vs 30 days ago | anomaly | This check detects that the sum of numeric values has changed more than max_percent from the sum measured thirty days ago. This check aims to overcome a monthly seasonability and compare a value to a similar value a month ago. | |
| detected_datatype_in_text | Detect and verify the data type of all values in a text column | datatype | A column-level check that scans all values in a text column and detects the data type of all values in a monitored column. The actual_value returned from the sensor can be one of seven codes: 1 - integers, 2 - floats, 3 - dates, 4 - datetimes, 5 - timestamps, 6 - booleans, 7 - strings, 8 - mixed data types. The check compares the data type detected in all non-null columns to an expected data type. The rule compares the value using equals and requires values in the range 1..8, which are the codes of detected data types. | |
| detected_datatype_in_text_changed | Detect a change of the data type of all values in a text column | datatype | A column-level check that scans all values in a text column, finds the right data type and detects when the desired data type changes. The actual_value returned from the sensor can be one of seven codes: 1 - integers, 2 - floats, 3 - dates, 4 - datetimes, 5 - timestamps, 6 - booleans, 7 - strings, 8 - mixed data types. The check compares the data type detected during the current run to the last known data type detected during a previous run. For daily monitoring checks, it compares the value to yesterday's value (or an earlier date). For partitioned checks, it compares the current data type to the data type in the previous daily or monthly partition. The last partition with data is used for comparison. | |
| column_type_changed | Verify if the column data type has changed | schema | A column-level check that detects if the data type of the column has changed since the last retrieval. This check calculates the hash of all the components of the column's data type: the data type name, length, scale, precision and nullability. A data quality issue will be detected if the hash of the column's data types has changed. | |
| distinct_count_anomaly | Abnormal change in the number of distinct values. Measured as a percentile of anomalous measures. | uniqueness | This check monitors the count of distinct values and detects anomalies in the changes of the distinct count. It monitors a 90-day time window. The check is configured by setting a desired percentage of anomalies to identify as data quality issues. | |
| distinct_percent_anomaly | Abnormal change in the percentage of distinct values. Measured as a percentile of anomalous measures. | uniqueness | This check monitors the percentage of distinct values and detects anomalies in the changes in this percentage. It monitors a 90-day time window. The check is configured by setting a desired percentage of anomalies to identify as data quality issues. | |
| distinct_count_change | Maximum relative change in the count of distinct values since the last known value | uniqueness | This check monitors the count of distinct values and compares it to the last known value. It raises a data quality issue when the change exceeds an accepted threshold. | |
| distinct_count_change_1_day | Maximum relative change in the count of distinct values vs 1 day ago | uniqueness | This check monitors the count of distinct values and compares it to the measure from the previous day. It raises a data quality issue when the change exceeds an accepted threshold. | |
| distinct_count_change_7_days | Maximum relative change in the count of distinct values vs 7 days ago | uniqueness | This check monitors the count of distinct values and compares it to the measure seven days ago to overcome the weekly seasonability impact. It raises a data quality issue when the change exceeds an accepted threshold. | |
| distinct_count_change_30_days | Maximum relative change in the count of distinct values vs 30 days ago | uniqueness | This check monitors the count of distinct values and compares it to the measure thirty days ago to overcome the monthly seasonability impact. It raises a data quality issue when the change exceeds an accepted threshold. | |
| distinct_percent_change | Maximum relative change in the percentage of distinct values since the last known value | uniqueness | This check monitors the percentage of distinct values and compares it to the last known value. It raises a data quality issue when the change exceeds an accepted threshold. | |
| distinct_percent_change_1_day | Maximum relative change in the percentage of distinct values vs 1 day ago | uniqueness | This check monitors the percentage of distinct values and compares it to the measure from the previous day. It raises a data quality issue when the change exceeds an accepted threshold. | |
| distinct_percent_change_7_days | Maximum relative change in the percentage of distinct values vs 7 days sago | uniqueness | This check monitors the percentage of distinct values and compares it to the measure seven days ago to overcome the weekly seasonability impact. It raises a data quality issue when the change exceeds an accepted threshold. | |
| distinct_percent_change_30_days | Maximum relative change in the percentage of distinct values vs 30 days ago | uniqueness | This check monitors the percentage of distinct values and compares it to the measure thirty days ago to overcome the monthly seasonability impact. It raises a data quality issue when the change exceeds an accepted threshold. | |
| text_surrounded_by_whitespace_found | Maximum count of text surrounded by whitespace characters | whitespace | This check detects text values that contain additional whitespace characters before or after the text. This check counts text values surrounded by whitespace characters (on any side) and raises a data quality issue when their count exceeds a max_count parameter value. Whitespace-surrounded texts should be trimmed before loading to another table. | |
| text_surrounded_by_whitespace_percent | Maximum percentage of text surrounded by whitespace characters | whitespace | This check detects text values that contain additional whitespace characters before or after the text. This check measures the percentage of text value surrounded by whitespace characters (on any side) and raises a data quality issue when their rate exceeds a max_percent parameter value. |
Data Integrity
Data integrity definition
The following table provides an overview of the integrity data quality dimension.
| Dimension | Description | How DQOps measures data integrity |
|---|---|---|
| Integrity | The data integrity dimension ensures that relational data is structurally valid and no keys are missing. | Traditional OLTP databases such as Oracle or SQL Server can enforce data integrity with foreign key constraints. This simple and reliable method is unavailable for non-transactional data platforms, such as data lakes that store data in S3 or similar buckets. DQOps measures data integrity by running value lookup joins that join the tested table and a reference table using a left outer join to identify missing records that do not match the key. |
Column integrity checks
The following table lists data quality checks that detect integrity issues on columns.
| Data quality check name | Friendly name | Check category | Description | Standard check |
|---|---|---|---|---|
| lookup_key_not_found | Maximum count of rows containing values not found in a reference table (foreign key lookup) | integrity | This check detects invalid values that are not present in a dictionary table. The lookup uses an outer join query within the same database. This check counts the number of values not found in the dictionary table. It raises a data quality issue when too many missing keys are discovered. | |
| lookup_key_found_percent | Minimum percentage of rows containing values not found in a reference table (foreign key lookup) | integrity | This check detects invalid values that are not present in a dictionary table. The lookup uses an outer join query within the same database. This check measures the percentage of valid keys found in the dictionary table. It raises a data quality issue when a percentage of valid keys is below a minimum accepted threshold. |
Data Reasonableness
Data reasonableness definition
The following table provides an overview of the reasonableness data quality dimension.
| Dimension | Description | How DQOps measures data reasonableness |
|---|---|---|
| Reasonableness | The data reasonableness dimension verifies if the data makes sense and the values are within reasonable ranges. | DQOps uses data quality range checks to assess the reasonableness of data. For example, you can validate that the prices in the product table are within reasonable ranges. You can validate the length of text fields or aggregated values such as a sum, mean, median, or percentile. |
Table reasonableness checks
The following table lists data quality checks that detect reasonableness issues on tables.
| Data quality check name | Friendly name | Check category | Description | Standard check |
|---|---|---|---|---|
| sql_aggregate_expression_on_table | Custom aggregated SQL expression within range | custom_sql | A table-level check that calculates a given SQL aggregate expression on a table and verifies if the value is within a range of accepted values. |
Column reasonableness checks
The following table lists data quality checks that detect reasonableness issues on columns.
| Data quality check name | Friendly name | Check category | Description | Standard check |
|---|---|---|---|---|
| expected_text_values_in_use_count | Maximum number of expected text values that are not in use | accepted_values | A column-level check that counts unique values in a text column and counts how many values out of a list of expected string values were found in the column. The check raises a data quality issue when the threshold for the maximum number of missing has been exceeded (too many expected values were not found in the column). This check is useful for analysing columns with a low number of unique values, such as status codes, to detect whether all status codes are used in any row. | |
| expected_texts_in_top_values_count | Verify that the most popular text values match the list of expected values | accepted_values | A column-level check that counts how many expected text values are among the TOP most popular values in the column. The check will first count the number of occurrences of each column's value and will pick the TOP X most popular values (configurable by the 'top' parameter). Then, it will compare the list of most popular values to the given list of expected values that should be most popular. This check will verify how many supposed most popular values (provided in the 'expected_values' list) were not found in the top X most popular values in the column. This check is helpful in analyzing string columns with frequently occurring values, such as country codes for countries with the most customers. | |
| expected_numbers_in_use_count | Maximum number of expected numeric values that are not in use | accepted_values | A column-level check that counts unique values in a numeric column and counts how many values out of a list of expected numeric values were found in the column. The check raises a data quality issue when the threshold for the maximum number of missing has been exceeded (too many expected values were not found in the column). This check is useful for analysing columns with a low number of unique values, such as status codes, to detect whether all status codes are used in any row. | |
| true_percent | Percentage of true values in bool column | bool | This check measures the percentage of true values in a boolean column. It raises a data quality issue when the measured percentage is outside the accepted range. | |
| false_percent | Percentage of false values in bool column | bool | This check measures the percentage of false values in a boolean column. It raises a data quality issue when the measured percentage is outside the accepted range. | |
| sql_aggregate_expression_on_column | Custom aggregated SQL expression within range | custom_sql | A column-level check that calculates a given SQL aggregate expression on a column and verifies if the value is within a range of accepted values. | |
| number_in_range_percent | Maximum percentage of rows containing numeric values in the range | numeric | This check verifies that values in a numeric column are within an accepted range. It measures the percentage of values within the valid range and raises a data quality issue when the rate of valid values is below a minimum accepted percentage. | |
| integer_in_range_percent | Maximum percentage of rows containing integer values in the range | numeric | This check verifies that numeric values are within a range of accepted values. It measures the percentage of values in the range and raises a data quality issue when the percentage of valid values is below an accepted rate. | |
| min_in_range | Minimum numeric value is in the range | numeric | This check finds a minimum value in a numeric column. It verifies that the minimum value is within the range of accepted values and raises a data quality issue when it is not within a valid range. | |
| max_in_range | Maximum numeric value is in the range | numeric | This check finds a maximum value in a numeric column. It verifies that the maximum value is within the range of accepted values and raises a data quality issue when it is not within a valid range. | |
| sum_in_range | Sum of numeric values is in the range | numeric | This check calculates a sum of numeric values. It verifies that the sum is within the range of accepted values and raises a data quality issue when it is not within a valid range. | |
| mean_in_range | Mean (average) of numeric values is in the range | numeric | This check calculates a mean (average) value in a numeric column. It verifies that the average value is within the range of accepted values and raises a data quality issue when it is not within a valid range. | |
| median_in_range | Median of numeric values is in the range | numeric | This check finds a median value in a numeric column. It verifies that the median value is within the range of accepted values and raises a data quality issue when it is not within a valid range. | |
| percentile_in_range | The selected percentile of numeric values is in the range | numeric | This check finds a requested percentile value of numeric values. The percentile is configured as a value in the range [0, 1]. This check verifies that the given percentile is within the range of accepted values and raises a data quality issue when it is not within a valid range. | |
| percentile_10_in_range | The selected 10th percentile of numeric values is in the range | numeric | This check finds the 10th percentile value in a numeric column. The 10th percentile is a value greater than 10% of the smallest values and smaller than the remaining 90% of other values. This check verifies that the 10th percentile is within the range of accepted values and raises a data quality issue when it is not within a valid range. | |
| percentile_25_in_range | The selected 25th percentile of numeric values is in the range | numeric | This check finds the 25th percentile value in a numeric column. The 10th percentile is a value greater than 25% of the smallest values and smaller than the remaining 75% of other values. This check verifies that the 25th percentile is within the range of accepted values and raises a data quality issue when it is not within a valid range. | |
| percentile_75_in_range | The selected 75th percentile of numeric values is in the range | numeric | This check finds the 75th percentile value in a numeric column. The 75th percentile is a value greater than 75% of the smallest values and smaller than the remaining 25% of other values. This check verifies that the 75th percentile is within the range of accepted values and raises a data quality issue when it is not within a valid range. | |
| percentile_90_in_range | The selected 90th percentile of numeric values is in the range | numeric | This check finds the 90th percentile value in a numeric column. The 90th percentile is a value greater than 90% of the smallest values and smaller than the remaining 10% of other values. This check verifies that the 90th percentile is within the range of accepted values and raises a data quality issue when it is not within a valid range. | |
| sample_stddev_in_range | Standard deviation of numeric values is in the range | numeric | This check calculates the standard deviation of numeric values. It verifies that the standard deviation is within the range of accepted values and raises a data quality issue when it is not within a valid range. | |
| population_stddev_in_range | Population standard deviation of numeric values is in the range | numeric | This check calculates the population standard deviation of numeric values. It verifies that the population standard deviation is within the range of accepted values and raises a data quality issue when it is not within a valid range. | |
| sample_variance_in_range | Variance of numeric values is in the range | numeric | This check calculates a sample variance of numeric values. It verifies that the sample variance is within the range of accepted values and raises a data quality issue when it is not within a valid range. | |
| population_variance_in_range | Population variance of numeric values is in the range | numeric | This check calculates a population variance of numeric values. It verifies that the population variance is within the range of accepted values and raises a data quality issue when it is not within a valid range.o | |
| text_min_length | Verify that the minimum length of the text column is in the range | text | This check finds the length of the shortest text in a column. DQOps validates the shortest length using a range rule. DQOps raises an issue when the minimum text length is outside a range of accepted values. | |
| text_max_length | Verify that the maximum length of the text is in the range | text | This check finds the length of the longest text in a column. DQOps validates the maximum length using a range rule. DQOps raises an issue when the maximum text length is outside a range of accepted values. | |
| text_mean_length | Verify that the mean length of the text is in the range | text | This check calculates the average text length in a column. DQOps validates the mean length using a range rule. DQOps raises an issue when the mean text length is outside a range of accepted values. | |
| text_length_below_min_length | Find text values shorter than the minimum accepted length | text | This check finds texts that are shorter than the minimum accepted text length. It counts the number of texts that are too short and raises a data quality issue when too many invalid texts are found. | |
| text_length_below_min_length_percent | Measure the percentage of rows containing text values shorter than the minimum accepted length | text | This check finds texts that are shorter than the minimum accepted text length. It measures the percentage of too short texts and raises a data quality issue when too many invalid texts are found. | |
| text_length_above_max_length | Find text values longer than the maximum accepted length | text | This check finds texts that are longer than the maximum accepted text length. It counts the number of texts that are too long and raises a data quality issue when too many invalid texts are found. | |
| text_length_above_max_length_percent | Measure the percentage of rows containing text values longer than the maximum accepted length | text | This check finds texts that are longer than the maximum accepted text length. It measures the percentage of texts that are too long and raises a data quality issue when too many invalid texts are found. | |
| text_length_in_range_percent | Measure the percentage of rows containing text values in the expected range | text | This check verifies that the minimum and maximum lengths of text values are in the range of accepted values. It measures the percentage of texts with a valid length and raises a data quality issue when an insufficient number of texts have a valid length. | |
| min_word_count | Verify that the minimum word count of the text column is in the range | text | This check finds the lowest count of words in text in a column. DQOps validates the shortest length using a range rule. DQOps raises an issue when the minimum word count is outside a range of accepted values. | |
| max_word_count | Verify that the maximum word count of the text is in the range | text | This check finds the highest count of words in text in a column. DQOps validates the maximum length using a range rule. DQOps raises an issue when the maximum word count is outside a range of accepted values. |
Data Timeliness
Data timeliness definition
The following table provides an overview of the timeliness data quality dimension.
| Dimension | Description | How DQOps measures data timeliness |
|---|---|---|
| Timeliness | The data timeliness dimension verifies if the data source contains fresh data and if the data processing lag is acceptable. | DQOps captures the most recent timestamps from the monitored table and measures the time between now and the timestamp of the most recent record. The data timeliness dimension is divided into: - data freshness tracks how old the data is - data staleness tracks when the data was loaded for the last time - ingestion delay measures the time between the most recent record and the time when it was loaded, showing the time consumed by data processing. Check out the data timeliness formula to see how they differ. |
Table timeliness checks
The following table lists data quality checks that detect timeliness issues on tables.
| Data quality check name | Friendly name | Check category | Description | Standard check |
|---|---|---|---|---|
| data_freshness | Data freshness (Maximum age of the most recent row) | timeliness | A table-level check that calculates the time difference between the most recent row in the table and the current time. The timestamp column that is used for comparison is defined as the timestamp_columns.event_timestamp_column on the table configuration. This check is also known as "Data Freshness". | |
| data_freshness_anomaly | Data freshness anomaly (Abnormal delay in data delivery) | timeliness | This check calculates the most recent rows value and the current time and detects anomalies in a time series of previous averages. The timestamp column that is used for comparison is defined as the timestamp_columns.event_timestamp_column on the table configuration. It raises a data quality issue when the mean is in the top anomaly_percent percentage of the most outstanding values in the time series. This data quality check uses a 90-day time window and requires a history of at least 30 days. | |
| data_staleness | Data staleness (Maximum number of days since the recent ingestion) | timeliness | A table-level check that calculates the time difference between the last timestamp when any data was loaded into a table and the current time. This check can only be use when a data pipeline, ETL process, or trigger in the data warehouse is filling an extra column with the timestamp when the data loading job was loaded. The ingestion column used for comparison is defined as the timestamp_columns.ingestion_timestamp_column on the table configuration. This check is also known as "Data Staleness". | |
| data_ingestion_delay | Data ingestion delay (Maximum number of days between the last record has been created and loaded) | timeliness | A table-level check that calculates the time difference between the most recent row in the table and the most recent timestamp when the last row was loaded into the data warehouse or data lake. To identify the most recent row, the check finds the maximum value of the timestamp column that should contain the last modification timestamp from the source. The timestamp when the row was loaded is identified by the most recent (maximum) value a timestamp column that was filled by the data pipeline, for example: "loaded_at", "updated_at", etc. This check requires that the data pipeline is filling an extra column with the timestamp when the data loading job has been executed. The names of both columns used for comparison should be specified in the "timestamp_columns" configuration entry on the table. | |
| reload_lag | Reload lag (Maximum delay to load the last record for each partition) | timeliness | A table-level check that calculates the maximum difference in days between ingestion timestamp and event timestamp values on any row. This check should be executed only as a partitioned check because this check finds the longest delay between the time that the row was created in the data source and the timestamp when the row was loaded into its daily or monthly partition. This check detects that a daily or monthly partition was reloaded, setting also the most recent timestamps in the created_at, loaded_at, inserted_at or other similar columns filled by the data pipeline or an ETL process during data loading. |
Data Uniqueness
Data uniqueness definition
The following table provides an overview of the uniqueness data quality dimension.
| Dimension | Description | How DQOps measures data uniqueness |
|---|---|---|
| Uniqueness | The data uniqueness dimension verifies that no records are duplicate in the dataset. | DQOps measures the number and the percentage of distinct and duplicate values in a column. |
Table uniqueness checks
The following table lists data quality checks that detect uniqueness issues on tables.
| Data quality check name | Friendly name | Check category | Description | Standard check |
|---|---|---|---|---|
| duplicate_record_count | Maximum count of duplicate records | uniqueness | This check counts duplicate records values. It raises a data quality issue when the number of duplicates is above a minimum accepted value. The default configuration detects duplicate rows by enforcing that the min_count of duplicates is zero. | |
| duplicate_record_percent | Maximum percentage of duplicate records | uniqueness | This check measures the percentage of duplicate records values. It raises a data quality issue when the percentage of duplicates is above a minimum accepted value. The default threshold is 0% duplicate values. |
Column uniqueness checks
The following table lists data quality checks that detect uniqueness issues on columns.
| Data quality check name | Friendly name | Check category | Description | Standard check |
|---|---|---|---|---|
| distinct_count | Verify that the count of distinct values is in the expected range | uniqueness | This check counts distinct values and verifies if the distinct count is within an accepted range. It raises a data quality issue when the distinct count is below or above the accepted range. | |
| distinct_percent | The minimum ratio of distinct values to the count of non null values (detect duplicate values) | uniqueness | This check measures the percentage of distinct values in all non-null values. It verifies that the percentage of distinct values meets a minimum and maximum values. The default value of 100% distinct values ensures the column has no duplicate values. | |
| duplicate_count | Maximum count of duplicate values | uniqueness | This check counts duplicate values. It raises a data quality issue when the number of duplicates is above a minimum accepted value. The default configuration detects duplicate values by enforcing that the min_count of duplicates is zero. | |
| duplicate_percent | Maximum percentage of duplicate values | uniqueness | This check measures the percentage of duplicate values in all non-null values. It raises a data quality issue when the percentage of duplicates is above an accepted threshold. The default threshold is 0% duplicate values. |
Data Validity
Data validity definition
The following table provides an overview of the validity data quality dimension.
| Dimension | Description | How DQOps measures data validity |
|---|---|---|
| Validity | The data validity dimension verifies that the values conform to agreed data formats and low cardinality columns (columns containing only known values) store only values from an accepted data dictionary. | DQOps uses regular expressions to validate values that should match a pattern, such as an email or a phone number. Columns that should contain only values from a data dictionary use an IN SQL condition. DQOps provides several built-in dictionaries, such as country and currency codes. The other dictionaries can be uploaded as a CSV file. |
Table validity checks
The following table lists data quality checks that detect validity issues on tables.
| Data quality check name | Friendly name | Check category | Description | Standard check |
|---|---|---|---|---|
| sql_condition_failed_on_table | Maximum count of rows that failed SQL conditions | custom_sql | A table-level check that uses a custom SQL expression on each row to verify (assert) that all rows pass a custom condition defined as an SQL condition. Use the {alias} token to reference the tested table. This data quality check can be used to compare columns on the same table. For example, the condition can verify that the value in the col_price column is higher than the col_tax column using an SQL expression: `{alias}.col_price > {alias}.col_tax`. Use an SQL expression that returns a true value for valid values and a false one for invalid values, because it is an assertion. | |
| sql_condition_passed_percent_on_table | Minimum percentage of rows that passed SQL condition | custom_sql | A table-level check that ensures that a minimum percentage of rows passed a custom SQL condition (expression). Measures the percentage of rows passing the condition. Raises a data quality issue when the percent of valid rows is below the min_percent parameter. | |
| sql_invalid_record_count_on_table | Custom SELECT SQL that returns invalid records | custom_sql | A table-level check that uses a custom SQL query that return invalid values from column. Use the {table} token to reference the tested table. This data quality check can be used to compare columns on the same table. For example, when this check is applied on a age column, the condition can find invalid records in which the age is lower than 18 using an SQL query: `SELECT age FROM {table} WHERE age < 18`. | |
| import_custom_result_on_table | Import custom data quality results on table | custom_sql | A table-level check that uses a custom SQL SELECT statement to retrieve a result of running a custom data quality check that was hardcoded in the data pipeline, and the result was stored in a separate table. The SQL query that is configured in this external data quality results importer must be a complete SELECT statement that queries a dedicated table (created by the data engineers) that stores the results of custom data quality checks. The SQL query must return a severity column with values: 0 - data quality check passed, 1 - warning issue, 2 - error severity issue, 3 - fatal severity issue. |
Column validity checks
The following table lists data quality checks that detect validity issues on columns.
| Data quality check name | Friendly name | Check category | Description | Standard check |
|---|---|---|---|---|
| text_found_in_set_percent | Minimum percentage of rows having text values outside the list of expected values | accepted_values | A column-level check that calculates the percentage of rows for which the tested text column contains a value from a set of expected values. Columns with null values are also counted as a passing value (the sensor assumes that a 'null' is also an expected and accepted value). The check raises a data quality issue when the percentage of rows with a not null column value that is not expected (not one of the values in the expected_values set) is below the expected threshold. For example, 99% of rows should have values from the defined domain. This data quality check is useful for checking text columns that have a small number of unique values, and all the values should come from a set of expected values. For example, testing country, state, currency, gender, type, and department columns whose expected values are known. | |
| number_found_in_set_percent | Minimum percentage of rows having numeric values outside the list of expected values | accepted_values | A column-level check that calculates the percentage of rows for which the tested numeric column contains a value from a set of expected values. Columns with null values are also counted as a passing value (the sensor assumes that a 'null' is also an expected and accepted value). The check raises a data quality issue when the percentage of rows with a not null column value that is not expected (not one of the values in the expected_values set) is below the expected threshold. For example, 99% of rows should have values from the defined domain. This data quality check is useful for checking numeric columns that store numeric codes (such as status codes) to see if the only values found in the column are from the set of expected values. | |
| text_valid_country_code_percent | Minimum percentage of rows containing valid country codes | accepted_values | This check measures the percentage of text values that are valid two-letter country codes. It raises a data quality issue when the percentage of valid country codes (excluding null values) falls below a minimum accepted rate. | |
| text_valid_currency_code_percent | Minimum percentage of rows containing valid currency codes | accepted_values | This check measures the percentage of text values that are valid currency names. It raises a data quality issue when the percentage of valid currency names (excluding null values) falls below a minimum accepted rate. | |
| text_parsable_to_boolean_percent | Minimum percentage of rows containing a text parsable to a boolean value | conversions | Verifies that values in a text column are convertible to a boolean value. Texts are convertible to a boolean value when they are one of the well-known boolean placeholders: '0', '1', 'true', 'false', 'yes', 'no', 'y', 'n'. This check measures the percentage of valid values and raises a data quality issue when the percentage of valid values is below an accepted rate. | |
| text_parsable_to_integer_percent | Minimum percentage of rows containing a text parsable to integer | conversions | Verifies that values in a text column can be parsed and converted to an integer type. This check measures the percentage of valid values and raises a data quality issue when the percentage of valid values is below an accepted rate. | |
| text_parsable_to_float_percent | Minimum percentage of rows containing a text parsable to float | conversions | Verifies that values in a text column can be parsed and converted to a float (or numeric) type. This check measures the percentage of valid values and raises a data quality issue when the percentage of valid values is below an accepted rate. | |
| text_parsable_to_date_percent | Minimum percentage of rows containing a text parsable to date | conversions | Verifies that values in a text column can be parsed and converted to a date type. This check measures the percentage of valid values and raises a data quality issue when the percentage of valid values is below an accepted rate. | |
| sql_condition_failed_on_column | Maximum count of rows that failed SQL conditions | custom_sql | A column-level check that uses a custom SQL expression on each column to verify (assert) that all rows pass a custom condition defined as an SQL expression. Use the {alias} token to reference the tested table, and the {column} to reference the column that is tested. This data quality check can be used to compare columns on the same table. For example, when this check is applied on a col_price column, the condition can verify that the col_price is higher than the col_tax using an SQL expression: `{alias}.{column} > {alias}.col_tax` Use an SQL expression that returns a true value for valid values and false for invalid values, because it is an assertion. | |
| sql_condition_passed_percent_on_column | Minimum percentage of rows that passed SQL condition | custom_sql | A table-level check that ensures that a minimum percentage of rows passed a custom SQL condition (expression). Measures the percentage of rows passing the condition. Raises a data quality issue when the percent of valid rows is below the min_percent parameter. | |
| sql_invalid_value_count_on_column | Custom SELECT SQL that returns invalid values | custom_sql | A column-level check that uses a custom SQL query that return invalid values from column. This check is used for setting testing queries or ready queries used by users in their own systems (legacy SQL queries). Use the {table} token to reference the tested table, and the {column} to reference the column that is tested. For example, when this check is applied on a column. The condition can find invalid values in the column which have values lower than 18 using an SQL query: `SELECT {column} FROM {table} WHERE {column} < 18`. | |
| import_custom_result_on_column | Import custom data quality results on column | custom_sql | Column level check that uses a custom SQL SELECT statement to retrieve a result of running a custom data quality check on a column by a custom data quality check, hardcoded in the data pipeline. The result is retrieved by querying a separate logging table, whose schema is not fixed. The logging table should have columns that identify a table and a column for which they store custom data quality check results, and a severity column of the data quality issue. The SQL query that is configured in this external data quality results importer must be a complete SELECT statement that queries a dedicated logging table, created by the data engineering team. | |
| date_values_in_future_percent | Maximum percentage of rows containing dates in future | datetime | Detects dates in the future in date, datetime and timestamp columns. Measures a percentage of dates in the future. Raises a data quality issue when too many future dates are found. | |
| date_in_range_percent | Minimum percentage of rows containing dates within an expected range | datetime | Verifies that the dates in date, datetime, or timestamp columns are within a reasonable range of dates. The default configuration detects fake dates such as 1900-01-01 and 2099-12-31. Measures the percentage of valid dates and raises a data quality issue when too many dates are found. | |
| text_match_date_format_percent | Minimum percentage of rows containing text values that match a date format | datetime | Verifies that the values in text columns match one of the predefined date formats, such as an ISO 8601 date. Measures the percentage of valid date strings and raises a data quality issue when too many invalid date strings are found. | |
| number_below_min_value | Find invalid numeric values below an expected minimum value | numeric | This check finds numeric values smaller than the minimum accepted value. It counts the values that are too small. This check raises a data quality issue when the count of too small values exceeds the maximum accepted count. | |
| number_above_max_value | Find invalid numeric values above an expected maximum value | numeric | This check finds numeric values bigger than the maximum accepted value. It counts the values that are too big. This check raises a data quality issue when the count of too big values exceeds the maximum accepted count. | |
| negative_values | Maximum count of negative values | numeric | This check finds and counts negative values in a numeric column. It raises a data quality issue when the count of negative values is above the maximum accepted count. | |
| negative_values_percent | Maximum percentage of negative values | numeric | This check finds negative values in a numeric column. It measures the percentage of negative values and raises a data quality issue when the rate of negative values exceeds the maximum accepted percentage. | |
| number_below_min_value_percent | Maximum percentage of numeric values below the minimum value | numeric | This check finds numeric values smaller than the minimum accepted value. It measures the percentage of values that are too small. This check raises a data quality issue when the percentage of values that are too small exceeds the maximum accepted percentage. | |
| number_above_max_value_percent | Maximum percentage of numeric values above the maximum value | numeric | This check finds numeric values bigger than the maximum accepted value. It measures the percentage of values that are too big. This check raises a data quality issue when the percentage of values that are too big exceeds the maximum accepted percentage. | |
| invalid_latitude | Maximum count of rows containing invalid latitude values | numeric | This check finds numeric values that are not valid latitude coordinates. A valid latitude coordinate is in the range -90...90. It counts the values outside a valid range for a latitude. This check raises a data quality issue when the count of invalid values exceeds the maximum accepted count. | |
| valid_latitude_percent | Minimum percentage of rows containing valid latitude values | numeric | This check verifies that numeric values are valid latitude coordinates. A valid latitude coordinate is in the range -90...90. It measures the percentage of values within a valid range for a latitude. This check raises a data quality issue when the rate of valid values is below the minimum accepted percentage. | |
| invalid_longitude | Maximum count of rows containing invalid longitude values | numeric | This check finds numeric values that are not valid longitude coordinates. A valid longitude coordinate is in the range -180...180. It counts the values outside a valid range for a longitude. This check raises a data quality issue when the count of invalid values exceeds the maximum accepted count. | |
| valid_longitude_percent | Minimum percentage of rows containing valid longitude values | numeric | This check verifies that numeric values are valid longitude coordinates. A valid longitude coordinate is in the range --180...180. It measures the percentage of values within a valid range for a longitude. This check raises a data quality issue when the rate of valid values is below the minimum accepted percentage. | |
| non_negative_values | Maximum count of rows containing non negative values | numeric | This check finds and counts non negative values in a numeric column. It raises a data quality issue when the count of non-negative values is above the maximum accepted count. | |
| non_negative_values_percent | Maximum percentage of rows containing non negative values | numeric | This check finds non-negative values in a numeric column. It measures the percentage of non-negative values and raises a data quality issue when the rate of non-negative values exceeds the maximum accepted percentage. | |
| text_not_matching_regex_found | Maximum count of rows containing texts values not matching regex | patterns | This check validates text values using a pattern defined as a regular expression. It counts the number of invalid values and raises a data quality issue when the number exceeds a threshold. | |
| texts_not_matching_regex_percent | Maximum percent of rows containing texts values not matching regex | patterns | This check validates text values using a pattern defined as a regular expression. It measures the percentage of invalid values and raises a data quality issue when the rate is above a threshold. | |
| invalid_email_format_found | Maximum count of rows containing emails in invalid format | patterns | This check detects invalid email addresses in text columns using a regular expression. It counts the number of invalid emails and raises a data quality issue when the number is above a threshold. | |
| invalid_email_format_percent | Minimum percent of rows containing emails in invalid format | patterns | This check detects invalid email addresses in text columns using a regular expression. It calculated the percentage of invalid emails and raises a data quality issue when the percentage is above a threshold. | |
| text_not_matching_date_pattern_found | Maximum count of rows containing texts not matching an expected date pattern | patterns | This check detects dates in the wrong format inside text columns using a regular expression. It counts the number of incorrectly formatted dates and raises a data quality issue when the number exceeds a threshold. | |
| text_not_matching_date_pattern_percent | Maximum percentage of rows containing texts not matching an expected date pattern | patterns | This check validates the date format of dates stored in text columns. It measures the percentage of incorrectly formatted dates and raises a data quality issue when the rate is above a threshold. | |
| text_not_matching_name_pattern_percent | Maximum percentage of rows not containing texts that are names (e.g. numeric) | patterns | This check verifies if values stored in a text column contain only letters and are usable as literal identifiers. It measures the percentage of invalid literal identifiers and raises a data quality issue when the rate is above a threshold. | |
| invalid_uuid_format_found | Maximum count of rows containing invalid UUID values | patterns | This check detects invalid UUID identifiers in text columns using a regular expression. It counts the number of invalid UUIDs and raises a data quality issue when the number is above a threshold. | |
| invalid_uuid_format_percent | Maximum percentage of rows containing invalid UUID values | patterns | This check validates the format of UUID values in text columns. It measures the percentage of invalid UUIDs and raises a data quality issue when the rate is above a threshold. | |
| invalid_ip4_address_format_found | Maximum count of rows containing invalid IP4 address values | patterns | This check detects invalid IP4 internet addresses in text columns using a regular expression. It counts the number of invalid addresses and raises a data quality issue when the number is above a threshold. | |
| invalid_ip6_address_format_found | Maximum count of rows containing invalid IP6 address values | patterns | This check detects invalid IP6 internet addresses in text columns using a regular expression. It counts the number of invalid addresses and raises a data quality issue when the number is above a threshold. | |
| invalid_usa_phone_format_found | Maximum count of rows containing invalid USA phone number values | patterns | This check validates the format of USA phone numbers inside text columns. It counts the number of invalid phone number and raises a data quality issue when too many rows contain phone numbers. | |
| invalid_usa_zipcode_format_found | Maximum count of rows containing invalid USA zip code values | patterns | This check validates the format of a USA zip code inside text columns. It counts the number of invalid zip code and raises a data quality issue when the rate is below a threshold. | |
| invalid_usa_phone_format_percent | Maximum percentage of rows containing invalid USA phone number values | patterns | This check validates the format of USA phone numbers inside text columns. It measures the percentage of columns containing invalid phone numbers and raises a data quality issue when the rate is above a threshold. | |
| invalid_usa_zipcode_format_percent | Maximum percentage of rows containing invalid USA zip code values | patterns | This check validates the format of a USA zip code inside text columns. It measures the percentage of columns containing invalid zip codes and raises a data quality issue when the rate is above a threshold. | |
| contains_usa_phone_percent | Detect USA phone numbers inside text columns | pii | This check detects USA phone numbers inside text columns. It measures the percentage of columns containing a phone number and raises a data quality issue when too many rows contain phone numbers. | |
| contains_email_percent | Detect emails inside text columns | pii | This check detects emails inside text columns. It measures the percentage of columns containing an email and raises a data quality issue when too many rows contain emails. | |
| contains_usa_zipcode_percent | Detect USA zip codes inside text columns | pii | This check detects USA zip code inside text columns. It measures the percentage of columns containing a zip code and raises a data quality issue when too many rows contain zip codes. | |
| contains_ip4_percent | Detect IP4 addresses inside text columns | pii | This check detects IP4 addresses inside text columns. It measures the percentage of columns containing an IP4 address and raises a data quality issue when too many rows contain IP4 addresses. | |
| contains_ip6_percent | Detect IP6 addresses inside text columns | pii | This check detects IP6 addresses inside text columns. It measures the percentage of columns containing an IP6 address and raises a data quality issue when too many rows contain IP6 addresses. |
FAQ
The following knowledgebase answers the most popular questions about data quality dimensions.
What are data quality dimensions?
Data quality dimensions are like a checklist for your data. They're a set of standards you use to see if your data is good enough to use. These dimensions include things like accuracy (is the data correct?), completeness (is any data missing?), consistency (is the same data stored the same way everywhere?), timeliness (is the data up-to-date?), and validity (does the data match the rules it should follow?). By checking your data against these dimensions, you can make sure it's reliable and useful for your needs.
What are data quality dimensions, with examples?
Data quality dimensions are standards like accuracy, completeness, and timeliness used to measure how good your data is. For example, completeness is measured by counting NULL values, timeliness by calculating the age of the data, and validity by checking if the values match patterns and ranges. DQOps provides a mapping of 150+ checks to dimensions, giving you a complete view of your data's health.
What are the 6 dimensions of data quality?
The 6 core dimensions of data quality are accuracy (data is correct), completeness (no data is missing), consistency (data is the same across all systems), timeliness (data is up-to-date), validity (data conforms to defined rules), and uniqueness (no duplicate data exists). These dimensions help ensure your data is reliable and usable.
Which dimension for measuring data quality means that the data conforms to a set of predefined standards and definitions such as type and format?
Validity is a data quality dimension that ensures data conforms to a set of predefined standards and definitions, such as data type, format, range, or business rules. For example, a valid email address must have an "@" symbol and a domain name, while a valid date must follow a specific format.
How to measure data quality?
Data quality is measured by testing your data with checks designed for each core dimension.
These checks might count invalid records (like how many email addresses are formatted incorrectly) or measure how many rules your data passes.
The results of these checks give you a data quality score, which tells you how healthy your data is overall.
What is data completeness?
Data completeness is a data quality dimension that measures if your dataset is complete. This means all required columns contain values, those values aren't empty (like blanks or NULLs), the dataset has a minimum acceptable size, and related fields are present (for example, if you have a "country" field, you should also have a "state" field for relevant entries).
What are data quality measures?
Data quality measures are metrics that quantify the quality of your data for different dimensions, like completeness and validity. They provide numeric scores (often expressed as percentages) that are easy to understand and communicate to others. These measures can be tracked over time, allowing you to quickly notice if the overall data quality is decreasing and identify potential issues.
How to measure data integrity?
Data integrity issues often pop up when you have related data in different tables. Imagine one table lists customer orders and another lists customer details. If an order references a customer that doesn't exist in the customer table, that's a data integrity problem. These problems are common in data lakes where the structure isn't as strict as in traditional databases. To catch these issues, you need special data quality checks that look for invalid references between tables.
What is data quality consistency?
Data quality consistency checks if different copies of similar datasets match in time. This is important because data is often stored in multiple places, and you need to make sure those copies are the same. Consistency is tested with data reconciliation checks, which compare data across different systems or time periods. Additionally, modern data observability platforms can detect anomalies – unexpected changes in data patterns – which are another type of consistency issue.
What are data quality parameters?
Data quality parameters are like settings that define what "good" data looks like for your needs. They're used to configure your expectations for data quality checks. There are two main types:
- Data quality rule parameters set overall expectations for your data, like a minimum row count or a maximum number of allowed errors.
- Data quality check parameters provide specific instructions for individual checks, like a list of valid country codes or a regular expression to validate email formats.
By using these parameters, you can fine-tune your data quality checks and ensure they're accurately measuring the health of your data.
What are the types of data quality checks?
Data quality check types provide a more detailed categorization of data quality checks than dimensions. They focus on specific data quality issues and the methods used to detect them. Some common types include:
- Pattern matching: Verifying data conforms to expected formats (e.g., email addresses, phone numbers).
- Null value checks: Counting the number of missing values in a dataset.
- Dataset comparison: Reconciling data between different sources or time periods.
- Value range checks: Ensuring data falls within acceptable boundaries.
DQOps provides detailed documentation for 21 distinct types of data quality checks, allowing you to address a wide range of potential data quality issues.
How to determine data quality?
You determine data quality by profiling your datasets and testing them with data quality checks. This process, called data quality assessment, helps you establish a data quality baseline, which is like an initial health check for your data.
What are data quality checks?
Data quality checks are tests that verify the health of your data. They make sure your dataset is error-free and meets your data quality requirements. For example, a healthy dataset should have no missing or incorrect values. These checks are usually run by data quality tools, which automate the process and provide detailed reports on your data's health.
What are examples of data quality consistency?
Data consistency ensures that different copies of similar datasets match. Data consistency is typically tested with data reconciliation checks, which compare data across different systems. Modern data observability platforms also support anomaly detection, which helps ensure data consistency over time by identifying unexpected changes or patterns.
What does the consistency dimension refer to when data quality is being measured?
The consistency dimension in data quality ensures that different copies of your data match. This means if you have the same data in multiple places, like a data warehouse and a data lake, they should be identical. It also means that data behaves consistently over time, without unexpected changes or anomalies. To test consistency, you can use data reconciliation to compare different copies of data and anomaly detection to identify unusual patterns in time series data.
How to ensure data quality dimensions measurement strategy management and governance?
Ensuring effective data quality dimension measurement requires a clear strategy and robust governance. This involves a few key steps:
-
Choose your dimensions: Determine which data quality dimensions are most critical for your needs. This might depend on the type of data you're working with and how it's being used.
-
Define your measurement method: Outline how you'll measure each dimension. This could involve using data quality tools, implementing data observability solutions, or a combination of approaches.
-
Establish data governance policies: Your data governance policies should clearly define which databases and dataset types must be measured for data quality compliance. This ensures consistency and accountability across your organization.
By combining a well-defined strategy with strong governance, you can ensure that your data quality measurement process is effective and sustainable.
What's more
- Review the types of data quality dashboards that are provided with DQOps.
- Learn how DQOps calculates data quality KPIs for data quality dimensions.