What is data validity?
Data validity is crucial for ensuring the quality of data. It guarantees that information is accurate, relevant, and properly formatted. Making good decisions depends on having reliable data.
In our previous blog post, “What is data validity and how to ensure it?” we discussed the significance of data validity, its importance, common issues, potential consequences, and methods for measuring and improving validity.
This post explains how to address a specific validity issue using the DQOps data quality platform. We will demonstrate how to validate text as dates. Incorrect date formats can lead to inaccurate results in dashboards that rely on date-based value grouping.
Table of Contents
The importance of consistent date formats
Have you ever struggled with inconsistent date formats in your landing zone tables? Text columns often hold raw data, and transforming them can be tricky. While parsing integers is straightforward, dates require extra attention.
Imagine a text column containing dates like “01/02/2024”. Is it February 1st or January 2nd? Relying solely on automatic detection can lead to errors. Different regions have different formatting preferences, causing confusion for the transformation engine. The key to data validity is enforcing a specific date format for all entries. This eliminates ambiguity and ensures accurate loading. Think of it like setting a common language for all your dates, preventing misinterpretations.
Date formatting standards
A popular choice for consistent date formatting is ISO 8601 (YYYY-MM-DD). This format clearly separates year, month, and day, avoiding confusion. By asserting that all dates in your text column follow this format, you guarantee accurate data transformation.
DQOps has a built-in data quality check text_match_date_format_percent. This check analyzes your text column and verifies whether all entries comply with your chosen date format (e.g., ISO 8601).
DQOps supports the following date formats:
- YYYY-MM-DD (e.g., 2023-12-31)
- DD/MM/YYYY (e.g., 31/12/2023)
- DD-MM-YYYY (e.g., 31-12-2024)
- DD.MM.YYYY (e.g., 31.12.2024)
Because all checks in DQOps are customizable, you can always add your own formats. Learn how you can create custom data quality checks in DQOps.
Profiling data
After connecting DQOps to your dataset, it is always recommended to collect basic statistics about your data. This information is valuable in deciding which data quality checks and threshold levels should be set to monitor data quality. With DQOps, this is very easy, as it has built-in statistics analysis.
Learn how to collect basic data statistics using the description in the document.
After collecting statistics, you can view its summary like the one below.
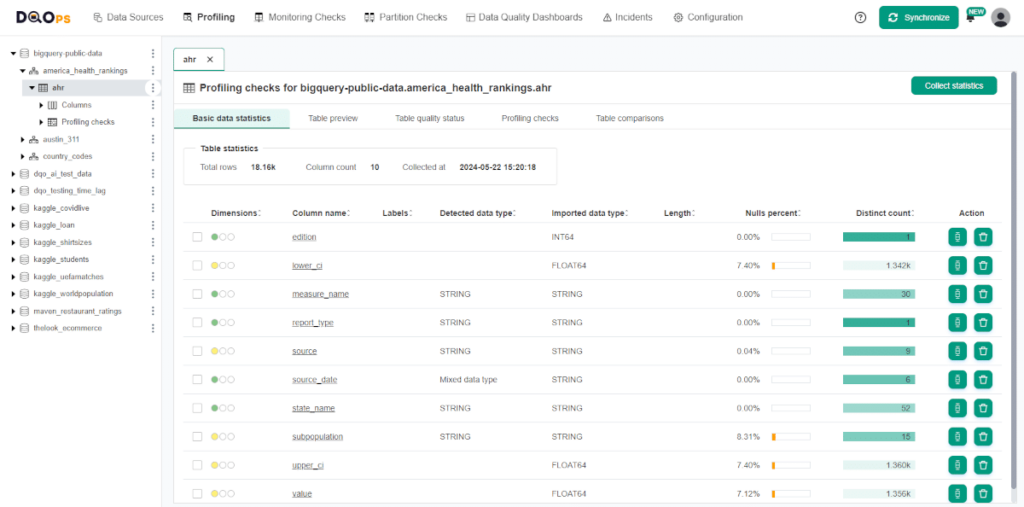
The basic statistics summary gives you a quick overview of your data. It shows the total number of rows and columns in the table, along with the date when the statistics were collected. For each column, it provides insights into data types (inferred and from the source), data length, minimum and maximum values, the presence of null values, and the number of distinct entries. The color-coded completeness, validity, and consistency circles offer a fast way to check the data quality for each column.
You can also check more detailed statistics by clicking on the column name.
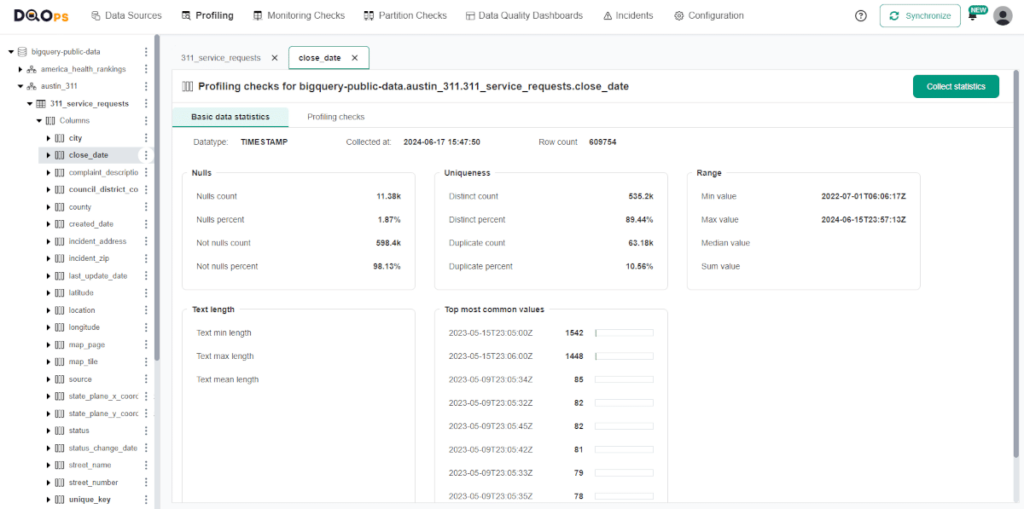
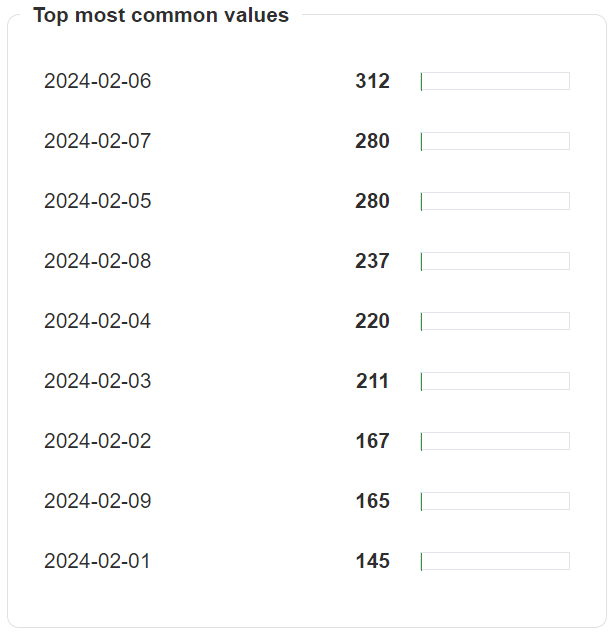
The detailed statistics screen provides a more in-depth look at the quality of individual column data. It includes a breakdown of null values (count and percentage), as well as distinct and duplicate values with their respective percentages. The range section covers the minimum, maximum, median, and sum for numeric data, while for string data types, it includes the minimum, maximum, and average length of the entries. Lastly, the detailed statistics screen displays the most common values within the column, offering valuable insights into the data distribution.
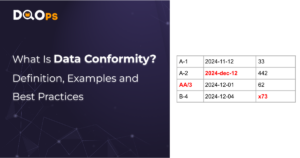
Let’s imagine a sample column with dates in string format, with the most common values shown below. In the next step, we will run checks to verify if the date format matches the YYYY-MM-DD format.
Running text_match_date_format_percent data quality check
To run the text_match_date_format_percent check in the DQOps platform, you can use either the user interface or Shell. To run the text_match_date_format_percent check from the user interface, simply navigate to the Monitoring checks section and select the column that contains dates in text format from the previously added connection.
Refer to our documentation to learn how to add a new connection and import tables.
After selecting the column of interest, a check editor will be displayed in the main workspace. The text_match_date_format_percent is located in the Date and time group.
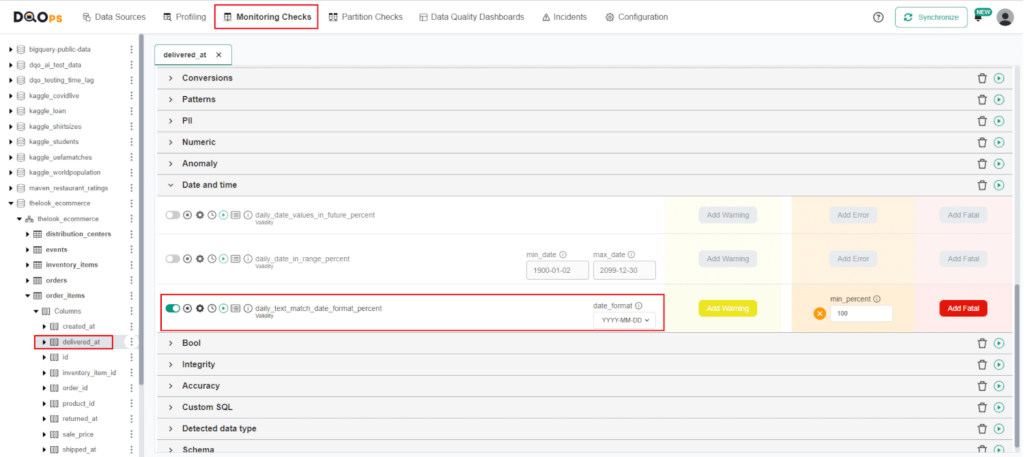
Toggle the enable switch to activate the check, then select the preferred date format from the dropdown menu. Next, set the minimum percentage of compliant entries (e.g., 100%). If the result of the check falls below the minimum percentage, an alert will be triggered. Run the check by clicking the green run button.
For a complete guide on how to run checks, refer to DQOPs documentation.
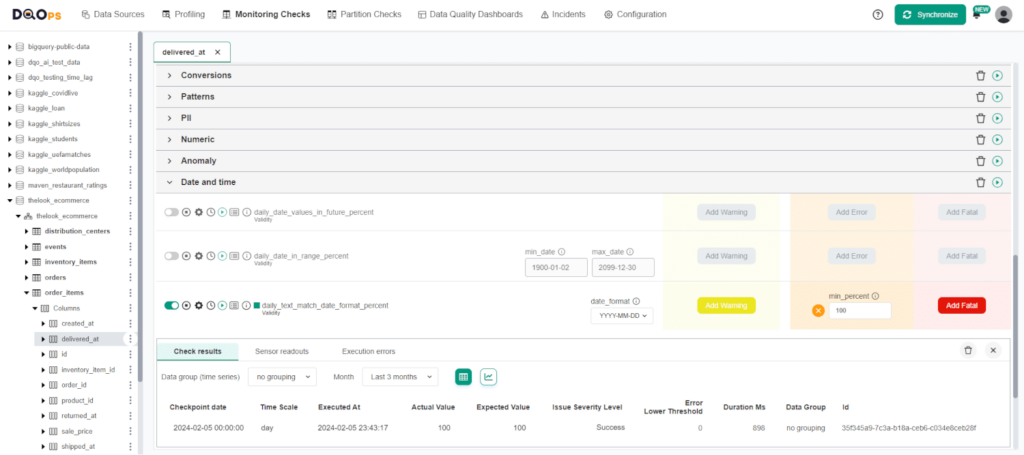
We can see that the check resulted in Valid result, indicated by the green square next to the check name. You can view the results by hovering over the green square, or access more detailed results by clicking on the Results icon. In our example, all the date values complied with the selected YYYY-MM-DD date format.
Data quality best practices - a step-by-step guide to improve data quality
- Learn the best practices in starting and scaling data quality
- Learn how to find and manage data quality issues
Summary
It is important to maintain consistent date formats in your data to avoid errors in analysis and misleading conclusions. By using a standardized format such as ISO 8601 (YYYY-MM-DD), you can ensure that your data is clear and unified. Remember, accurate and consistent data is crucial for trustworthy analysis and well-informed decision-making.
Make sure to review the DQOps documentation to discover additional checks that can help identify invalid dates.
Check out the DQOps getting started guide to learn how to configure data timeliness checks. DQOps is a comprehensive data quality platform that you can use to measure data quality right now.
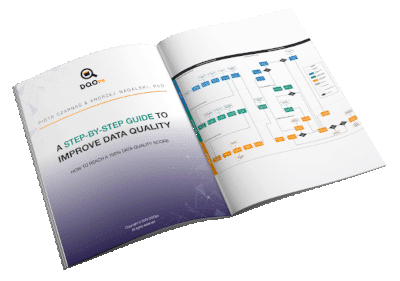
Check out our free eBook “A Step-by-Step Guide to Improve Data Quality,” which describes a proven process of assessing data quality, monitoring it, and reacting to data quality issues.