In this article, we check the data timeliness of the public BigQuery dataset using an average delay check.
After checking configuration and running check, we would like to verify average timestamp difference between two columns and show a timeliness dashboard available at our application to visualize results
Our example will be performed at public dataset bigquery-public-data.austin_crime.crime
Table of Contents
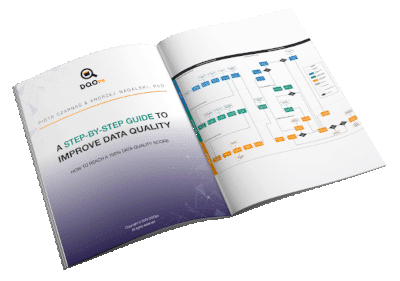
Data quality best practices - a step-by-step guide to improve data quality
- Learn the best practices in starting and scaling data quality
- Learn how to find and manage data quality issues
Description
The table timeliness check average_delay calculates an average timestamp difference between corresponding records (the ones that appear in the same row) in two specified columns. Setting time series mode=timestamp_column is essential here since the rule for this check needs a certain number of records to run properly. Timestamp difference part is configurable with time_scale parameter.
Daily average on BigQuery example
The data used in this article are available in public datasets at BigQuery.
The table is bigquery-public-data.austin_crime.crime, here are the first 5 rows for the column unique_key, clearance_date, timestamp:
					+-------------+     +----------------------+     +----------------------+
| unique_key  | ... |    clearance_date    | ... |      timestamp       | ...
+-------------+     +----------------------+     +----------------------+
|  2015150483 | ... | 2015-01-27T12:00:00Z | ... | 2015-01-15T12:00:00Z | ...
| 20151542027 | ... | 2015-07-24T12:00:00Z | ... | 2015-06-03T12:00:00Z | ...
| 20152001758 | ... | 2015-08-15T12:00:00Z | ... | 2015-07-19T12:00:00Z | ...
| 20151340282 | ... | 2015-06-15T12:00:00Z | ... | 2015-05-14T12:00:00Z | ...
| 20151871268 | ... | 2015-10-27T12:00:00Z | ... | 2015-07-06T12:00:00Z | ...
+-------------+     +----------------------+     +----------------------+
For this check, we will be using clearance_date, and timestamp column to calculate timestamp difference between them.
Check configuration
table edit -c=<connection_name> -t=austin_crime.crime
The YAML configuration looks like this (all the code necessary to define this check is highlighted below):
					# yaml-language-server: $schema=https://cloud.dqo.ai/dqo-yaml-schema/TableYaml-schema.json
apiVersion: dqo/v1
kind: table
spec:
  target:
    schema_name: austin_crime
    table_name: crime
  time_series:
    mode: timestamp_column
    timestamp_column: timestamp
    time_gradient: day
  checks:
    timeliness:
      average_delay:
        parameters:
          column1: "clearance_date"
          column2: "timestamp"
        rules:
          moving_average:
            low:
              max_percent_above: 5.0
              max_percent_below: 5.0
            medium:
              max_percent_above: 10.0
              max_percent_below: 10.0
            high:
              max_percent_above: 15.0
              max_percent_below: 15.0
  columns:
    unique_key:
      type_snapshot:
        column_type: INT64
        nullable: true
    ...
    clearance_date:
      type_snapshot:
        column_type: TIMESTAMP
        nullable: true
    ...
    timestamp:
      type_snapshot:
        column_type: TIMESTAMP
        nullable: true
    ...
Notice that column timestamp has two roles here:
- it is used to calculate the timestamp difference
- it serves as timestamp column in time_series, truncated into a DAY (in this case).
check run
The table below is the same as the one you would see on the provider’s platform (in this case BigQuery).
					Finished executing a sensor for a check average_delay on the table austin_crime.crime using a sensor definition table/timeliness/average_delay, sensor result count: 1096

Results returned by the sensor:
+------------------+-----------+
|actual_value      |time_period|
+------------------+-----------+
|18.989583333333336|2014-01-01 | <--- Here are the dates from
+------------------+-----------+      the column `timestamp`.
|19.49122807017543 |2014-01-02 |
+------------------+-----------+
|21.253968253968246|2014-01-03 |
+------------------+-----------+
|19.614457831325293|2014-01-04 |
+------------------+-----------+
|19.990196078431367|2014-01-05 |
+------------------+-----------+
|17.62015503875969 |2014-01-06 |
+------------------+-----------+
|24.454545454545457|2014-01-07 |
+------------------+-----------+
|16.343749999999996|2014-01-08 |
+------------------+-----------+
|30.16666666666667 |2014-01-09 |
+------------------+-----------+
|21.54455445544554 |2014-01-10 |
+------------------+-----------+
Check summary
Check evaluation summary briefly informs us about check execution:
					Check evaluation summary per table:
+------------+------------------+------+--------------+-------------+------------+---------------+-------------+
|Connection  |Table             |Checks|Sensor results|Valid results|Alerts (low)|Alerts (medium)|Alerts (high)|
+------------+------------------+------+--------------+-------------+------------+---------------+-------------+
|connection_1|austin_crime.crime|1     |1096          |232          |201         |181            |475          |
+------------+------------------+------+--------------+-------------+------------+---------------+-------------+
Conclusion
There are many more checks and examples to explore. The following documentation link shows you more information about timeliness checks.