In today’s world, maintaining high-quality data is not just a good idea, it’s often a legal requirement. Many industries are subject to regulatory compliance and must prove validation with an audit trail. This is especially true for organizations that:
- Handle large volumes of user data: Think social media companies, banks, or online retailers.
- Manage sensitive information: This includes healthcare providers, government agencies, and educational institutions.
These organizations have a greater responsibility to protect the data they collect. If problems arise, such as data breaches, customer complaints about incorrect information, or other issues stemming from poor data management, they may face a regulatory audit.
What Happens During an Audit?
Auditors will examine an organization’s data governance practices, including how they ensure and monitor data quality. In recent years, several large organizations have undergone such audits, with many revealing inadequate data quality management as the root cause of the problems.
This highlights a crucial point: regulatory authorities are not solely focused on legal paperwork and processes. They also delve into the actual data management practices that contribute to real-world issues experienced by customers.

Industries under Regulatory Compliance
The need for stringent data quality often goes hand-in-hand with regulatory compliance. Specific industries and organizations face heightened scrutiny due to the nature of their data and operations. Here are some key examples:
- High-volume user data: Organizations managing records for a large number of users are more likely to encounter data errors. With a larger user base comes a greater chance of inaccuracies creeping in and users reporting those problems.
- Sensitive data: Industries handling sensitive personal information, such as healthcare, life sciences, and pharmaceuticals, operate under strict regulations to ensure privacy and accuracy. Think of patient health records – their accuracy and confidentiality are the most important concern.
- Financial transactions: Financial institutions must adhere to strict protocols when processing transactions to prevent fraud and protect customers. Banks, for instance, need to accurately identify customers and flag suspicious activities.
Beyond these, numerous other sectors face data quality regulations:
- Public institutions and government agencies: These organizations must publish accurate and reliable operational data for public review.
- Telecommunications: Many countries have laws requiring telecom companies to maintain accurate records of customer identities and communications.
- Automotive: Even the automotive industry must report data to regulatory bodies, for example, to track CO2 emissions and calculate related taxes.
The common thread among these organizations? They are all data-driven, handle sensitive information, or produce data that must be unquestionably accurate. In these cases, robust data quality management is not just a good practice, it’s a necessity to meet regulatory obligations.
Data Quality in Regulatory Environments
Ensuring data quality for regulatory compliance goes beyond simply having “good” data. While achieving a usable level of quality is sufficient for operational reporting or internal processes, regulatory environments demand a more rigorous approach.
Beyond Data Cleansing
In non-regulated scenarios, data quality projects often focus on resolving critical issues to make the data usable for its intended purpose. A one-time data cleansing activity might be enough, with no ongoing monitoring or detailed records of the improvements made.
Risk-Based Approach
However, when regulatory compliance is involved, the focus shifts to risk management. Each data asset must be evaluated for potential risks associated with data quality issues. The “risk factor” becomes as important as the “value factor” in non-regulated domains. The goal is not just to make the data usable, but to actively address and mitigate all potential risks.
Data Quality Monitoring is Key
Continuous monitoring becomes paramount in regulated environments. It’s not enough to achieve a satisfactory level of data quality or perform occasional checks. Organizations must demonstrate to regulators that data quality is consistently validated, with comprehensive audit trails documenting every validation activity.
Proving Due Diligence
Think of it like this: regulators need to see proof that you’re not just cleaning up your data, but actively maintaining its quality over time. This requires:
- Clearly defined data quality measures: What aspects of data quality are being monitored (e.g., accuracy, completeness, timeliness)?
- Tracking and reporting on data quality metrics: How is the “health score” of data assets being measured and tracked?
- Maintaining detailed audit trails: Recording every data validation event, including the datasets tested, parameters used, and results.
The following sections will delve deeper into these data quality measures and metrics, providing a practical guide to navigate the complexities of data quality in regulatory environments.
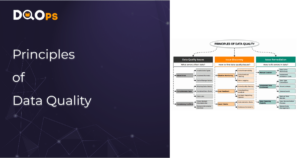
Key Data Quality Dimensions
When assessing data quality, it’s helpful to categorize potential issues into “data quality dimensions.” These dimensions provide a standardized framework for understanding and communicating data quality problems to both technical and non-technical stakeholders. Since these dimensions are widely recognized and used by regulatory bodies, using them can make audits smoother and ensure clear communication.
Here’s a breakdown of the most common data quality dimensions:
- Completeness: Does the data include all essential information? Are there any missing values or incomplete records?
- Timeliness: Is the data up-to-date? Is it delivered promptly, without delays that could impact its usefulness?
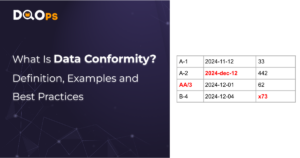
- Validity: Does the data adhere to the correct format and meet predefined validation rules? For example, are dates formatted correctly (YYYY-MM-DD), and do ages fall within a reasonable range (e.g., 18-120 years)? This dimension is sometimes referred to as “conformity.”
- Privacy: Is sensitive information properly protected and only accessible to authorized individuals? This involves ensuring that personally identifiable information (PII) is masked or anonymized when shared with unauthorized users.
- Accuracy: Does the data accurately reflect the real world? Has it been verified against trusted sources to ensure its correctness?
- Consistency: Is the data consistent across different sources and systems? Does it match the designated “source of truth”? Modern data observability platforms often flag anomalies like outliers as data consistency issues.
- Uniqueness: Are there any duplicate records within the dataset? Duplicate records can skew analysis and lead to inaccurate insights.
By systematically evaluating data quality across these dimensions, organizations can identify and address potential risks, ensuring compliance with regulatory requirements and maintaining trust in their data.
Data Quality Validation Points
Data quality isn’t just a one-time fix; it requires ongoing attention throughout the data lifecycle. While a comprehensive data quality assessment can identify and prioritize areas for improvement, continuous validation is crucial to maintain high standards. This may involve adjustments to data architecture, collection processes, and tools to ensure all data adheres to predefined quality benchmarks.
Here are some key integration points for automated data quality validation within your data architecture:
Scheduled Data Quality Checks
Utilize a dedicated data quality platform to define and regularly re-evaluate data quality checks. This allows for consistent monitoring and early detection of potential issues. Think of it as a recurring health checkup for your data.
Data Pipeline Validation
Embed data quality validation steps directly into your data pipelines. Before any data is published or consumed, the pipeline should automatically execute checks to ensure the new data meets quality standards. This prevents the propagation of bad data downstream.
Data Observability
Leverage data observability tools to monitor data sources and pipelines for anomalies and schema changes. These tools use AI to identify unexpected shifts in data patterns or structure, alerting data owners and support teams to potential problems and the need to update validation checks. This proactive approach helps maintain data quality even as your data environment evolves.
By implementing these validation measures at various stages, organizations create a robust system for ensuring ongoing data quality, reducing risks, and meeting regulatory compliance requirements.
Data Quality Metrics Scope
To effectively monitor and manage data quality, it’s essential to quantify it. This is where data quality “health scores” come in. These numerical scores provide a tangible measure of the quality of your data assets, whether it’s an entire database, a single table, a column, or even an individual record.
Tracking Data Quality at Different Levels
Health scores can be tracked at various levels of granularity, offering different insights and enabling targeted action:
- Data source level: This provides an overall picture of the health of an entire data source (e.g., a database). It reveals how reliable the source is, how often data quality issues arise, and how it compares to other sources.
- Dataset level (table level): This score drills down to the quality of individual datasets or tables. By identifying tables with the lowest scores, data teams can prioritize data cleansing activities and address the most critical issues first.
- Column level: Analyzing health scores at the column level helps pinpoint specific data fields with quality problems. This guides data teams in planning corrective actions and improving data validation rules.
- Record level: For datasets containing critical information, record-level validation is crucial. This involves identifying individual records with errors or missing values, such as transactions lacking essential details like country of origin.
Aligning Metrics with Risk Factors
Choosing the right health metrics is key. They should align with the identified risk factors for each data asset. This ensures that data quality monitoring is prioritized based on the potential impact of data quality issues. By combining different metrics and tracking them at various levels, organizations gain a comprehensive view of data quality and can effectively demonstrate their commitment to data quality management to regulatory bodies.
Data Quality Metrics Formulas
Now that we’ve explored the scope of data quality health metrics and where they can be applied, let’s dive into the specific formulas used to calculate them.
- Error Count: This is the simplest metric, representing the raw number of records within a dataset that contain invalid values. For example, if you’re checking for completeness in a “tax_id” field, the error count would be the number of records with missing tax IDs.
- Error Density: This metric provides a more nuanced view by calculating the percentage of invalid records within a dataset. This is useful because it normalizes the error count against the dataset size. A growing dataset might have more errors simply due to its increased size, but error density reveals whether the underlying data quality is improving or worsening.
- Error Severity: This weighted metric acknowledges that not all errors have the same impact. For example, a missing country code in a small financial transaction is less severe than a missing country code in a large transaction. Error severity assigns weights to errors based on factors like monetary value, allowing you to prioritize the most critical issues.
- Data Reliability: This high-level metric provides a holistic view of data asset health. It’s calculated as the percentage of failed data quality checks over a period of time. A consistently reliable data asset will have few failed checks, while a problematic one will trigger frequent alerts. This metric helps identify data sources that require attention or redesign.
These metrics, used individually or in combination, provide a quantitative basis for assessing and monitoring data quality. They enable data teams to track progress, prioritize actions, and demonstrate compliance with regulatory requirements.
Data Quality Validation Records
While the data quality metrics discussed so far are valuable for any organization, regulated environments require a more stringent approach: a tamper-proof record of all data quality validation activities. This audit trail demonstrates to regulators that data quality is not just a goal, but an actively monitored and maintained practice.
Why Traditional Logs Are Not Enough
Simply logging data quality checks in unstructured text files or JSON logs is insufficient for regulatory audits. Extracting specific validation records from a sea of log entries related to various data processing activities can be a herculean task, potentially hindering the audit process and reflecting poorly on the organization.
Essential Elements of a Data Quality Audit Trail
To meet regulatory requirements, data quality validation records must be stored in a structured format, capturing the following information for each validation event:
- Data Asset Identification: Clearly identify the specific dataset and column being validated. This ensures that the audit trail is linked to the relevant data assets.
- Validation Parameters: Record the specific parameters and thresholds used in the data quality rule. Even if these parameters are adjusted later, the audit trail should preserve the original values used at the time of validation.
- Data Quality Measures: Capture all calculated data quality measures, such as record count, error count, and error density. This provides a quantitative record of the data quality at the time of validation.
- Validation Result: Clearly indicate whether the data quality check passed or failed. This provides a concise summary of the validation outcome.
Benefits of a Robust Audit Trail
A well-maintained audit trail of data quality validations offers several benefits:
- Demonstrates compliance: Provides concrete evidence of ongoing data quality monitoring to regulatory auditors.
- Facilitates root cause analysis: Helps identify the origin of data quality issues and track their resolution.
- Supports continuous improvement: Enables tracking of data quality trends over time and informs data quality improvement initiatives.
- Protects against tampering: Ensures the integrity of validation records and prevents manipulation.
By investing in a data quality platform that automatically generates and preserves these detailed validation records, organizations can confidently demonstrate their commitment to data quality and navigate regulatory audits with ease.
Data Quality KPIs
We’ve covered various data quality metrics and their application across different levels. But how do you effectively measure and prioritize data quality across an organization with hundreds of databases and thousands of tables? This is where Data Quality KPIs (Key Performance Indicators) play a crucial role.
The Challenge of Aggregation
Simply aggregating individual data quality metrics can be misleading. Different data quality dimensions might have different numbers of validation checks. For example, you might have only one check for data timeliness but hundreds of checks for completeness across various columns. A single failure in timeliness, even if it impacts all columns, might be overshadowed by the sheer volume of completeness checks.
Risk-Based KPIs
Data Quality KPIs address this challenge by providing a holistic, risk-weighted measure of data quality for each dataset. They combine multiple data quality dimensions into a single score, using weights based on the risk factors associated with each dimension. For instance, a KPI could be calculated with the following weights:
- 50% accuracy
- 30% validity
- 10% completeness
- 10% timeliness
This ensures that critical dimensions with higher risk factors have a greater impact on the overall KPI score
Data Quality Dashboards
Given the complexity of these calculations, custom data quality dashboards are the most effective way to track and visualize KPIs. These dashboards can be tailored to specific data domains and provide a clear overview of data quality performance.
By implementing Data Quality KPIs and visualizing them through dashboards, organizations can:
- Prioritize data quality efforts: Focus on datasets with the lowest KPI scores.
- Track progress over time: Monitor trends in data quality and identify areas for improvement.
- Communicate data quality effectively: Provide stakeholders with a clear and concise overview of data health.
- Demonstrate compliance: Show regulators that data quality is being actively managed and monitored.
Data Quality KPIs are a crucial tool for organizations navigating the complexities of data quality management in regulatory environments. They provide a comprehensive and actionable view of data health, enabling data-driven decisions and ensuring compliance with regulatory requirements.
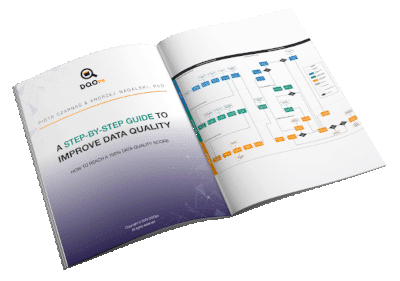
Data quality best practices - a step-by-step guide to improve data quality
- Learn the best practices in starting and scaling data quality
- Learn how to find and manage data quality issues
What is the DQOps Data Quality Operations Center
DQOps is a data observability platform designed to monitor data and assess the data quality trust score with data quality KPIs. DQOps provides extensive support for configuring data quality checks, applying configuration by data quality policies, detecting anomalies, and managing the data quality incident workflow.
DQOps is a platform that combines the functionality of a data quality platform to perform the data quality assessment of data assets. It is also a complete data observability platform that can monitor data and measure data quality metrics at table level to measure its health scores with data quality KPIs.
You can set up DQOps locally or in your on-premises environment to learn how DQOps can monitor data sources and ensure data quality within a data platform. Follow the DQOps documentation, go through the DQOps getting started guide to learn how to set up DQOps locally, and try it.
You may also be interested in our free eBook, “A step-by-step guide to improve data quality.” The eBook documents our proven process for managing data quality issues and ensuring a high level of data quality over time. This is a great resource to learn about data quality.