Data observability is a modern approach to monitoring data sources, data platforms, and data pipelines, giving the benefit of detecting anomalies and issues that can impact the reliability of your data. Modern data platforms often utilize cloud resources and open-source tools to handle large volumes and diverse types of data. This data is ingested into databases, data lakes, and data warehouses, then processed by complex data pipelines with multiple steps, increasing the likelihood of errors.
Data engineering teams responsible for maintaining hundreds or thousands of datasets often have limited resources. Yet, they need to respond quickly to failures and potential issues. Without proper monitoring, these issues are typically discovered by users, disrupting their work and forcing them to contact data owners or engineering teams for resolution. This process is time-consuming and hinders business decisions.
Data observability tools address this challenge by automating data quality monitoring. These tools regularly check data quality, track key metrics (e.g., row count, distinct value count), and apply machine learning algorithms to detect anomalies. When an anomaly is detected, the tool automatically notifies the appropriate personnel to review and address the problem. This proactive approach allows data engineering teams and data source owners to fix issues before they impact users.
This article explores some of the most common data quality and reliability issues that data observability can detect.
Why Data Observability Is Needed
Data engineering teams manage complex data platforms that ingest, transform, and load data from a wide range of sources. These sources can include internal databases, external SaaS platforms like CRMs, and custom-built business applications. Data engineers typically focus on building and maintaining ETL/ELT pipelines, not on managing the source systems themselves. This separation of responsibilities can lead to challenges when source systems undergo changes, as data engineers may not be immediately aware of updates that could impact their pipelines.
For example, imagine a SaaS vendor decides to upgrade their platform and changes a column’s data type. The vendor might communicate this change to the organization’s administrator for that SaaS product (e.g., the CRM owner), but this crucial information might not reach the data engineering team in time to prevent pipeline failures. This communication gap is often exacerbated in organizations with siloed IT departments, where development teams responsible for maintaining a custom business application might not interact frequently with the data engineering teams who consume the data. This lack of communication, compounded by potential understaffing in data engineering teams who must manage data from multiple departments, can create a breeding ground for data quality issues.
Data observability provides tremendous value in addressing these challenges by proactively monitoring data pipelines and alerting teams to potential problems before they impact users. Here are some common scenarios where data observability benefits are most valuable:
Schema Changes
When a table or file schema changes without proper communication, data ingestion pipelines can break. This often happens due to a lack of communication from the data source owner or when data engineering teams are unable to update data transformation logic in time. ETL pipelines can fail entirely or corrupt target tables when processing data in a new, unexpected format. Data observability tools can detect these schema changes and alert teams before they cause disruptions.
Data Delivery Issues
Data platforms relying on file exchanges or batch processing can experience delays or failures in data delivery. For instance, a source dataset might be decommissioned without notifying the data engineering team, leading to wasted resources as the ETL pipeline continues to replicate an outdated table. Data delivery can also be delayed due to expired security credentials like passwords, API keys, or certificates, preventing data publishers from providing fresh data. The benefit of data observability tools is monitoring data freshness and alerting teams to data delivery issues, enabling them to investigate and resolve the root cause.
Data Pipeline Errors
Many data pipelines are incredibly complex, making it difficult to identify and address potential issues. Even seemingly small oversights, like mismatched column lists between ingestion and loading steps, can cause pipeline failures. Monitoring pipeline logs, such as those from Apache Airflow, becomes critical for detecting these errors. Modern data observability platforms can integrate with logging systems to provide comprehensive pipeline monitoring and alerting.
Data Drifts
Changes in data distribution, such as outliers in minimum or maximum values, can indicate problems in the data collection stage. For example, if users manually enter product prices and an outlier value like $2.1M appears, it’s likely a mistake. These outliers can skew statistical analyses and need to be identified and cleansed. The benefit of data observability is detecting data drifts and alerting teams to potential data quality issues.
Recurring Data Quality Issues
Some data quality problems are recurring, often caused by underlying platform reliability issues that appear intermittently. For example, if users consistently report issues with financial records at specific times (e.g., during tax season), data observability can help by implementing custom data quality checks that run regularly to validate the data against user requirements. This proactive approach helps prevent user frustration and ensures data reliability when it’s needed most.
Data Transformation Errors
Many data sources allow users to enter data in custom formats or use generic data types like “text” to store numeric or date values. This can create problems for downstream analytics, as text columns are not directly aggregable. Data pipelines must transform these values into the correct target data types. When data formats change unexpectedly (e.g., a date column suddenly contains values like “December 2nd, 2024” instead of “2024-12-02”), data loading pipelines can fail. Data observability can analyze data formats, validate data type conversions, and detect anomalies to prevent transformation errors.
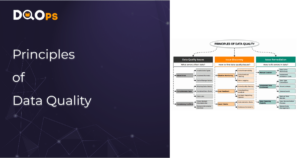
In the following sections, we’ll provide a more detailed look at each of these issues and demonstrate how data observability can help you mitigate them effectively. These issues are summarized in the following infographic.

Why Data Observability Is Popular
The data landscape has changed dramatically. While data and AI departments have significantly larger budgets than in the past, the way organizations approach data has also evolved. Decades ago, the focus was on building enterprise data warehouses with carefully curated datasets and operational data marts for reporting. Today, organizations recognize data as a valuable asset, often collecting all generated data with the idea that it might be useful in the future.
This shift has led to new challenges. Instead of meticulously managing every dataset with dedicated data stewards and master data management platforms, many organizations now load raw data into data lakes, where it sits until a data analyst or scientist finds a use for it. This “quantity over quality” approach inevitably leads to data quality issues slipping through the cracks. Data teams need a way to detect and address these issues at scale.
This is where data observability comes in. Data observability tools empower data teams to handle the scale and complexity of modern data environments by:
- Analyzing massive datasets: Data observability platforms leverage statistical analysis and machine learning to efficiently analyze datasets with huge volumes of data, detecting significant changes, anomalies, and data drifts that would be impossible to identify manually.
- Monitoring at scale: These platforms can monitor hundreds or thousands of tables without requiring manual registration or configuration for each table. By using data quality policies, data observability tools can automatically activate relevant metrics and monitoring processes for all tables within a data platform. This automated approach allows data teams to maintain data quality across their entire data landscape, even as it grows and evolves.
Data observability benefits come from its turn-key approach to watch for data quality issues without the need to configure thresholds (rules) of data quality rules. These tools utilize machine learning and anomaly detection by AI models to self-tune the parameters.
Data Sources Monitored by Data Observability
To achieve comprehensive data observability, tools need to monitor all relevant data sources and processing pipelines in one central location. This provides a holistic view of the data landscape and enables proactive identification of issues. Here are some of the key data sources that data observability platforms typically monitor:
- Relational databases: Monitoring both source and target tables in relational databases is crucial. This allows for tracking data quality at the origin and validating the quality of data after it’s been processed and loaded by data pipelines.
- Flat files: Many data pipelines ingest data from flat files like CSV, JSON, or XML. These files are often exchanged between data publishers and consumers using file buckets or similar mechanisms. Monitoring these files helps ensure data integrity and timely delivery.
- Data pipeline logs: Logs from data pipelines provide valuable information about errors, processing times, and potential bottlenecks. Analyzing these logs can help detect delays in data processing and identify areas for optimization.
- Data contracts: Data contracts define the structure and data quality constraints of datasets agreed upon by data publishers and consumers. Data observability tools can validate data against these contracts, ensuring compliance and preventing downstream issues.
- Data lineage tracking information: Data lineage provides a historical record of how data flows through the system, including its origins, transformations, and destinations. Data observability tools can leverage lineage information to pinpoint the root cause of data quality issues and identify all downstream systems that might be impacted. This facilitates faster troubleshooting and minimizes the impact of data errors.
Data observability provides the benefit of end-to-end data monitoring across various components that should be monitored to achieve a full view of the data platform’s health.
How to Detect Data Schema and Format Changes
Schema and format changes in source datasets are among the most common data quality issues that can disrupt data pipelines. Data observability tools excel at detecting these changes early on, preventing cascading failures and data corruption. By proactively monitoring data sources and analyzing schema and format characteristics, these tools help maintain data integrity and pipeline stability.
Here’s how data observability tools tackle these challenges:
Table or Dataset Schema Changes
These changes, such as adding, removing, or renaming columns, can cause data pipelines to crash or corrupt data if not handled correctly. Data observability tools capture and store the last known schema for each dataset, including the list of columns and their data types. They regularly compare the current schema against the stored version, flagging any discrepancies as potential issues. This allows data engineers to update their pipelines proactively, ensuring compatibility with the new schema.
Data Type Changes
While schema analysis can detect changes in declared data types, data observability tools go further by analyzing the actual data within columns. This is particularly important when dealing with raw files like CSV or JSON, where all values might be stored as text. The tool can scan these columns to identify values that are no longer convertible to the expected target data type (e.g., an integer or decimal). This helps prevent pipeline crashes and data loss caused by incompatible data types.
Data Format Changes
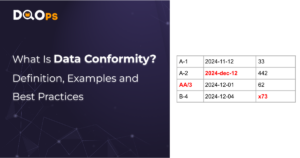
Data often needs to adhere to specific formats, such as dates following the ISO 8601 standard (YYYY-MM-DD). Data observability tools can monitor text columns to ensure they conform to the expected format. For example, if a date column suddenly contains a value like “December 2nd, 2024” instead of “2024-12-02”, the tool will flag this as a potential issue. Detecting these format changes early prevents errors in downstream processes that rely on consistent data formats.
Reordered Columns
Changes in column order can disrupt data pipelines and lead to incorrect data loading. Data observability tools can detect these changes in two ways: by directly comparing the current column order to the stored schema or by analyzing the data distribution within columns. When columns are reordered, the number of distinct values in each column typically changes significantly. For instance, a “gender” column has limited distinct values, while a “last_name” column might have millions. By monitoring these distinct counts, data observability tools can identify anomalies that suggest a column reordering has occurred.
How to Monitor Data Platform and Pipeline Reliability
Data reliability issues often stem from unpredictable failures within data processing pipelines. The sources of these failures are numerous and varied: expired credentials for data sources, disk space issues on the transformation platform, coding bugs affecting specific records, and many more. Despite their diverse origins, these issues share common consequences: outdated data, error-filled pipeline logs, and potential impacts on downstream tables and processes.
Data observability platforms provide a crucial safety net by monitoring log files, analyzing data freshness, and tracking various metrics that can indicate failures and reliability issues. This proactive approach helps data teams identify and address problems before they escalate and impact users.
Here are some key areas where data observability comes with the benefit of ensuring data reliability:
Data Freshness
Data freshness measures how up-to-date the data is. It’s calculated as the age of the most recent record in a dataset. Data observability tools continuously monitor data freshness by comparing the timestamp of the latest record to the current time. When data freshness exceeds a predefined threshold (e.g., data hasn’t been updated in 4 days when it usually updates every 3 days), the tool flags it as a potential issue. This allows data engineers to investigate delays in data delivery and address the underlying cause.
Data Pipeline Health
Data pipelines often generate logs that contain valuable information about errors, warnings, and data quality checks performed within the pipeline. Data observability tools can ingest and analyze these logs, correlating them with specific datasets and pipelines. By automatically identifying and surfacing relevant log entries, these tools reduce the manual effort required to parse and analyze logs, enabling faster issue resolution.
Data Lineage
Data lineage provides a map of how data flows through the system. When a data quality issue arises in a source table, data observability tools can leverage lineage information to identify all downstream tables and processes that might be affected. This helps prevent the propagation of bad data and enables proactive communication with teams that rely on the affected data. Additionally, data pipelines can use data observability APIs to check the health status of source datasets before ingesting them, preventing unnecessary processing of corrupted data.
Unreliable Datasets
Some datasets are inherently less reliable and prone to data quality issues. Data observability platforms track all metrics, validation results, and data quality issues associated with each dataset. This information can be used to calculate a “health score” or data quality KPI for each dataset, indicating its overall reliability. Data pipelines can then use this information to make informed decisions about data ingestion, avoiding unreliable sources or implementing additional data quality checks when necessary.
By proactively monitoring these aspects of data reliability, data observability tools help data teams maintain the health and integrity of their data pipelines, ensuring that data is delivered reliably and accurately to downstream consumers.
How to Test Data Quality with Data Observability
While data observability focuses on providing a comprehensive view of your data ecosystem, it also plays a vital role in ensuring data quality. Data quality testing, which involves validating data against predefined rules and metrics, is a key component of data observability. By combining traditional data quality checks with the capabilities of data observability tools, data teams can achieve a more holistic and proactive approach to data quality management.
Although data quality testing might not be the primary driver for adopting data observability, it offers significant benefits. Well-defined data quality checks, validated by business users and aligned with core data quality dimensions (validity, accuracy, uniqueness, etc.), provide a high level of confidence in data health. Data observability tools streamline this process by automating data quality checks and leveraging AI to determine appropriate thresholds and identify anomalies.
Here’s how data observability tools enhance data quality testing:
- Automated Data Quality Checks: Data observability platforms can run a wide range of data quality checks alongside their built-in sensors that capture schema information and data quality metrics. This integrated approach provides a complete picture of data health, combining insights from schema changes, pipeline errors, and data quality check results. This comprehensive view surpasses traditional methods like manual checks or log analysis, offering a more proactive and efficient way to manage data quality.
- AI-Powered Thresholds: Manually configuring data quality checks and setting thresholds can be time-consuming. Data observability tools address this by capturing historical values for each metric and using AI to suggest appropriate threshold values. This ensures that data quality checks are relevant and effectively detect anomalies.
Data observability tools can detect a wide range of data quality issues, including:
Missing Values
Identifying and tracking missing values is crucial for data completeness. Data observability tools can monitor the percentage of missing values in a column and alert teams to significant drops, indicating potential problems in the data collection process.
Data Anomalies
By applying anomaly detection algorithms to time series of data quality metrics, data observability tools can identify outliers and unusual patterns that might indicate data quality issues. This proactive approach helps detect problems before they impact downstream processes.
Data Mismatches (Data Reconciliation)
Data observability tools can automate data reconciliation processes, comparing datasets across different sources to identify mismatches. This helps ensure data consistency and identify potential errors in data transformation or integration processes.
Recurring Data Quality Issues
Data observability platforms can schedule and run data quality checks that address recurring data quality issues previously reported by users or identified by data analysts. This proactive monitoring helps prevent recurring problems and maintain data reliability.
Beyond these examples, data observability tools can also detect duplicate rows or values, invalid data formats, values not present in data dictionaries, and many other common data quality issues. By incorporating data quality testing into their core functionality, data observability platforms empower data teams to proactively manage data quality, ensuring data reliability and trustworthiness across their entire data landscape.
Data quality best practices - a step-by-step guide to improve data quality
- Learn the best practices in starting and scaling data quality
- Learn how to find and manage data quality issues
How Data Observability Tools Store Data and Configuration
Data observability tools rely on a robust and organized system for storing metadata and metrics. This ensures efficient monitoring, analysis, and reporting of data quality and pipeline health. Here’s how these tools typically manage data storage:
Data Source Configurations
- Connection details for various data sources (databases, data lakes, etc.) are securely stored, allowing the tool to access and monitor data across the data landscape.
- Information about monitored tables within each data source is maintained, enabling targeted monitoring and analysis.
Data Observability Settings
Each dataset has its own set of configurations that define how it’s monitored. This includes:
- Selection of metrics to capture (e.g., row count, null count, distinct count).
- Parameters for anomaly detection algorithms (e.g., sensitivity, thresholds).
- Configuration of user-defined data quality checks (e.g., SQL queries, validation rules).
- Alerting preferences (e.g., notification channels, thresholds for triggering alerts).
Historical Metrics Storage
- A time-series database stores historical values for all captured metrics. This allows for trend analysis, anomaly detection, and comparison of current values against historical patterns.
- Commercial data observability tools often use relational databases for metric storage. However, some platforms, like the DQOps platform, utilize local data lakes. This approach allows users to push data quality metrics to their own on-premise data lakes or data warehouses, providing greater control and security over their data.
How Data Observability Tools Work
Once the necessary data and configurations are stored, data observability tools employ a series of processes to monitor data health and detect anomalies. Here’s how they typically work:
Scheduled Data Quality Monitoring
Built-in job schedulers trigger data observability tasks at predefined intervals (e.g., hourly, daily), ensuring regular monitoring and timely detection of issues.
Data Analysis and Anomaly Detection
- Data Profiling and Metric Capture: Tools automatically profile datasets, capturing key metrics and statistics.
- Anomaly Detection: Intelligent algorithms analyze historical trends and identify anomalies or deviations from expected patterns. This includes:
- Simple rule-based checks (e.g., detecting changes in column count).
- Time-series analysis to identify outliers and significant shifts in data distribution.
Data Quality Checks and Validation
- Custom Checks: Users can define and execute custom data quality checks to validate data against specific business rules and requirements.
- SQL Optimization: Advanced tools, such as DQOps, can optimize the execution of multiple data quality checks referencing the same table by merging them into a single query, minimizing the load on data sources.
Alerting and Incident Management
- Automated Alerts: When anomalies or data quality issues are detected, the tool automatically triggers alerts, notifying relevant stakeholders through configured channels (e.g., email, Slack).
- Incident Grouping: To avoid alert fatigue, tools group related issues into incidents, providing a consolidated view and reducing notification noise.
By combining automated monitoring, intelligent anomaly detection, user-defined checks, and efficient alert management, data observability tools empower data teams to proactively maintain data health, prevent data quality issues, and ensure the reliability of their data pipelines.
What is the DQOps Data Quality Operations Center
DQOps is a data quality and observability platform designed to monitor data and assess the data quality trust score with data quality KPIs. DQOps provides extensive support for configuring data quality checks, applying configuration by data quality policies, detecting anomalies, and managing the data quality incident workflow.
DQOps is a platform that combines the functionality of a data quality platform to perform the data quality assessment of data assets. It is also a complete data observability platform that can monitor data and measure data quality metrics at table level to measure its health scores with data quality KPIs.
You can set up DQOps locally or in your on-premises environment to learn how DQOps can monitor data sources and ensure data quality within a data platform. Follow the DQOps documentation, go through the DQOps getting started guide to learn how to set up DQOps locally, and try it.
You may also be interested in our free eBook, “A step-by-step guide to improve data quality.” The eBook documents our proven process for managing data quality issues and ensuring a high level of data quality over time. This is a great resource to learn about data quality.