Data monitoring tracks the health of a data platform. It encompasses various monitoring methods to ensure data quality and reliability. For example, testing data quality, tracking ETL data pipelines, and watching the overall system health. Effectively addressing the diverse challenges in data management requires a multifaceted approach to monitoring.
While some data quality issues may be predictable and recurring, requiring proactive measures like predefined checks and thresholds, others may be unexpected and require more sophisticated techniques like data observability. Data observability leverages AI and anomaly detection to identify subtle deviations and potential issues before they escalate.
Beyond data quality, data monitoring methods must extend to the underlying platform itself. This includes analyzing platform logs to identify configuration errors, resource constraints, and other infrastructure-related problems. Centralized log management and analysis are crucial for detecting and prioritizing critical issues, enabling timely intervention by the appropriate personnel.
This article explores various data monitoring methods, examining their strengths and weaknesses in achieving comprehensive data observability. By combining proactive and reactive strategies, organizations can effectively manage data incidents, ensure data integrity, and maintain the health of their data ecosystem.
Data Platform Health
Data platforms are complex ecosystems comprising interconnected components: database infrastructure, ETL pipelines, and the data itself. Each element plays a critical role in maintaining platform health and ensuring the reliable delivery of data to users and applications. Failures in any of these areas can have cascading effects on data availability, integrity, and overall system stability. Platform components require different data monitoring methods to detect failures or predict future failures by applying anomaly detection.
Potential Failure Points
- Database Infrastructure: Database server failures can disrupt data loading processes, prevent user access, and impact application performance. Issues like server outages, network connectivity problems, or resource constraints (e.g., storage capacity) can all contribute to database instability.
- ETL Pipelines: Bugs, logic errors, or infrastructure limitations within ETL pipelines can halt data ingestion, leading to data loss and inconsistencies. Factors such as incorrect transformations, data type mismatches, or insufficient processing capacity can disrupt the data flow.
- Data Drift: Changes in source data schema, formats, or data types can result in data drift. While data may continue to flow through the pipeline, inconsistencies between the expected and actual data structure can lead to data quality issues and inaccurate analysis.
Consequences of Failure
Failures in any of these areas can manifest as platform unavailability, data anomalies, or performance degradation. Users may experience delays, encounter errors, or observe inconsistencies in the data. Unresolved data processing failures can also result in data loss, compromising the integrity and reliability of the entire system.
Monitoring Strategies for Platform Health
Effective data platform health monitoring requires a comprehensive approach that addresses each potential failure point:
- Log Monitoring: Analyzing logs from data pipelines and dedicated error logging tables provides valuable insights into processing errors, exceptions, and other critical events. Centralized log management and filtering enable efficient identification and prioritization of issues.
- Database Monitoring: Employing health checks to assess database availability, response times, and resource utilization ensures the stability of the core data infrastructure. Monitoring critical REST APIs used for data management further enhances visibility into platform health.
- Data Quality Monitoring: Implementing data quality checks on critical tables and leveraging data observability techniques (e.g., anomaly detection) helps identify data drift, inconsistencies, and unexpected changes in data patterns.
By combining these data monitoring methods, organizations can proactively identify and address potential issues, ensuring the continuous health and stability of their data platforms.
The following infographic shows a comparison between various methods of monitoring data and data platforms.

Log Monitoring
Logs serve as a primary source of information for diagnosing and troubleshooting issues within data platforms. They provide valuable insights into system behavior, errors, and the sequence of events leading to failures. Two main categories of logs are essential for comprehensive data platform monitoring:
- System Logs: These logs are generated by the underlying infrastructure and platform components, including ETL tools, orchestration engines (e.g., Airflow), database servers, and containerization platforms (e.g., Kubernetes). System logs offer insights into the operational status of these components, capturing events like service starts and stops, resource usage, and potential errors.
- Application Logs: These logs are generated by the custom code within data pipelines, providing a detailed view of data processing activities. Data engineers strategically place logging statements at critical points in the pipeline to capture events such as file detection, workflow initiation, data transformations, and load completion.
Experienced data engineers prioritize logging events that are crucial for troubleshooting and root cause analysis. By focusing on sensitive areas within the data pipeline, they can effectively track data flow, identify bottlenecks, and diagnose errors. However, manually adding logging code to every critical step can be time-consuming. Alternative methods for efficient log management within data pipelines include:
- Logging: This involves strategically placing logging statements within the data pipeline code to capture essential information at critical points. Data engineers choose specific events and data points to log, providing context for debugging and analysis.
- Advantages: Allows for targeted logging of relevant information, facilitating efficient root cause analysis.
- Disadvantages: Requires manual code integration and careful selection of logging points. Custom log formats may necessitate parsing and analysis tools.
- Tracing: Tracing involves assigning unique identifiers to data processing workflows and propagating these identifiers through each step in the pipeline. This enables tracking the flow of data and identifying potential points of failure within complex, multi-stage processes.
- Advantages: Provides end-to-end visibility into data flow, particularly useful in event-driven architectures. Facilitates understanding of workflow dependencies and identifying bottlenecks.
- Disadvantages: Primarily applicable to event-driven systems. Requires consistent implementation of tracing ID propagation across all components.
- Instrumentation: This technique utilizes platform-specific features or AOP (Aspect-Oriented Programming) to automatically inject logging calls into the codebase. This approach simplifies logging setup and ensures consistent log formats across the application.
- Advantages: Reduces manual effort by automating log injection. Standardized log formats facilitate analysis and aggregation.
- Disadvantages: May generate a high volume of log data, requiring efficient filtering and analysis strategies. Requires platform support or aspect-oriented capabilities of the programming language.
Database Monitoring
Database monitoring is paramount for ensuring the health and stability of a data platform. The database serves as the central repository for data storage and processing, making its performance critical to overall system functionality. Any disruption in database operations can have immediate and widespread consequences, impacting data availability, application performance, and ETL pipeline stability.
Health Checks for Rapid Response
To ensure high availability, particularly for cloud-hosted databases, frequent and rapid health checks are essential. Cloud providers often offer built-in health check mechanisms that integrate with dedicated REST API endpoints. Implementing custom health checks tailored to the specific database environment provides the most effective means of achieving and maintaining high availability targets (e.g., 99.9%). Health checks are the most straightforward data monitoring method that can watch for critical metrics that can assess the database’s health.
Key Considerations for Health Checks
- Response Time: Health checks must execute swiftly, typically within a few seconds (e.g., 5 seconds), to avoid being misinterpreted as database timeouts.
- Focus on Critical Components: Due to time constraints, health checks should prioritize essential database functions:
- Connectivity: Verify the ability to establish connections to the database and other critical components.
- Response Time: Execute a predefined query with a known, fast response time to assess overall database responsiveness.
- Basic Data Validation: Perform a lightweight check to confirm the presence of expected data, such as counting rows in a small table.
By implementing robust health checks, organizations can proactively monitor database health, rapidly detect anomalies, and minimize the impact of potential database failures on the data platform.
Data Quality Monitoring
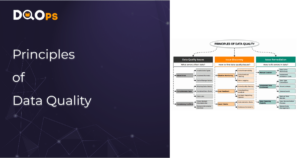
Data quality monitoring is essential for ensuring that data is fit for its intended purpose. While data platforms ingest data from various sources, they often have limited control over the quality of the incoming data. Data quality monitoring employs specialized checks and techniques to assess and validate data integrity, accuracy, and consistency. Organizations can establish roles and responsibilities aligned with the ISO 8000:150 standard.
The approach to data quality monitoring can vary significantly depending on several factors:
- Who defines the checks: Data quality checks can be defined by data engineers, data stewards, or business analysts, each with their own perspectives and priorities.
- Stage of testing: Data can be tested at various stages, including before ingestion (source data), during transformation, or after loading into the target system.
- Testing methodology: Different techniques, from automated tests to manual reviews, can be employed to assess data quality.
Here’s a comparison of various data quality monitoring methods and techniques:
- Data Observability: This proactive approach utilizes a dedicated platform to monitor a wide array of data quality metrics and leverage AI/ML capabilities for anomaly detection. It aims to identify and predict potential data quality issues before they impact downstream processes.
- Advantages: Provides a comprehensive and proactive approach to data quality management. Leverages AI/ML for advanced anomaly detection.
- Disadvantages: May be limited in scope to specific types of data quality issues. Can be more complex to implement and manage than traditional methods.
- Data Monitoring: This method involves implementing predefined data quality checks with established rules and thresholds (e.g., null values, data type validation, range checks). These checks are typically integrated into the data pipeline or executed on a scheduled basis.
- Advantages: Effectively detects known data quality issues and deviations from established KPIs. Relatively easy to implement and manage.
- Disadvantages: Requires manual configuration of checks and thresholds. May not be suitable for detecting complex or unforeseen data quality issues.
- Continuous Testing: This approach involves creating a comprehensive suite of data quality tests that are executed at regular intervals. These tests are often designed to validate specific business rules and requirements, ensuring that data meets business expectations.
- Advantages: Highly effective for addressing recurring data quality issues and ensuring alignment with business needs. Allows for comprehensive testing of data against various criteria.
- Disadvantages: Requires close collaboration with business users and careful test design. Can be time-consuming to develop and maintain a comprehensive test suite.
- Assertions: This technique involves embedding data quality checks directly into the data pipeline code. These checks enforce strict data quality constraints and can halt the pipeline if critical conditions are not met.
- Advantages: Prevents the propagation of corrupted data by proactively enforcing data quality rules. Ensures data integrity at critical points in the pipeline.
- Disadvantages: Requires hardcoding data quality checks within the pipeline. Strict constraints can lead to pipeline interruptions if business rules are subject to variability.
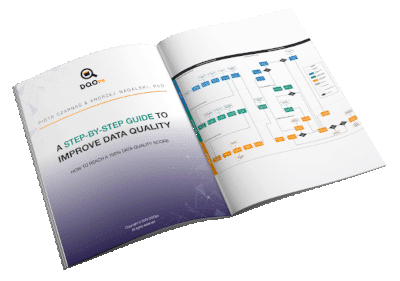
Data quality best practices - a step-by-step guide to improve data quality
- Learn the best practices in starting and scaling data quality
- Learn how to find and manage data quality issues
End-to-End Data Observability
The complexity of modern data platforms, with their diverse components and potential points of failure, has given rise to the need for a holistic approach to monitoring. End-to-end data observability addresses this challenge by integrating various data monitoring methods and techniques to provide a comprehensive view of data platform health.
While data observability, as a standalone technique, focuses primarily on data quality metrics and anomaly detection, end-to-end data observability expands this scope. It encompasses:
- Data Observability: Leverages AI/ML to identify anomalies and predict potential data quality issues.
- Data Quality Checks: Employs predefined rules and thresholds to validate data integrity and consistency.
- Log Monitoring: Analyzes system and application logs to detect errors, track data flow, and diagnose issues.
- Database Monitoring: Uses health checks to ensure database availability and responsiveness.
This integrated approach provides a “birds-eye view” of the data platform, enabling organizations to proactively identify and address issues across all layers of the data ecosystem
Incident Management Workflow:
A crucial aspect of end-to-end data observability is an effective incident management workflow. This involves:
- Centralized Incident Collection: Aggregate incidents from various sources, including failed health checks, data quality violations, and log errors, into a centralized platform.
- Intelligent Routing: Utilize log routing and analysis to automatically categorize and prioritize incidents.
- Automated Notifications: Configure real-time alerts and notifications through appropriate channels (e.g., email, Slack, MS Teams) to ensure timely responses from the appropriate teams.
By combining comprehensive monitoring with streamlined incident management, end-to-end data observability empowers organizations to maintain data platform health, minimize downtime, and ensure the reliable delivery of high-quality data.
What is the DQOps Data Quality Operations Center
DQOps is a data observability platform designed to monitor data and assess the data quality trust score with data quality KPIs. DQOps provides extensive support for configuring data quality checks, applying configuration by data quality policies, detecting anomalies, and managing the data quality incident workflow.
DQOps is a platform that combines the functionality of a data quality platform to perform the data quality assessment of data assets. It is also a complete data observability platform that can monitor data and measure data quality metrics at table level to measure its health scores with data quality KPIs.
You can set up DQOps locally or in your on-premises environment to learn how DQOps can monitor data sources and ensure data quality within a data platform. Follow the DQOps documentation, go through the DQOps getting started guide to learn how to set up DQOps locally, and try it.
You may also be interested in our free eBook, “A step-by-step guide to improve data quality.” The eBook documents our proven process for managing data quality issues and ensuring a high level of data quality over time. This is a great resource to learn about data quality.