Data quality issues are pervasive challenges that can significantly impact the reliability, usability, and trustworthiness of data. Even seemingly minor errors can have cascading effects on data analysis, reporting, and decision-making. These issues often manifest in ways that are readily apparent to data users, leading to a loss of confidence in the data and the systems that manage it.
A common example is the impact of inconsistent number formatting. In many regions, commas are used as thousand separators and periods as decimal separators (e.g., $1,000,000.00). However, other regions may use periods as thousand separators and commas as decimal separators (e.g., $1.000.000,00). If a system misinterprets these separators, it can drastically alter numerical values. For instance, a revenue figure of $1,344,234,422.00 might be misinterpreted as $1.34 if a period is incorrectly treated as a decimal separator. This seemingly small error can significantly skew calculations, visualizations, and ultimately, business decisions.
In this blog post, we will explore common data quality issues, discuss how to identify them, and outline strategies for remediation. By addressing these issues proactively, organizations can ensure that their data is accurate, consistent, and trustworthy, enabling them to make informed decisions and drive business success.
How Users Notice Data Quality Issues
Data quality issues often manifest in highly visible ways, particularly within dashboards and reports, where they can distort visualizations, create inconsistencies, and undermine the credibility of the data. Users are quick to notice these anomalies, which can lead to frustration, distrust, and a reluctance to rely on data for decision-making.
One of the most common ways users spot data quality issues is through the distortion of visualizations. Outliers, or extreme values, can dramatically skew charts and graphs, making it difficult to discern meaningful trends. For instance, a single abnormally high sales figure can dwarf all other values, rendering the visualization ineffective. Similarly, incorrect or placeholder values, such as a default date of “1900-01-01,” can create misleading patterns in time-series visualizations.
Inconsistent data, such as duplicate entries with variations in capitalization (e.g., “New York” vs. “NEW YORK”), can also be readily apparent in dashboards and reports. These inconsistencies create confusion and raise questions about the accuracy and completeness of the data.
The goal of data quality management is to proactively identify and resolve these issues before they impact users. By implementing robust data quality checks and remediation processes, organizations can ensure that their data is accurate, consistent, and trustworthy, fostering confidence in data-driven insights and decisions.
How to Detect and Fix Common Data Quality Issues
Proactive data quality management is essential to prevent data quality issues from impacting users and undermining trust in data. Rather than reacting to user complaints, data teams should strive to identify and resolve issues before they affect downstream systems and processes.
Data observability platforms offer a powerful solution for continuous data quality monitoring. These platforms leverage machine learning and advanced analytics to automatically detect anomalies, inconsistencies, and other data quality issues. When a problem is identified, the platform alerts data engineers and data stewards, enabling them to take swift corrective action.
Several methods can be employed to address data quality issues:
- Source System Remediation: Collaborating with application developers to implement data validation rules at the point of entry can prevent many issues from arising in the first place. This may involve adding constraints to input fields, implementing validation checks, or providing real-time feedback to users.
- Automated Data Cleansing: Data transformation and cleansing processes can automatically address certain issues during data ingestion or processing. This can include standardizing data formats, correcting inconsistencies, and applying business rules to ensure data validity.
- Data Enrichment and Lookups: Leveraging external data sources or master data management systems can help fill in missing values, correct inaccuracies, and enrich data with additional context. This may involve performing lookups against reference databases or using data matching techniques to identify and reconcile inconsistencies.
- Manual Data Stewardship: For complex or nuanced issues, manual data stewardship may be necessary. Data stewards can review data, investigate anomalies, and apply corrections based on their domain expertise and knowledge of data quality standards.
In the following sections, we will delve into specific data quality issues and provide tailored recommendations for detection and remediation. By understanding the nature of these issues and employing appropriate strategies, organizations can establish a robust data quality framework that ensures data accuracy, consistency, and trustworthiness.
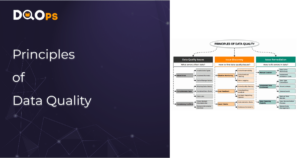
Value-Level Data Quality Issues
These issues relate to the individual values within a dataset and their accuracy or validity.
Extreme Values
Extreme values, or outliers, are data points that significantly deviate from the rest of the data, potentially skewing analysis and visualizations. For example, a daily revenue report might show a sudden spike of $100 million due to a single incorrect invoice entry. These extreme values are often easily spotted in charts and graphs as they distort the scale, making other data points appear insignificant.
How to detect: Use data observability platforms, visualizations like charts and histograms, or statistical analysis like standard deviation calculations to identify outliers.
How to fix: Implement data validation rules at the point of data entry to prevent extreme values, and then cleanse existing data by removing or transforming the outliers, but only after investigating the cause of the extreme value.
Values That Make No Sense
Values that make no sense are illogical or impossible data points within the context of the data, often indicating errors in data entry or processing. For example, a stock count showing -50 units of a product is illogical. These nonsensical values often stand out when reviewing the data, as they contradict common sense or known constraints.
How to detect: Carefully examine the data visually, utilize data profiling tools, or define and apply business rules to identify illogical values.
How to fix: Implement data validation rules to prevent these values, cleanse existing data by correcting or imputing values, and investigate the source to address underlying data quality issues.
Fake Values
Fake values are placeholder values used to represent missing or unknown data, which can potentially skew analysis and mislead users. An example is using “1900-01-01” as a placeholder for missing dates. These fake values can often be identified by their frequency or unnatural patterns within the data.
How to detect: Scan the data visually, use data profiling tools to identify frequently occurring placeholders, or compare data values against a data dictionary.
How to fix: Handle missing data appropriately using NULL values or specific codes instead of fake values, cleanse existing data, and review code to correct the use of fake values.
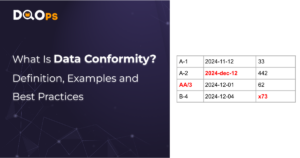
Future Dates
Future dates are date values that occur after the current date. While some future dates may be valid (e.g., scheduled appointments), unreasonably far future dates often indicate errors. For example, an order placed with a date of “2030-01-01” would be suspicious. These future dates can be identified by sorting data chronologically or comparing dates to the current date.
How to detect: Review the data visually, compare date values, use data profiling tools, or define business rules that specify acceptable date ranges.
How to fix: Implement data validation rules to prevent future dates, cleanse existing data by correcting errors, and investigate the source of future dates to address underlying issues.
Missing Required Values
Missing required values occur when essential data fields are left blank, disrupting workflows and hindering data usability. For example, a contact record without an email address when email communication is essential would be problematic. These missing values are often noticeable when sorting data, as they typically appear at the top or bottom of the list.
How to detect: Use data profiling tools to identify missing values in key fields or perform queries to find records with empty values in required fields.
How to fix: Implement data validation rules to prevent missing values during data entry, and use data cleansing techniques like imputation or lookups to fill in missing values from other sources.
Only Round Values
An overabundance of round values suggests a lack of data granularity or issues with data collection, potentially indicating inaccurate or imprecise data. For example, if website session durations are recorded only in multiples of 10 seconds, even though the system can capture more precise measurements, it suggests a lack of precision. This high frequency of round values can look unnatural and raise suspicion about the data’s accuracy.
How to detect: Analyze the distribution of values and look for an unusually high proportion of round numbers, or use data visualization to identify patterns that indicate a lack of precision.
How to fix: Review data collection methods to ensure sufficient granularity, and if necessary, re-collect data with greater precision or adjust reporting to reflect the actual level of precision.
Placeholder Values
Placeholder values, such as “#N/A” or “None,” are used to represent missing data, which can interfere with data analysis and reporting. For instance, a spreadsheet containing “#N/A” in cells where data is missing can cause errors in calculations. These placeholder values are typically visible when inspecting the data and may appear in reports or dashboards if not handled properly.
How to detect: Use data profiling tools to identify placeholder values, or perform data quality checks to identify values that do not conform to expected data types or formats.
How to fix: Handle missing data appropriately using NULL values, empty fields, or specific codes to represent different types of missing data, and cleanse existing data to replace placeholder values with appropriate values or codes.
Structural Data Quality Issues
These issues concern the organization and structure of the data, impacting how data is arranged and connected.
Inconsistent Data Formats
Inconsistent data formats occur when the same type of data is represented in different ways within a dataset, making it difficult to compare, analyze, and aggregate. For example, phone numbers might be stored as “(555) 123-4567”, “555-123-4567”, and “5551234567” within the same dataset. These inconsistencies are often readily apparent when visually inspecting the data, particularly when sorting or filtering, as different formats may not be grouped together as expected.
How to detect: Scan the data visually, use data profiling tools, or apply regular expressions to identify variations in data formats.
How to fix: Standardize formats for each data type and enforce it through data transformation, data quality rules, and input validation.
Inconsistent Capitalization
Inconsistent capitalization refers to using different capitalization styles for the same words or phrases within a dataset, which can create the appearance of duplicate entries and hinder accurate grouping or comparison. For instance, city names might be recorded as “New York”, “NEW YORK”, and “new york”. This inconsistency is noticeable when visually scanning the data or when sorting alphabetically, as variations in capitalization may cause entries that should be identical to appear as separate items.
How to detect: Review the data visually or use case-sensitive comparisons and data profiling tools to identify capitalization variations.
How to fix: Standardize a capitalization standard (e.g., title case) and apply it through data transformation functions and data quality rules during data entry.
Values in Wrong Columns
Values appearing in incorrect columns indicate data entry or mapping errors, which can lead to significant misinterpretations and incorrect analysis. For example, customer names might appear in the address column, or sales figures might be mistakenly entered in the marketing spend column. These errors can often be spotted by comparing column headers to the data they contain, or by noticing inconsistencies in data types within a column (e.g., numbers appearing in a column intended for text).
How to detect: Use data profiling tools to identify data type mismatches within columns, or visually inspect data for obvious inconsistencies between column headers and values.
How to fix: Correct data entry errors, review and adjust data mapping processes, and implement data validation rules to prevent future occurrences.
Missing Reference Data
Missing reference data, such as product codes or customer IDs, hinders the ability to link and analyze data across different systems. For instance, a sales record might contain a product code that does not exist in the product master data, making it difficult to retrieve product information or perform accurate analysis. Users may encounter errors or inconsistencies when trying to look up information in related systems, or find that reports and analyses are incomplete due to the missing links.
How to detect: Perform data validation checks to ensure that reference data exists in the corresponding master data, or use data profiling tools to identify missing or invalid references.
How to fix: Ensure that reference data is complete and accurate in all systems, implement data quality rules to prevent invalid references, and establish data governance processes to maintain referential integrity.
Temporal Data Quality Issues
These issues relate to the timeliness and consistency of data over time.
Missing Updates
Missing updates occur when recent changes in source systems are not reflected in downstream data, leading to decisions based on outdated information. For instance, a customer might update their address in the CRM system, but the updated address fails to propagate to the marketing database. Users may notice these discrepancies when comparing data across different systems, or observe that expected changes are not reflected in reports or dashboards, potentially causing confusion and hindering effective communication.
How to detect: Compare data across different systems to identify inconsistencies, or monitor data freshness metrics to track the timeliness of updates.
How to fix: Implement real-time or near real-time data integration processes to ensure timely updates, and establish data refresh schedules to regularly update downstream systems.
Missing Time Periods
Missing data for specific time periods creates gaps in trends and hinders analysis of data over time. This might manifest as a daily sales report missing data for a particular day, making it difficult to assess weekly or monthly trends accurately. These missing time periods are often apparent in charts and graphs that display data over time, where gaps or discontinuities will be present, disrupting the visualization and interpretation of trends.
How to detect: Monitor data completeness metrics for each time period, and use data visualization tools to identify gaps in time series data.
How to fix: Investigate the cause of missing data, which may involve identifying data loading errors, addressing data source issues, or recovering lost data. Implement data quality checks to ensure complete data for all expected time periods.
Sudden Jumps in Values
Sudden, unexplained jumps in values can indicate data processing errors, inconsistencies in data collection, or other anomalies that distort trends and hinder accurate analysis. For example, a chart might show a sudden spike in website traffic on a particular day, which could be due to a data processing error that combined two days’ worth of data. These sudden jumps are easily spotted in charts and graphs that display data over time, appearing as sharp, unexpected increases or decreases in values.
How to detect: Use data visualization tools to identify sudden jumps, monitor data for anomalies using statistical process control methods, or compare data to historical trends to identify deviations.
How to fix: Investigate the cause of the jump, which may involve identifying data processing errors, correcting data collection inconsistencies, or adjusting for external factors that may have influenced the data.
Different Values Across Systems
Discrepancies in values between different systems can cause confusion and erode trust in data, especially when users expect consistency. This might involve a customer’s address being different in the CRM system compared to the billing system, leading to confusion and potential errors in communication or record-keeping. Users may notice these discrepancies when comparing data across different systems, or encounter inconsistencies when accessing information from multiple sources, creating uncertainty about which data is correct.
How to detect: Use data deduplication tools to identify duplicate records based on matching criteria, or perform queries to identify records with identical or similar values in key fields.
How to fix: Implement data quality rules to prevent duplicate entries, establish data entry standards to ensure consistency, and use data cleansing techniques to identify and merge or remove duplicate records.
Uniqueness Data Quality Issues
These issues relate to the presence of all necessary data and the absence of redundant data.
Duplicates
Duplicate entries are multiple records representing the same entity, which can inflate counts, skew metrics, and hinder the identification of unique records, ultimately undermining data accuracy and reliability. For example, a customer database might contain two entries for the same customer with slight variations in their name or address. Users might encounter these duplicate entries when searching for records or notice inconsistencies in counts or aggregations, leading to confusion and distrust in the data.
How to detect: Use data deduplication tools to identify duplicate records based on matching criteria, or perform queries to identify records with identical or similar values in key fields.
How to fix: Implement data quality rules to prevent duplicate entries, establish data entry standards to ensure consistency, and use data cleansing techniques to identify and merge or remove duplicate records.

Data quality best practices - a step-by-step guide to improve data quality
- Learn the best practices in starting and scaling data quality
- Learn how to find and manage data quality issues
How Data Quality Issues Decrease Data Trustfulness
Trustworthy data is crucial for sound decision-making. Data quality issues erode this trust, leading to skepticism and hindering data-driven initiatives.
When users encounter inconsistencies, errors, or anomalies—like duplicate entries or illogical values—they lose confidence in the data and may question the validity of analyses and reports. This can prompt time-consuming manual verification and foster a culture of distrust.
To build data trust, organizations must prioritize data quality management. Continuous validation, coupled with transparent reporting of data quality metrics, assures users of data reliability. Data observability platforms like DQOps offer solutions for monitoring data quality, automatically detecting anomalies, and empowering data teams to maintain data integrity. By prioritizing data quality, organizations cultivate a data-driven culture built on trust and confidence.
How Data Observability Detects Common Data Quality Issues
Data observability provides a proactive approach to data quality management by continuously monitoring data for issues and alerting teams to potential problems. Unlike traditional data quality solutions that often rely on predefined rules and thresholds, data observability platforms leverage machine learning and time-series analysis to detect anomalies and unusual behavior.
By tracking historical data and identifying trends, these platforms can quickly spot outliers, inconsistencies, and other data quality issues that may otherwise go unnoticed. For example, they can detect sudden spikes or drops in values, identify missing data points, or flag inconsistencies in data formats. This real-time monitoring enables data teams to address issues promptly, preventing them from impacting downstream systems and users.
Data observability platforms offer several advantages over traditional approaches:
- Proactive Issue Detection: Identify problems before they impact users.
- Automated Monitoring: Continuously monitor data quality without manual intervention.
- AI-Powered Insights: Leverage machine learning to detect anomalies and patterns.
- Historical Context: Track data trends and identify deviations from expected behavior.
By implementing data observability, organizations can ensure data quality, build trust in data, and foster a data-driven culture.
What is the DQOps Data Quality Operations Center
DQOps is a data observability platform designed to monitor data and assess the data quality trust score with data quality KPIs. DQOps provides extensive support for configuring data quality checks, applying configuration by data quality policies, detecting anomalies, and managing the data quality incident workflow.
DQOps is a platform that combines the functionality of a data quality platform to perform the data quality assessment of data assets. It is also a complete data observability platform that can monitor data and measure data quality metrics at table level to measure its health scores with data quality KPIs.
You can set up DQOps locally or in your on-premises environment to learn how DQOps can monitor data sources and ensure data quality within a data platform. Follow the DQOps documentation, go through the DQOps getting started guide to learn how to set up DQOps locally, and try it.
You may also be interested in our free eBook, “A step-by-step guide to improve data quality.” The eBook documents our proven process for managing data quality issues and ensuring a high level of data quality over time. This is a great resource to learn about data quality.