What is data quality
In 2024, data quality has emerged as the most critical factor in the success of data analytics and machine learning projects. Poor data quality, riddled with errors, inconsistencies, and gaps, renders data useless for its intended purpose. This directly leads to flawed insights, inaccurate predictions, and ultimately, failed AI and analytics initiatives. To combat this growing problem, organizations are turning to advanced technologies like data quality and data observability platforms. However, simply implementing these tools is not enough. Businesses must establish robust processes to proactively manage and monitor data quality across their entire data ecosystem.
Table of Contents
Data quality maturity levels
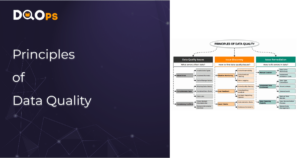
In this article, we delve into the concept of a data quality maturity model, drawing inspiration from a well-established data analytics maturity model. This framework consists of four distinct levels: descriptive data quality (understanding what happened), diagnostic data quality (investigating why it happened), predictive data quality (forecasting what might happen), and prescriptive data quality (determining what actions to take). By applying this model, organizations can assess their current level of data quality maturity and chart a clear path towards improvement.
The data quality maturity level ladder is shown on the following graphics.

Descriptive Data Quality
Descriptive data quality forms the bedrock of any data quality initiative. At this initial stage, the focus is on establishing a clear understanding of your data’s fundamental characteristics. Are there missing values? Are there inconsistencies in how data is formatted? How timely is the data, and does it reflect the latest information? By answering these questions, you can define key data quality metrics that directly align with your business objectives.
To achieve descriptive data quality, organizations often turn to data contracts. These contracts serve as a formal agreement between data producers and consumers, outlining the expected structure, format, and content of the data. This ensures everyone is on the same page and helps prevent misunderstandings or misinterpretations down the line. Additionally, rule-based data quality checks are implemented to automatically validate data against predefined criteria. These checks can be triggered manually, integrated into data pipelines, or scheduled to run on a regular basis using a standalone data quality platform.
It’s important to note that many common data quality checks, such as those embedded in Dbt or DataPlex pipelines, fall under this descriptive category. These tools typically rely on hardcoded rules and don’t leverage historical data to identify anomalies. While effective in catching basic errors, they have limitations when it comes to detecting more subtle data quality issues that may require a deeper analysis of historical trends. The results of these checks are often reported as pipeline failures, which, while helpful in alerting to immediate problems, may not provide the comprehensive insights needed for a holistic understanding of data quality over time.
Diagnostic Data Quality
Once you have a firm grasp of your data’s current state through descriptive metrics, you can progress to diagnostic data quality. This level goes beyond identifying surface-level issues; it delves into the underlying causes of those problems. By employing sophisticated data quality checks and data profiling techniques, you can pinpoint anomalies, inconsistencies, and trends that shed light on the root causes of data quality issues.
Diagnostic data quality builds upon the foundation of descriptive data quality, expanding the toolkit with capabilities that analyze statistical properties, detect changes over time, and uncover hidden patterns. Data profiling tools play a crucial role in this process, enabling you to examine data distributions, identify outliers, and understand the frequency of different values. This deeper level of analysis can reveal, for example, a sudden influx of invalid email addresses due to a change in a data entry form or a gradual increase in missing values in a specific field due to a data source issue.
To make this process more accessible and actionable, a data quality experimentation module with a user-friendly interface is essential. This module should allow users to easily define hypotheses about desired data quality levels and validate them with instantly activated, tweaked, and deactivated data quality checks. Additionally, data quality dashboards that enable drilling through and visualizing historical data quality issues are invaluable. These dashboards should provide insights into which data assets are most frequently affected by quality problems, ideally through data quality KPIs that quantify the percentage of passed checks for each data quality dimension. By understanding these patterns, you can prioritize remediation efforts and focus on the areas that will have the most significant impact on overall data quality.
Predictive Data Quality
Predictive data quality is a proactive approach to data quality management. By analyzing historical data quality trends and leveraging machine learning and data science techniques, you can anticipate future issues before they negatively impact downstream processes. This level goes beyond merely reacting to problems as they occur; it enables you to get ahead of the curve and prevent data quality issues from arising in the first place.
For example, you could develop a machine learning model that analyzes historical patterns in your data to predict when specific fields are likely to experience an increase in missing values or inconsistencies. This allows you to proactively address these issues before they snowball and cause significant problems. Predictive data quality can also be used to assess the risk associated with new data sources before integrating them into your existing systems, ensuring that they align with your data quality standards.
Data observability platforms play a crucial role in achieving predictive data quality. These platforms employ anomaly detection on time series data to identify unusual patterns, such as unexpected increases in data volume or irregular delays in data delivery. However, it’s important to note that not all data observability platforms are created equal. While some may offer advanced anomaly detection capabilities using machine learning, they might lack the comprehensive data quality checks, customizable data quality dashboards, and data profiling and experimentation features necessary for a holistic data quality solution. Without these capabilities, these platforms are essentially limited to descriptive data quality, even if they incorporate AI-powered anomaly detection. To truly unlock the potential of predictive data quality, organizations need a platform that offers a comprehensive suite of data quality tools and capabilities.
Prescriptive Data Quality
Prescriptive data quality represents the pinnacle of data quality maturity. It empowers organizations to not only identify and predict potential data quality issues but also to proactively address them through automated remediation and continuous improvement. At this level, machine learning algorithms can be trained to recognize patterns indicative of data quality problems. Once an issue is detected, the system can automatically trigger predefined workflows to cleanse, correct, or otherwise resolve the problem. For instance, if a machine learning model identifies a sudden spike in missing values for a particular data field, it can automatically populate those values with appropriate defaults or flag the records for manual review. Prescriptive data quality also extends to recommending improvements over time, leveraging machine learning to suggest new data quality rules or cleansing techniques based on observed trends.
This final stage in data quality maturity is geared towards long-term data platform maintenance, reducing the manual effort required for assessing and fixing data quality issues. As organizations implement the earlier maturity levels – descriptive, diagnostic, and predictive – they accumulate a wealth of data quality information and tools. However, this often leads to a continuous stream of notifications about potential or recurring issues, which can overwhelm data teams. To address this challenge, prescriptive data quality requires a platform that supports self-calibration to minimize false positives and the ability to group related data quality issues into larger incidents that can be assigned to the appropriate team for resolution. This streamlined approach ensures that data quality issues are handled efficiently and effectively, freeing up valuable resources and allowing organizations to focus on extracting insights from their data.
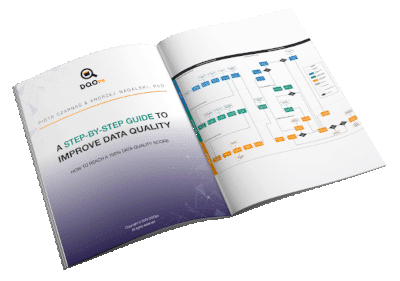
Data quality best practices - a step-by-step guide to improve data quality
- Learn the best practices in starting and scaling data quality
- Learn how to find and manage data quality issues
What is the DQOps Data Quality Operations Center
DQOps is a data quality platform designed to monitor data and assess the data quality trust score with data quality KPIs. DQOps provides extensive support for configuring data quality checks, applying configuration by data quality policies, detecting anomalies, and managing the data quality incident workflow.
The extensive API provided by DQOps allows full automation of all aspects of the platform, ranging from data discovery, data profiling, data quality testing, data observability, data quality incident management, and data quality reporting using 50+ data quality dashboards. DQOps also comes with the most extensive list of data quality checks, having more than 150 built-in checks, which allow to make data quality experiments and validate data from various criteria.
You can set up DQOps locally or in your on-premises environment to learn how DQOps can monitor data sources and ensure data quality within a data platform. Follow the DQOps documentation, go through the DQOps getting started guide to learn how to set up DQOps locally, and try it.
You may also be interested in our free eBook, “A step-by-step guide to improve data quality.” The eBook documents our proven process for managing data quality issues and ensuring a high level of data quality over time.