Last updated: October 04, 2024
How to detect empty or incomplete tables using data quality checks
This sample shows how to use the DQOps platform to detect empty tables and view the results on data quality dashboards.
Overview
This example verifies that the table is not empty and meets the size requirements.
PROBLEM
America's Health Rankings provides an analysis of national health on a state-by-state basis by evaluating a historical and comprehensive set of health, environmental and socioeconomic data to determine national health benchmarks and state rankings.
The platform analyzes more than 340 measures of behaviors, social and economic factors, physical environment and clinical care data. Data is based on public-use data sets, such as the U.S. Census and the Centers for Disease Control and Prevention’s Behavioral Risk Factor Surveillance System (BRFSS), the world’s largest annual population-based telephone survey of over 400,000 people.
For any database analysis, empty or incomplete data can significantly hinder analysis and lead to inaccurate conclusions.
In this example, we will detect that the table is not empty and meet the size requirement.
SOLUTION
DQOps offers built-in data quality policies that address common issues like table emptiness. You will run the row_count table check to validate if the table is not empty.
Once we confirm the table is not empty, the DQOps rule miner engine can help us automatically set higher thresholds to monitor if the table size meets our size requirements.
VALUE
If the number of rows in a table falls below a set threshold, DQOps will create an incident and can send a notification to relevant stakeholders.
Run check activated by data quality policies
To detect empty tables daily, we can take advantage of DQOps' built-in data quality policy Detect empty tables daily, which activates the daily_row_count check.
Navigate to Monitoring checks editor
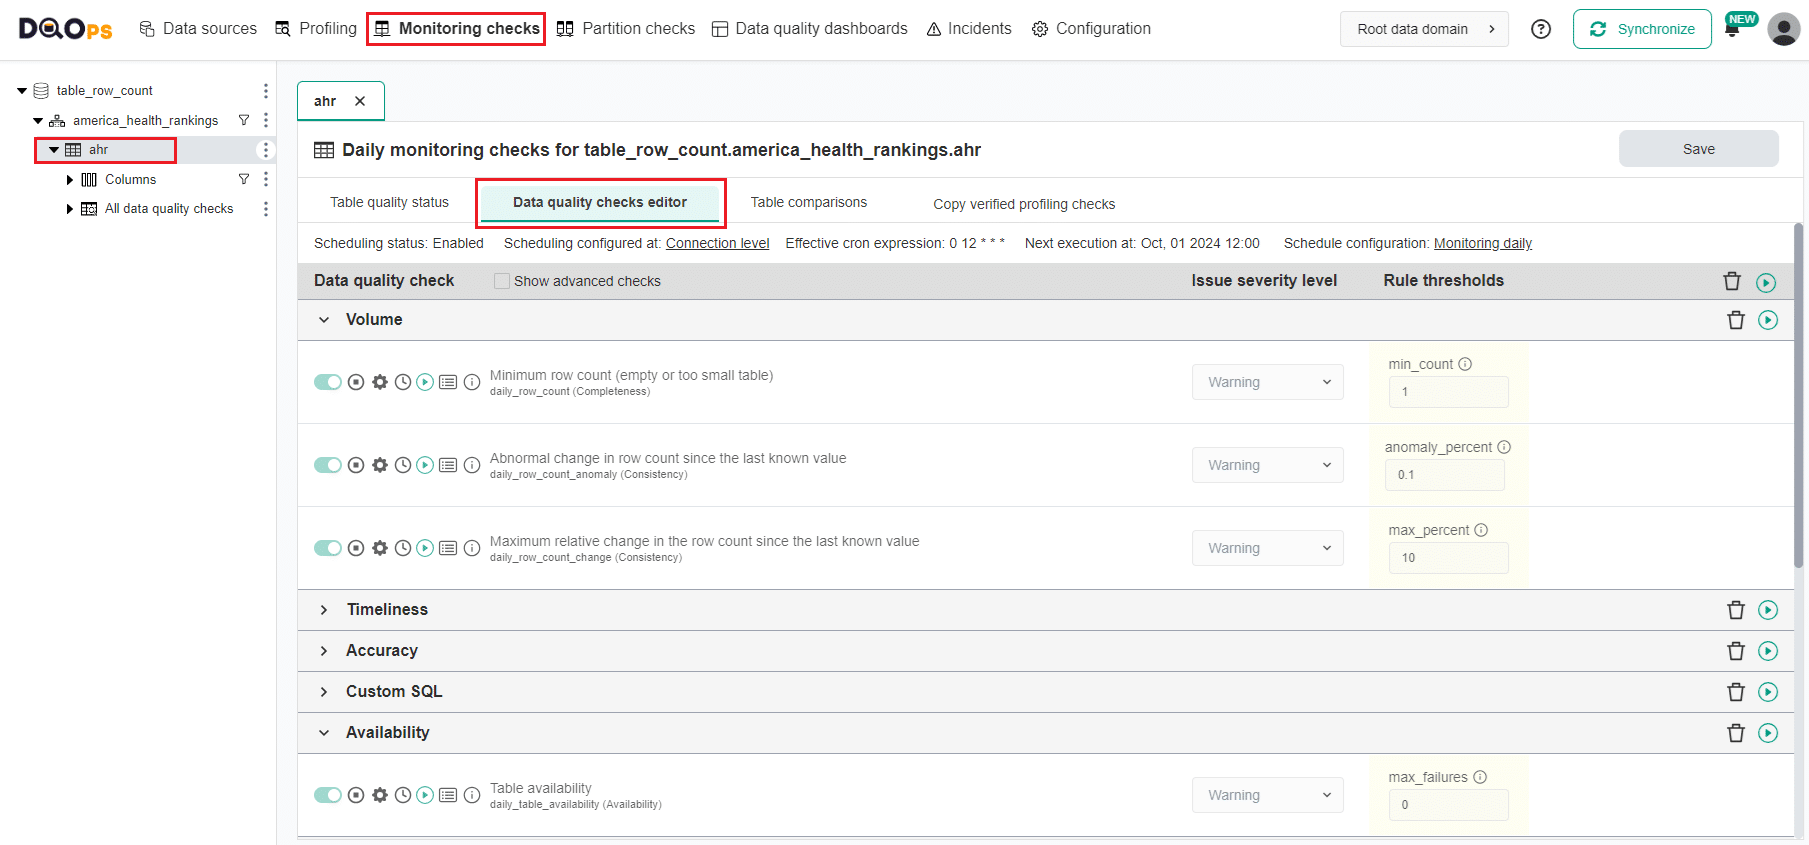
To explore a list of monitoring checks activated by the built-in data quality policies, we will navigate to the Data quality checks editor:
- Click on the Monitoring checks section.
- Select the
ahrtable from the tree view on the left. - Click on the Data quality checks editor tab.
The table with data quality checks contains a list of checks divided into different data quality subcategories.
You can learn more about the Check editor on the concept page.
Run checks
Run the activated row_count check using the Run check button.
You can also run all table checks using the Run check button located in the top right corner of the table.
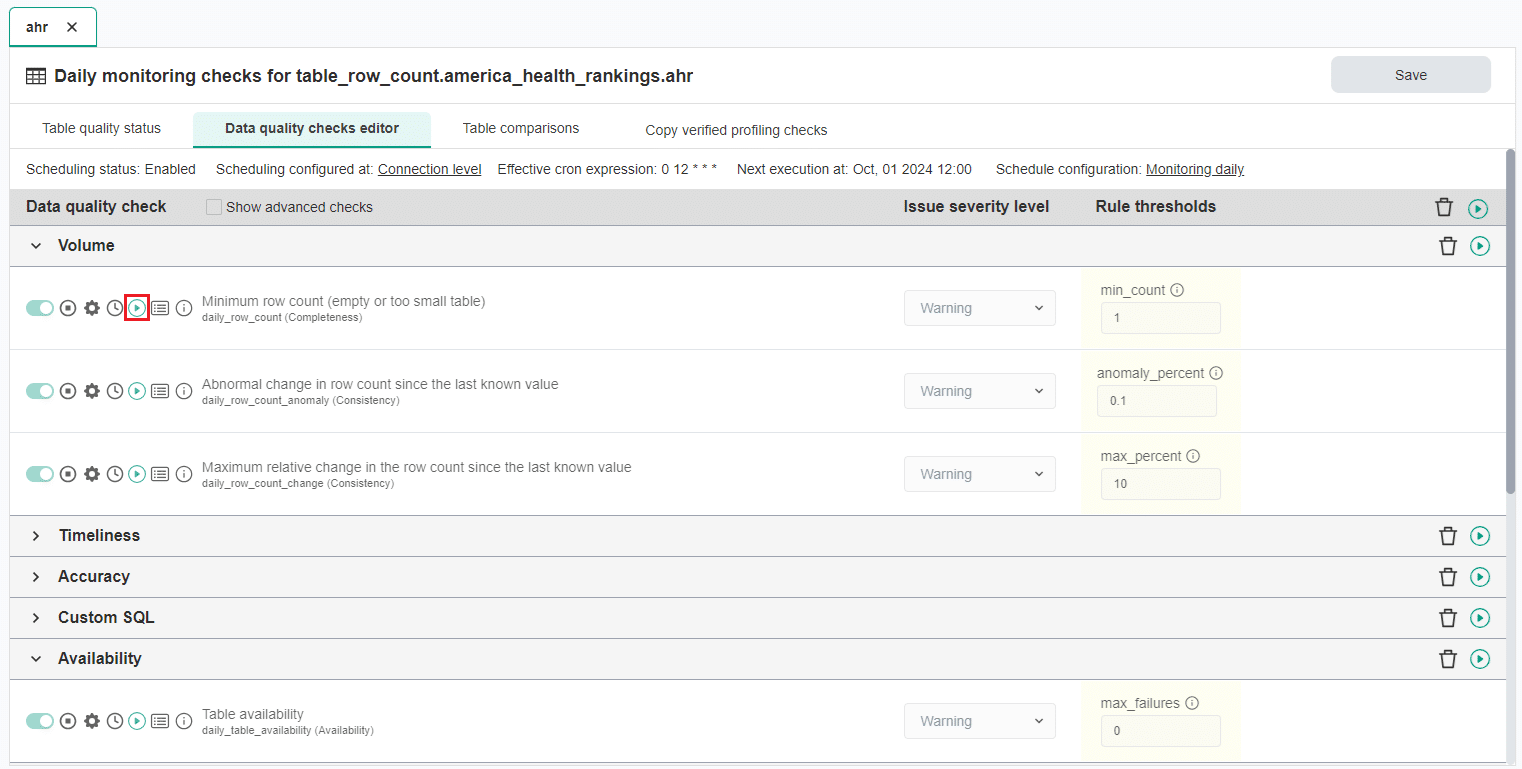
A green square should appear next to the name of the checks indicating the correct result.
You can find more information about running checks in the Working with DQOps section.
View detailed check results
Access the detailed results by clicking the Results button. The results should be similar to the one below.
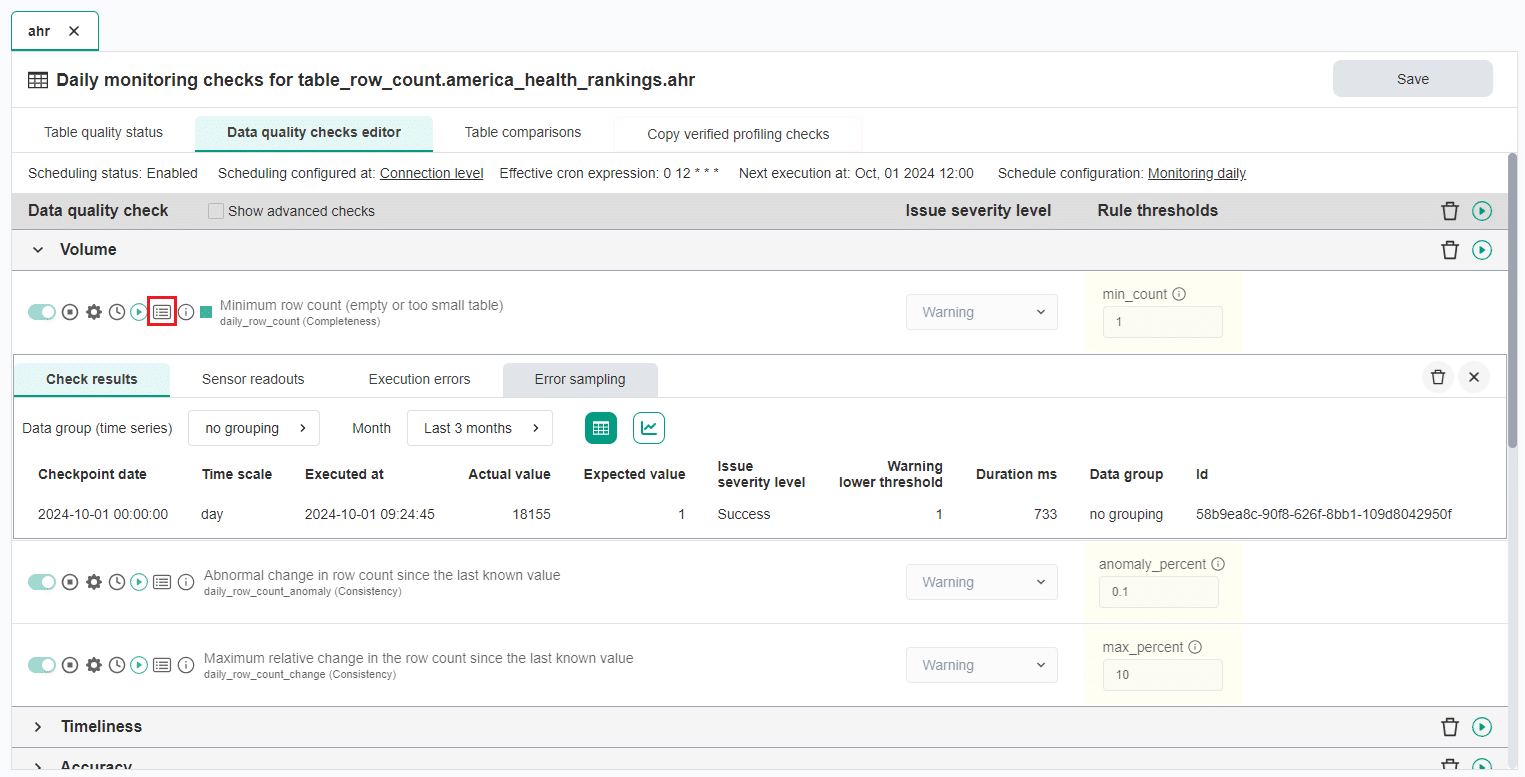
In the Results window, you will find four tabs: Check results, Sensor readouts, Execution errors, and Error sampling.
- The Check results tab shows the severity level resulting from the verification of sensor readouts based on set rule thresholds.
- The Sensor readouts tab displays the values obtained by the sensors from the data source.
- The Execution errors tab displays any errors that occurred during the check's execution.
- The Error sampling tab allows you to view representative examples of data that fail to meet specified data quality criteria.
The actual value of rows in this example is 18155, which is above the min_count rule threshold warning severity level of 1.
The check gives a correct result, providing assurance that your table is not empty.
Validation that the table meets the size requirements
After confirming that your table is not empty, you can set higher thresholds to ensure that the table meets size requirements. Setting threshold can be done automatically using the rule miner engine.
Collect basic data profiling
To propose a configuration of data quality checks, the rule miner requires basic data statistics.
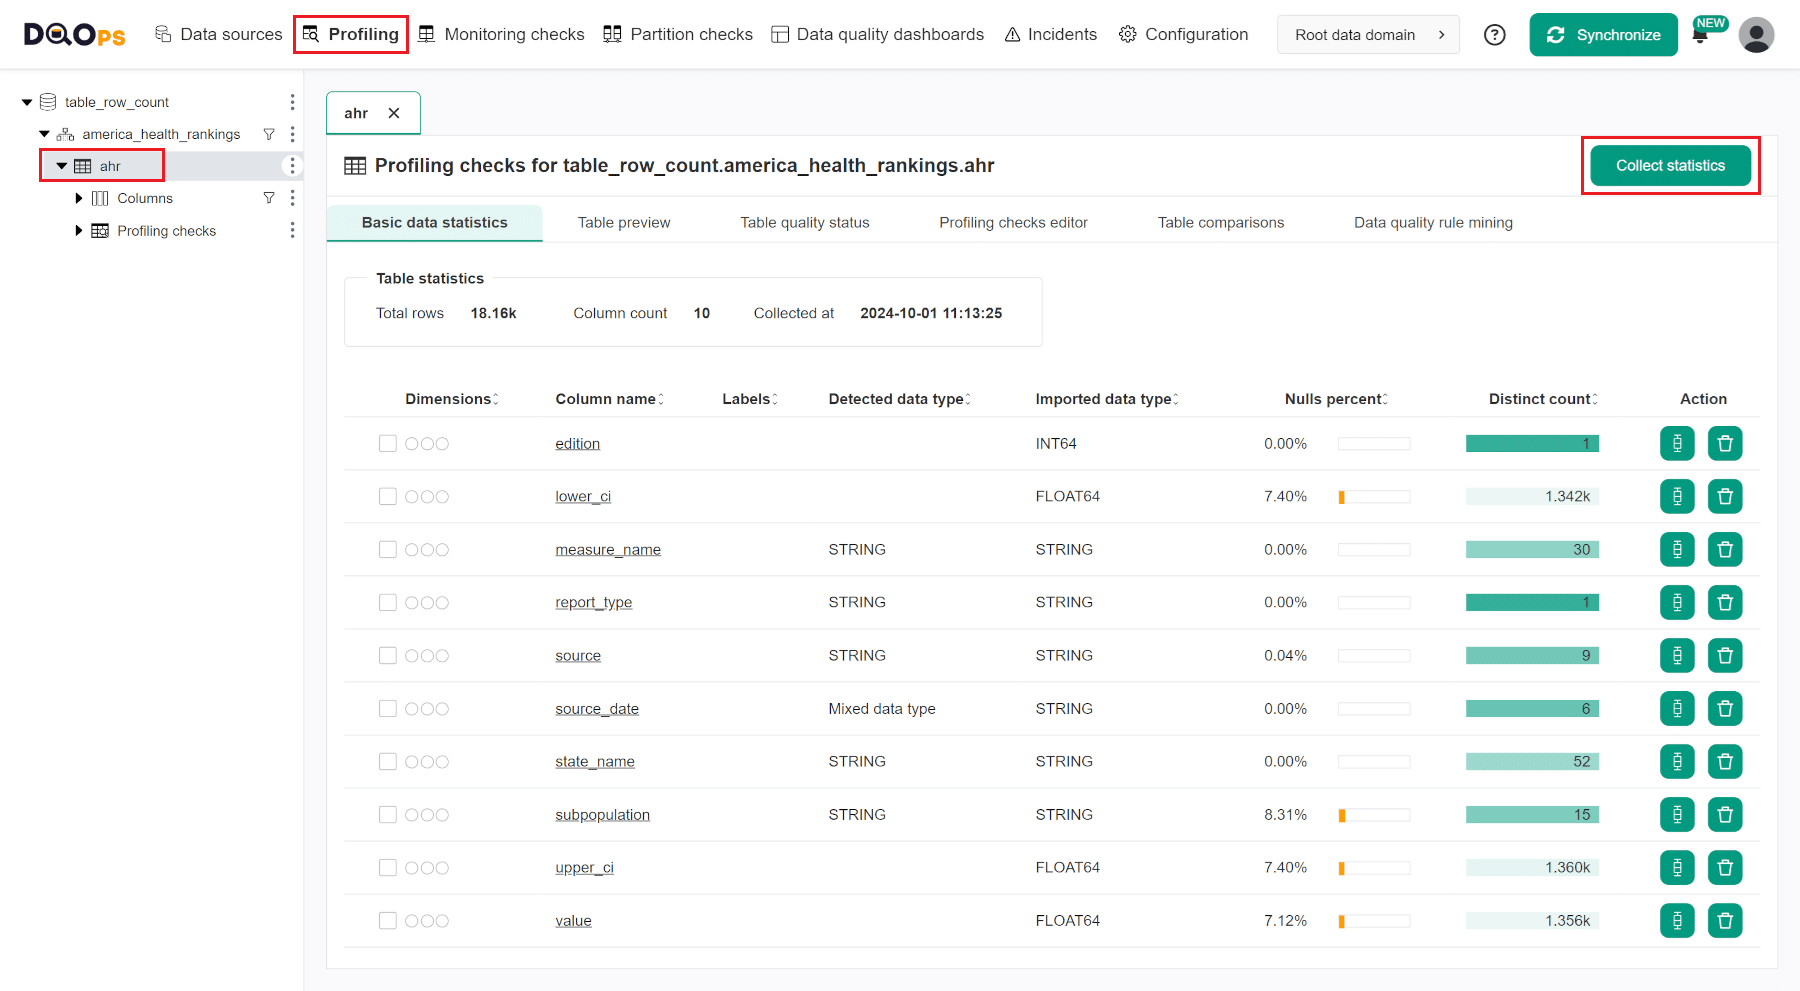
Follow these steps to collect basic data statistics:
- Navigate to the Profiling section.
- Select the
ahrtable from the tree view on the left. This will open the Basic data statistics tab. - Click on the Collect statistics.
This will collect the basic statistics for the table and all columns, as shown on the screen below.
Learn more about basic statistics in the Working with DQOps section.
Propose a configuration of data quality check using rule mining
After collecting the basic statistics, the rule mining screen can propose a configuration of data quality checks. To navigate to the rule miner, click on the Data quality rule mining tab in the Profiling section.
The rule mining screen allows you to view and select the automatically proposed configuration of data quality checks. DQOps proposes a list of data quality checks instantly upon entering the rule mining screen.
You can use filters to narrow down the list of data quality check proposals. Filter the results to include only checks from the volume category by entering "volume" in the Check category input field.
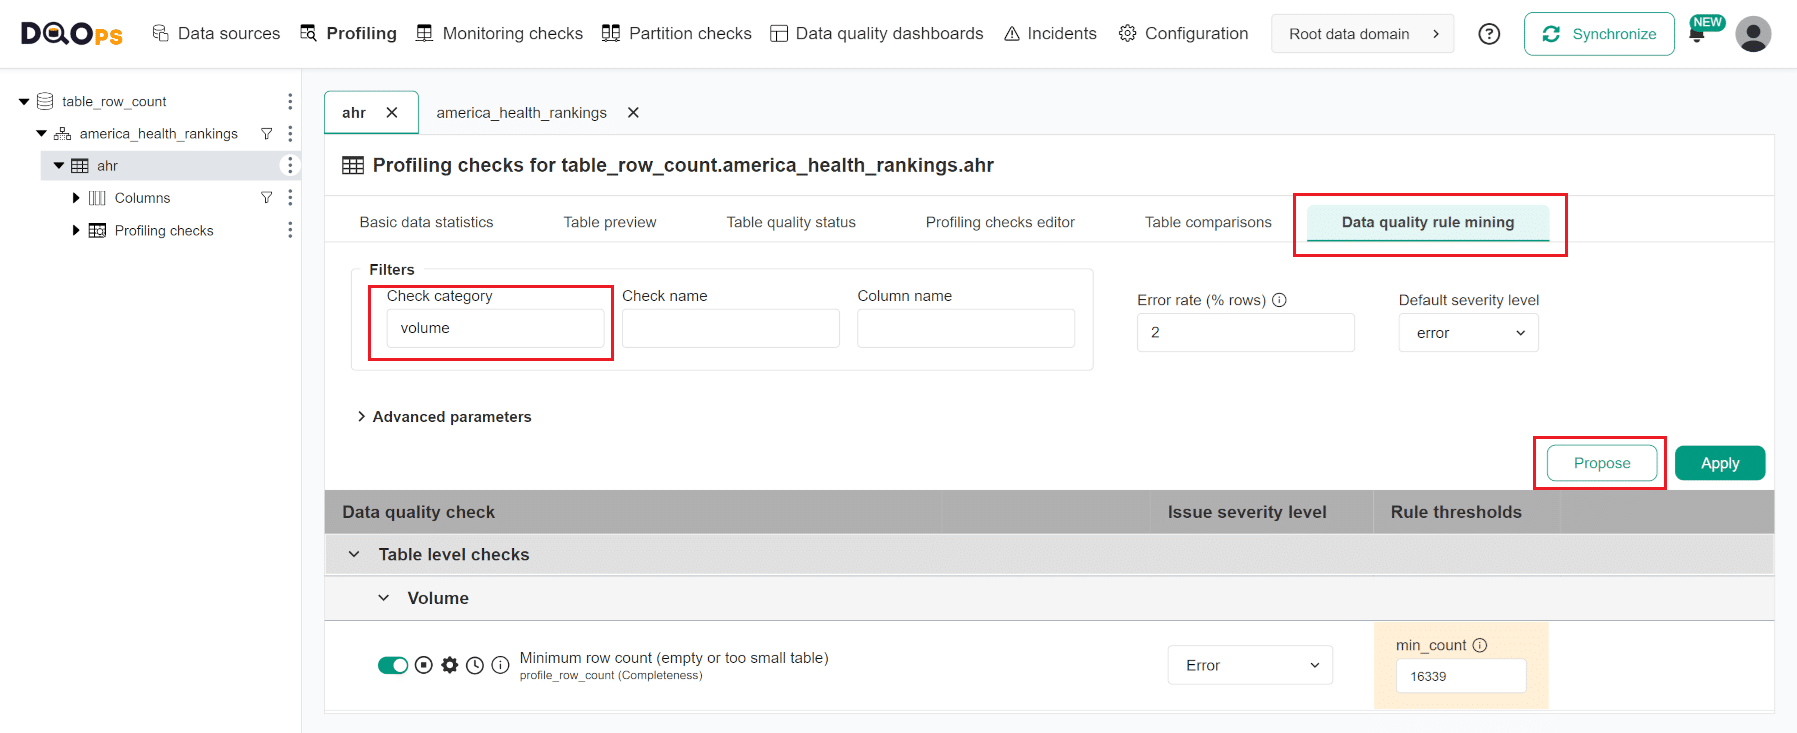
You will see a proposition of profile_row_count check configuration that will raise an error if the minimum count of rows fails below 16,339.
Pressing the Apply button saves the configuration of data quality checks and their rules. A popup window will appear, notifying you that the checks have been activated and that you can run the activated check by clicking on the Confirm button.
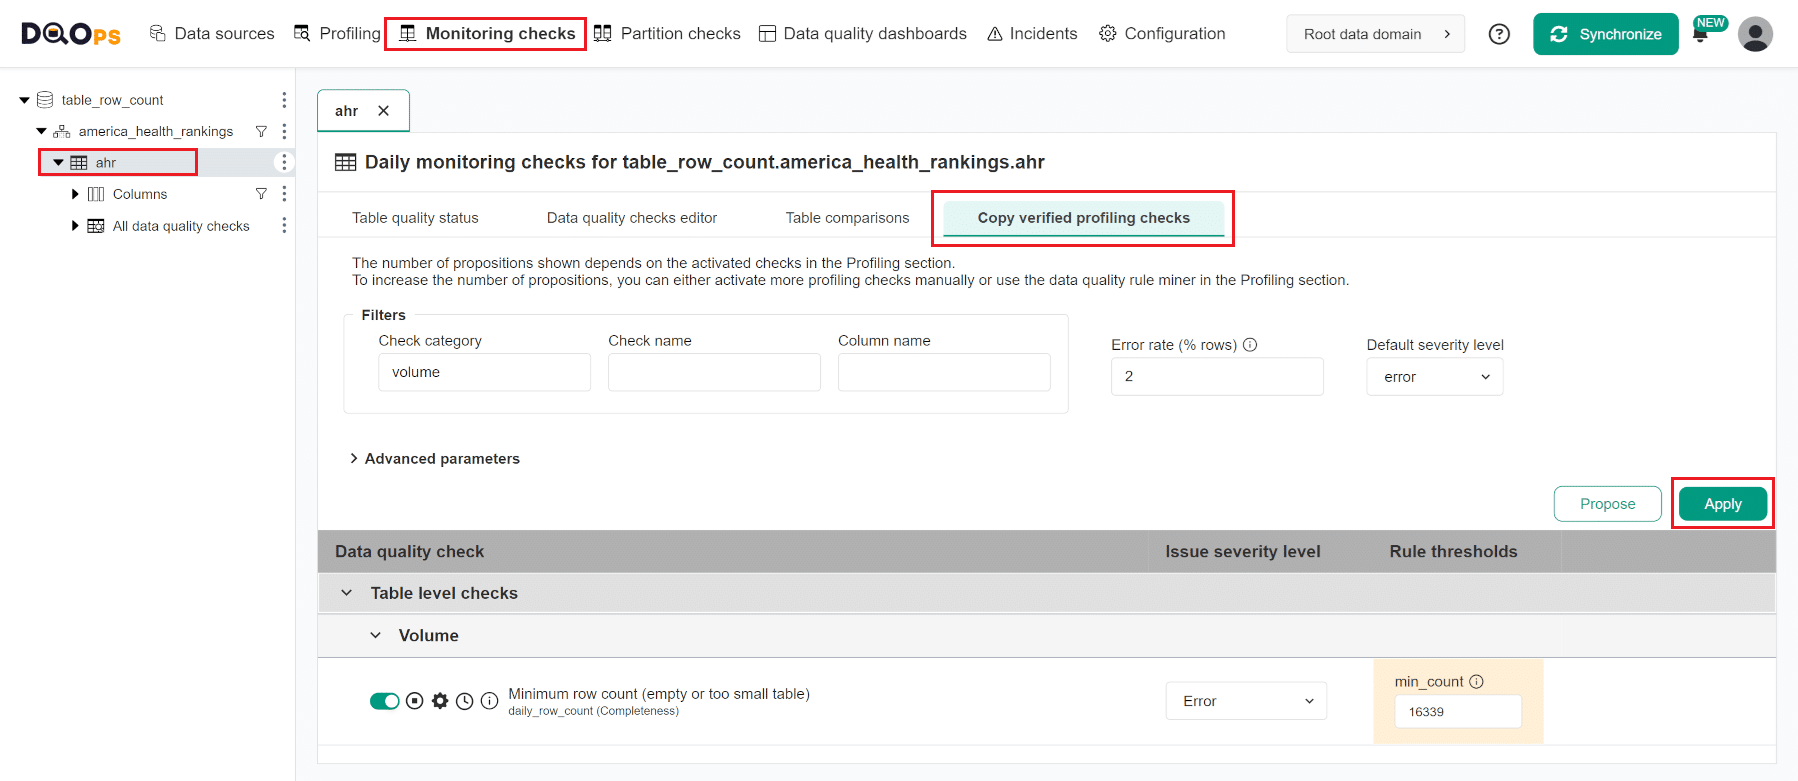
Copy the verified profiling check to the monitoring checks
To start monitoring data quality using a newly configured check we need to copy the configuration of the row_count check in the Profiling section to the Monitoring checks:
- Navigate to the Monitoring checks section.
- Select the table from the tree view on the left.
- Click on the Copy verified profiling checks tab.
- Click the Apply button.
- Click the Confirm button in the popup to run configured checks.
The highlighted fragments in the YAML file below represent the segment where the profiling and monitoring row_count checks are configured.
apiVersion: dqo/v1
kind: table
spec:
  incremental_time_window:
    daily_partitioning_recent_days: 7
    monthly_partitioning_recent_months: 1
  profiling_checks:
    volume:
      profile_row_count:
        error:
          min_count: 16339
  monitoring_checks:
    daily:
      volume:
        daily_row_count:
          error:
            min_count: 16339
  columns:
    edition:
      type_snapshot:
        column_type: INT64
        nullable: true
    report_type:
      type_snapshot:
        column_type: STRING
        nullable: true
Review Table quality status
After the Run checks job finishes, you can review the summary of the identified data quality issues on the Table quality status screen. Click on the Table quality status tab to navigate to that screen.
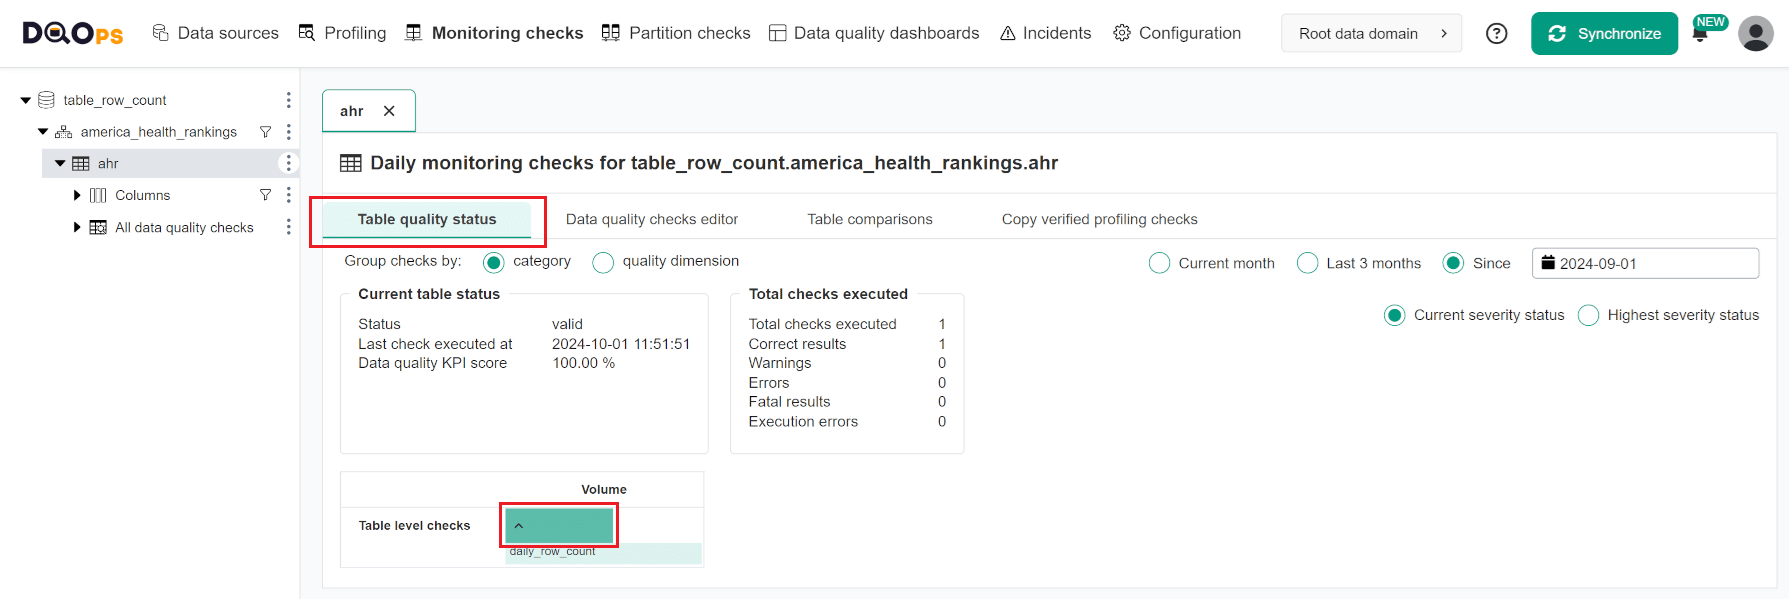
The Table quality status screen summarizes data quality issues identified for each column and each category of data quality checks. It includes the number of executed checks and detailed results per table and columns grouped by check categories or data quality dimensions. DQOps calculates a data quality KPI score, which is measured as the percentage of data quality checks that passed successfully.
At the bottom of the screen, you will find a table that displays the check results per category, table, and column.
The colored boxes indicate the current or the highest severity status: green for a correct result, yellow for a warning, orange for an error, red for a fatal error, and grey stripes for an execution error.
You can click on the colored box to view a list of checks that contribute to the result. Hovering over the check name will provide more details.
In this example, we have demonstrated how to use DQOps to verify that the table is not empty and meets the size requirements. By using the daily_row_count table check, we can monitor the number of rows in a table does not fall below the minimum accepted count. If it does, DQOps will create an incident and can send a notification.
Follow the link to learn how to configure notifications.
Next steps
- You haven't installed DQOps yet? Check the detailed guide on how to install DQOps using pip or run DQOps as a Docker container.
- For details on the row_count check used in this example, go to the check details section.
- You might be interested in another completeness check that evaluates that the number of nulls in a column does not exceed the maximum accepted count.
- Would you like to add your own connection? Here you can find information about supported databases and how to add new connection.
- With DQOps, you can easily customize when the checks are run at the level of the entire connection, table, or individual check. Learn more about how to set schedules here.