Last updated: October 22, 2024
How to verify integrity between columns in different tables by a value lookup data quality check
This sample shows how to use data quality checks to detect integrity between columns in different tables and view the results on data quality dashboards.
Overview
This example shows how to check the referential integrity of a column against a column in another table.
PROBLEM
Federal Information Processing System (FIPS) states codes are numbers which uniquely identify U.S. states and certain other associated areas. A wide audience uses FIPS codes across many private and public datasets to uniquely identify geographic features.
We want to verify that the column labeled state_fips_code in the table containing a list of U.S. counties (fips_codes_all)
only contains values that corresponds to the FIPS state codes listed in a separate table.
SOLUTION
We will check the data of bigquery-public-data.census_utility.fips_codes_all using
lookup_key_found_percent check.
Our goal is to verify that the values in state_fips_code column in fips_codes_all table matches the values in the reference
state_fips_code column in the fips_codes_states table.
In this case we will set the minimum percentage threshold at 99% for the check.
If you want to learn more about checks and threshold levels, please refer to the DQOps concept section.
VALUE
If the percentage of matching data drops below 99%, a error alert will be triggered.
Data structure
The following is a fragment of the bigquery-public-data.census_utility.fips_codes_all dataset. Some columns were omitted for clarity.
The dataset contains a list of all U.S. counties. It includes all counties in the United States (area_name column) with
its specific unique codes (county_fips_code column). The state_fips_code column shows codes that identify each state
and some related regions, which we want to verify.
| summary_level | summary_level_name | state_fips_code | county_fips_code | area_name |
|---|---|---|---|---|
| 050 | state-county | 01 | 01001 | Autauga County |
| 050 | state-county | 02 | 02105 | Hoonah-Angoon Census Area |
| 050 | state-county | 02 | 02290 | Yukon-Koyukuk Census Area |
| 050 | state-county | 04 | 04001 | Apache County |
| 050 | state-county | 05 | 05007 | Benton County |
| 050 | state-county | 06 | 06001 | Alameda County |
| 050 | state-county | 08 | 08121 | Washington County |
| 050 | state-county | 08 | 08123 | Weld County |
| 050 | state-county | 10 | 10001 | Kent County |
| 050 | state-county | 12 | 12003 | Baker County |
The second dataset bigquery-public-data.census_utility.fips_codes_states, which we want to use as a reference, contains
a list of all states and other related regions and with their unique codes (state_fips_code column)
| state_fips_code | state_postal_abbreviation | state_name | state_gnisid |
|---|---|---|---|
| 01 | AL | Alabama | 1779775 |
| 02 | AK | Alaska | 1785533 |
| 04 | AZ | Arizona | 1779777 |
| 05 | AR | Arkansas | 68085 |
| 06 | CA | California | 1779778 |
| 08 | CO | Colorado | 1779779 |
| 09 | CT | Connecticut | 1779780 |
| 10 | DE | Delaware | 1779781 |
| 11 | DC | District of Columbia | 1702382 |
| 12 | FL | Florida | 294478 |
Run the example using the user interface
A detailed explanation of how to start DQOps platform and run the example is described here.
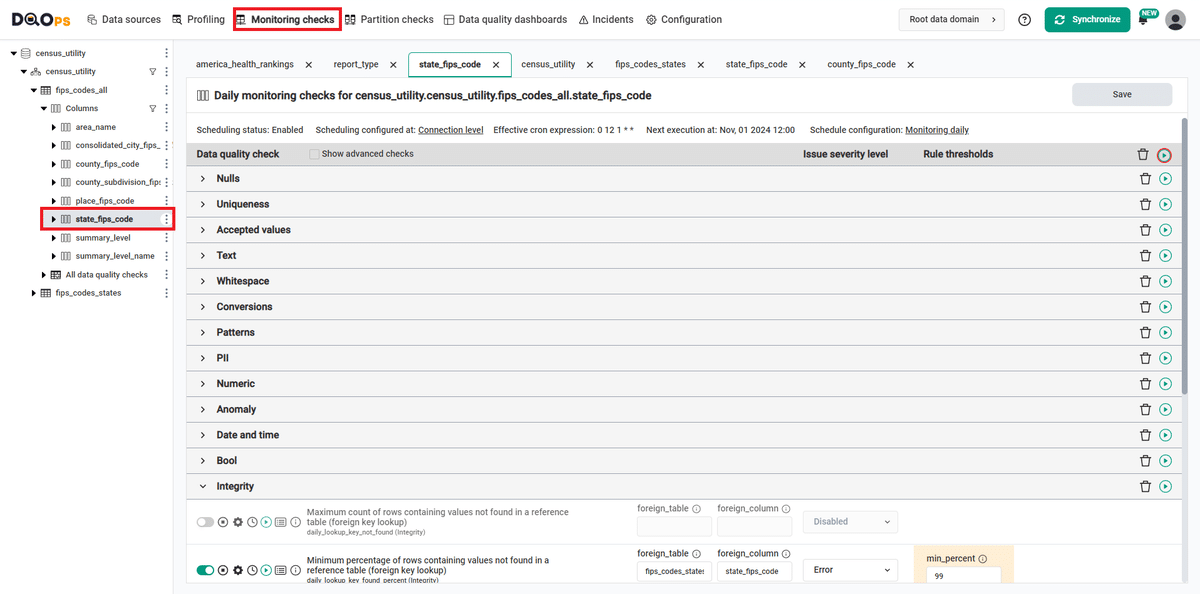
Navigate to a list of checks
To navigate to a list of checks prepared in the example using the user interface:
-
Go to the Monitoring section.
The Monitoring Checks section enables the configuration of data quality checks that are designed for the daily and monthly monitoring of your data source.
-
Select the table or column mentioned in the example description from the tree view on the left.
On the tree view you can find the tables that you have imported. Here is more about adding connection and importing tables.
This tab displays a list of data quality checks in the check editor.
Learn more about navigating the check editor.
The daily_lookup_key_found_percent check has additional parameters foreign_table and foreign_column which should be used
to define the name of the table and column, to be compared to. The name of the table and column should be written as a STRING.
In our example we use names of the table fips_codes_states and column state_fips_code which were also imported.
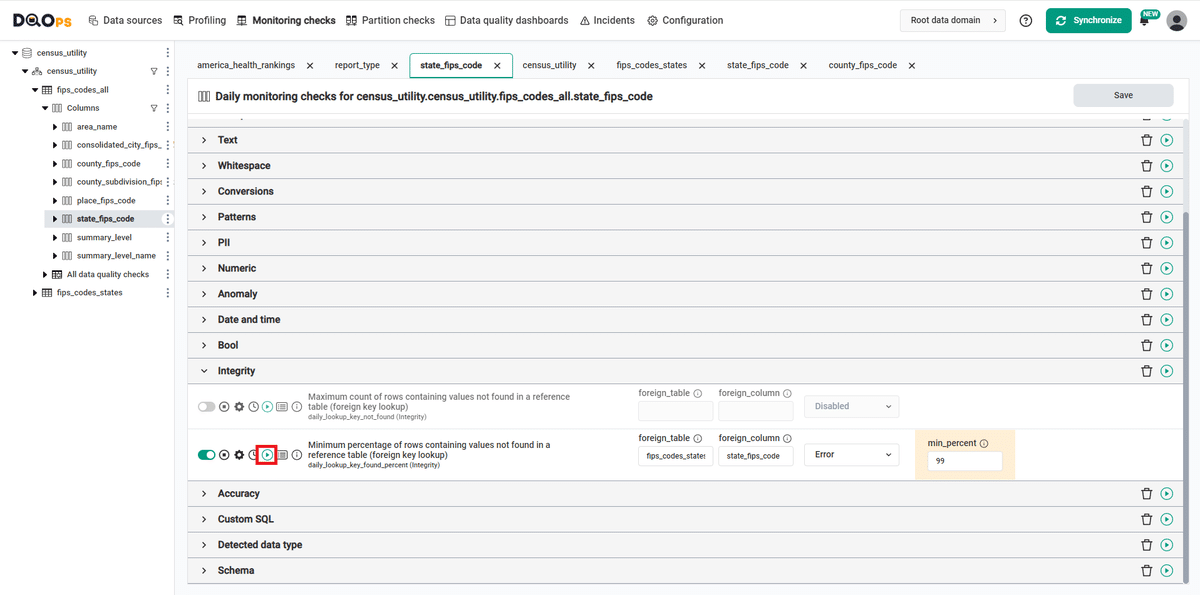
Run checks
Run the activated check using the Run check button.
You can also run all the checks for an entire subcategory of checks using the Run check button at the end of the line with the check subgroup name.
View detailed check results
Access the detailed results by clicking the Results button. The results should be similar to the one below.
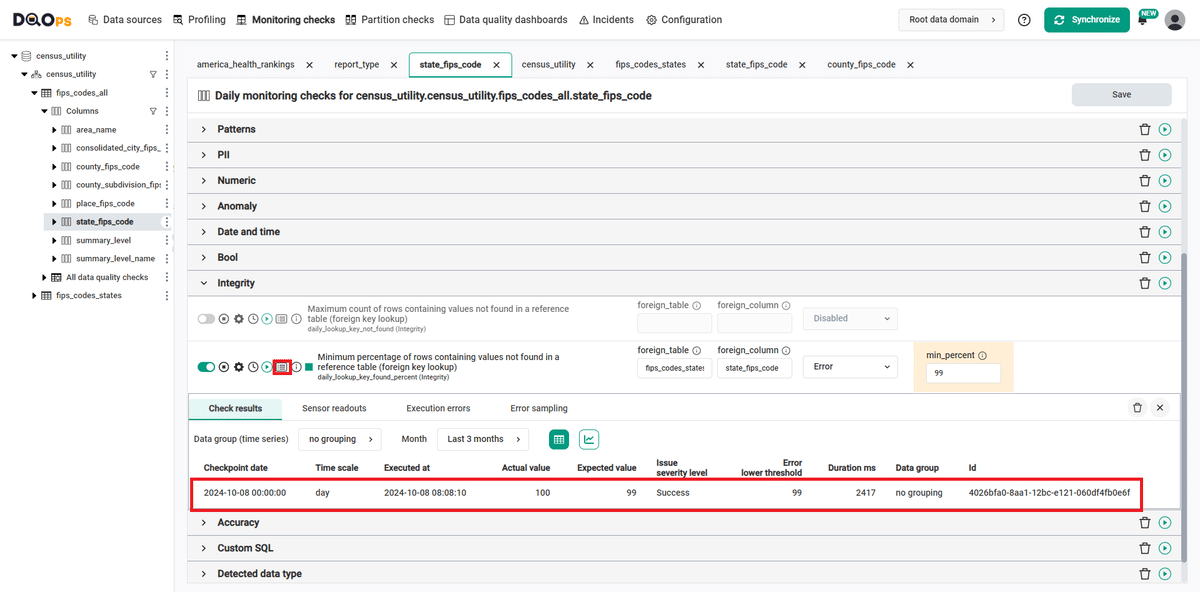
Within the Results window, you will see three categories: Check results, Sensor readouts, and Execution errors. The Check results category shows the severity level that result from the verification of sensor readouts by set rule thresholds. The Sensor readouts category displays the values obtained by the sensors from the data source. The Execution errors category displays any error that occurred during the check's execution.
The actual value in this example is 100%, which is above the minimum threshold level set in the error (99.0%). The check gives a correct result (notice the green square to the left of the check name).
Synchronize the results with the cloud account
Synchronize the results with your DQOps cloud account using the Synchronize button located in the upper right corner of the user interface.
Synchronization ensures that the locally stored results are synced with your DQOps Cloud account, allowing you to view them on the dashboards.
YAML configuration file
The YAML configuration file stores both the table details and checks configurations.
In this example, we have set the minimum percentage threshold at 99% for the check.
And the following parameters:
- foreign_table: fips_codes_states
- foreign_column: state_fips_code
The highlighted fragments in the YAML file below represent the segment where the monitoring daily_lookup_key_found_percent
check is configured.
If you want to learn more about checks and threshold levels, please refer to the DQOps concept section.
apiVersion: dqo/v1
kind: table
spec:
   incremental_time_window:
      daily_partitioning_recent_days: 7
      monthly_partitioning_recent_months: 1
   columns:
      summary_level:
         type_snapshot:
            column_type: STRING
            nullable: true
      summary_level_name:
         type_snapshot:
            column_type: STRING
            nullable: true
      state_fips_code:
         type_snapshot:
            column_type: STRING
            nullable: true
         monitoring_checks:
            daily:
               integrity:
                  daily_lookup_key_found_percent:
                     parameters:
                        foreign_table: fips_codes_states
                        foreign_column: state_fips_code
                     error:
                        min_percent: 99.0
Data lineage
DQOps has built-in data lineage, which allows users to easily trace data helping them identify the root cause of data quality issues more efficiently.
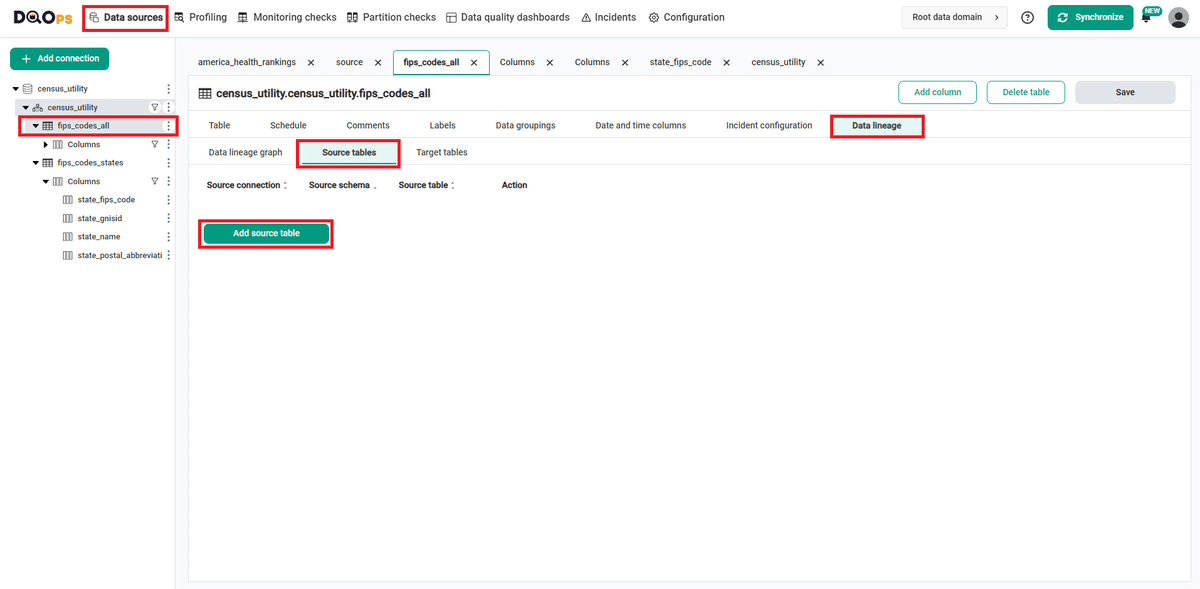
Navigate to data lineage
- Go to the Data sources section.
- Select the target table from the tree view on the left. In our case it will be
fips_codes_alltable. - Click on the Data lineage tab.
- Click on the Source tables tab.
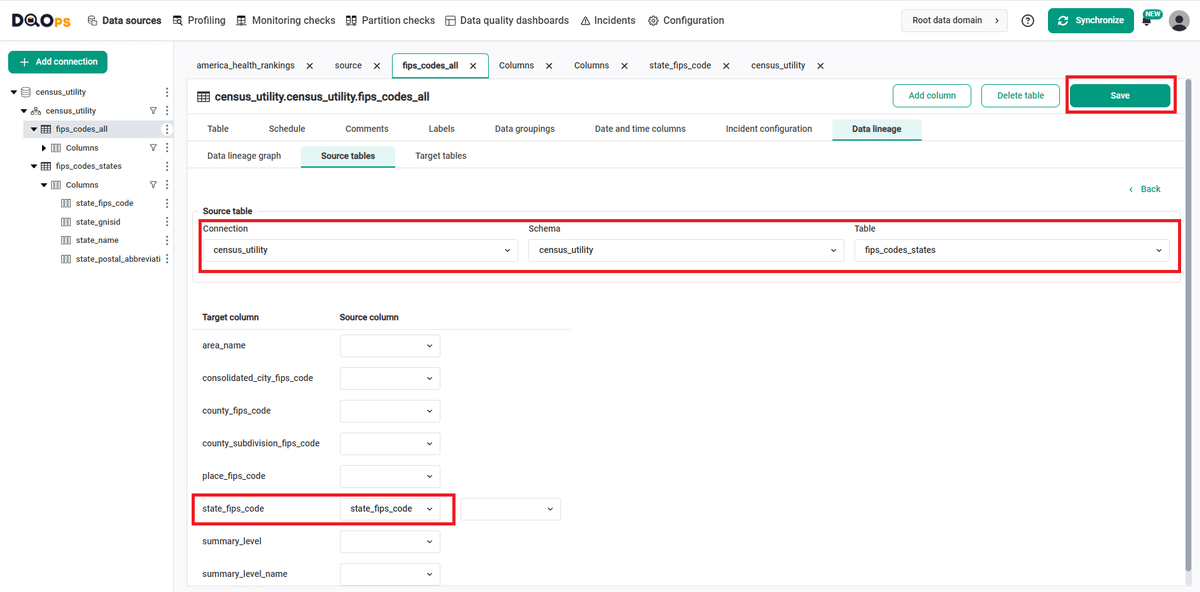
- Click the Add source table button.
Set source table data
- Select the source table using the drop-down list. Select connection, schema, and table.
- If the column names in both tables are the same, they will be automatically combined. If the column names in the target and source tables are different, you can manually select them using the drop-down list.
- Click the Save button.
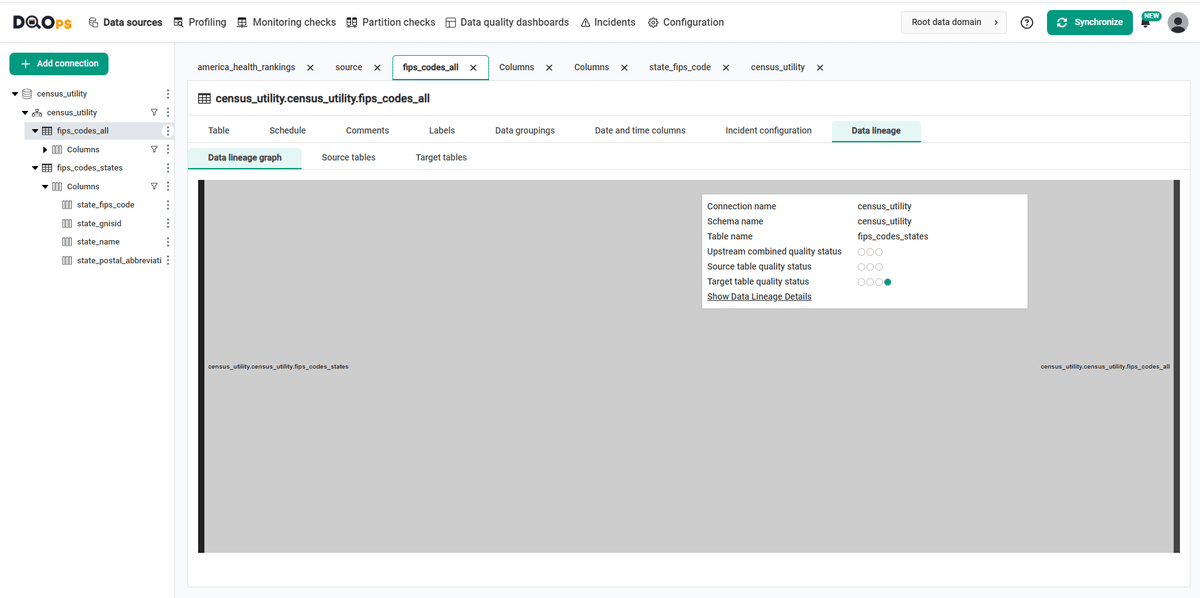
View the data lineage graph
Click on the Data lineage graph tab. Data lineage helps organizations track data back to its source, making it easier to identify where quality issues begin by
tracing to either faulty input data or mistakes in downstream transformations.
If you want to learn more about data lineage support, please refer to the DQOps data lineage support.
Next steps
- You haven't installed DQOps yet? Check the detailed guide on how to install DQOps using pip or run DQOps as a Docker container.
- For details on the lookup_key_found_percent used in this example, go to the check details section.
- With DQOps, you can easily customize when the checks are run at the level of the entire connection, table, or individual check. Learn more about how to set schedules here.
- DQOps allows you to keep track of the issues that arise during data quality monitoring and send alert notifications directly to Slack. Learn more about incidents and notifications.
- The data in the table often comes from different data sources and vendors or is loaded by different data pipelines. Learn how data grouping in DQOps can help you calculate separate data quality KPI scores for different groups of rows.