
Data quality monitoring for business intelligence
Let your dashboards always show valid numbers
Imagine creating beautiful dashboards only to discover inaccurate or incomplete data skewing your insights. Inconsistent source data can lead to misleading conclusions and hinder effective decision-making. Manually monitoring data quality is time-consuming and error-prone.
DQOps platform eliminates the guesswork from data quality with automated monitoring. It proactively identifies issues before they impact your BI tools, ensuring your dashboards always reflect reliable information. Choose from 150+ pre-built checks, or define custom ones. Get notified of potential problems in real-time via Slack to address potential issues proactively and maintain trust in data-driven decisions.
Data quality monitoring of source data
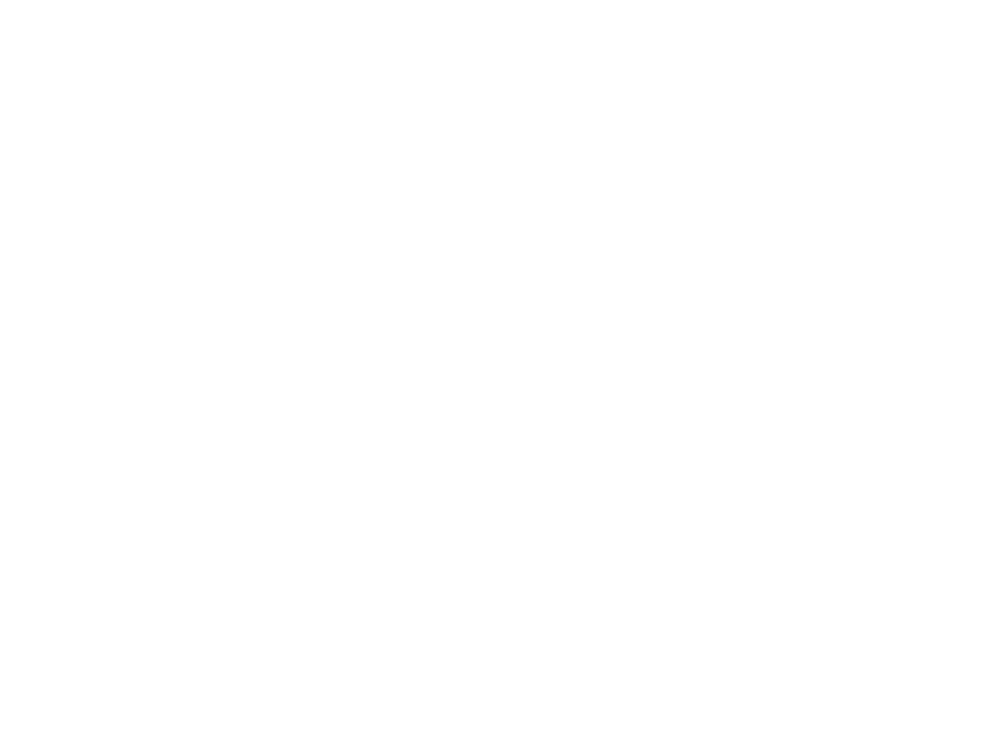
Validate the quality of the source data before you decide to use tables in dashboards.
- Profile the source tables with a predefined set of standard quality checks.
- Choose from over 150 built-in data quality checks or define custom checks.
- Configure data quality checks using the user interface or by directly editing YAML files.
Automatic data quality monitoring
Automatic data quality monitoring
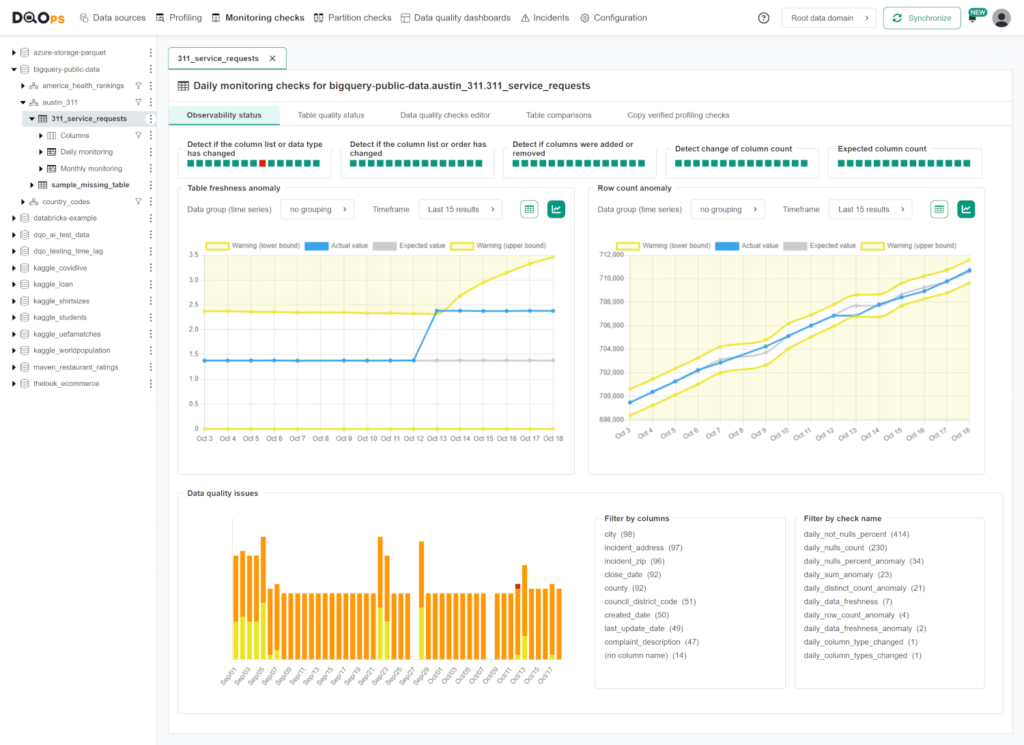
Monitor the quality of source data before issues affect your dashboards.
- Create multiple default data quality check configurations (named data quality policies).
- Keep track of the issues that arise during data quality monitoring and send alert notifications directly to Slack.
- Proactively address potential issues before they escalate.
Root cause analysis
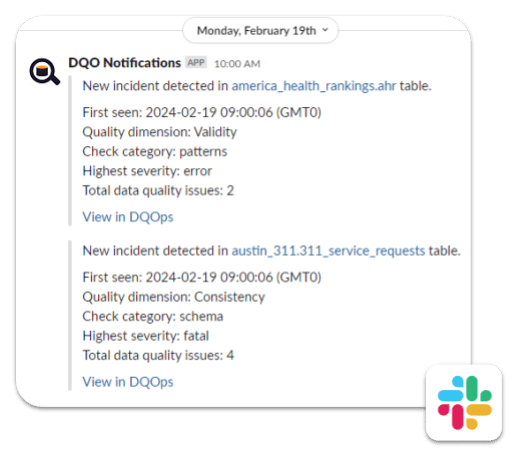
DQOps platform provides a Table quality status feature that gives a summary of the results of the executed checks, grouped by check category or data quality dimension. For more advanced root cause analysis, you can use data quality dashboards that come with calculated scores and advanced grouping and filtering options.
- Quickly check the current data quality status of your connections.
- Identify tables and columns with low KPI scores on built-in data quality dashboards.
- Review data quality KPIs after the issue is fixed.
Always valid dashboards

Always valid dashboards
Define data quality checks for the tables that you use directly in the dashboards. Run queries that retrieve the data that you show in the dashboard.
- Verify that the queries for your dashboards will return valid data.
- Detect missing data that will make your dashboard incomplete.
- Make sure that the most important dashboards are always reliable.