Last updated: October 22, 2024
DQOps data lineage integration with Marquez
This guide shows the data lineage integration between DQOps and Marquez.
Overview
DQOps enables the loading of existing data lineages from Marquez without any manual setup required from the user. This example shows how table-level lineage can be used to search for the root cause of an issue quickly.
Example dataset
To illustrate the integration of DQOps with Marquez, let's consider a sales platform that processes customer data through three stages:
- Landing Stage: Raw data is ingested from various sources (e.g.,
customer_address_ca_raw,customers_ca_raw). - Cleansing Stage: Data is standardized, de-duplicated, and merged into unified tables (
customers,customer_address). - Data Mart Stage: Cleaned data is transformed into a dimensional representation for analytics (
dim_customerstable).
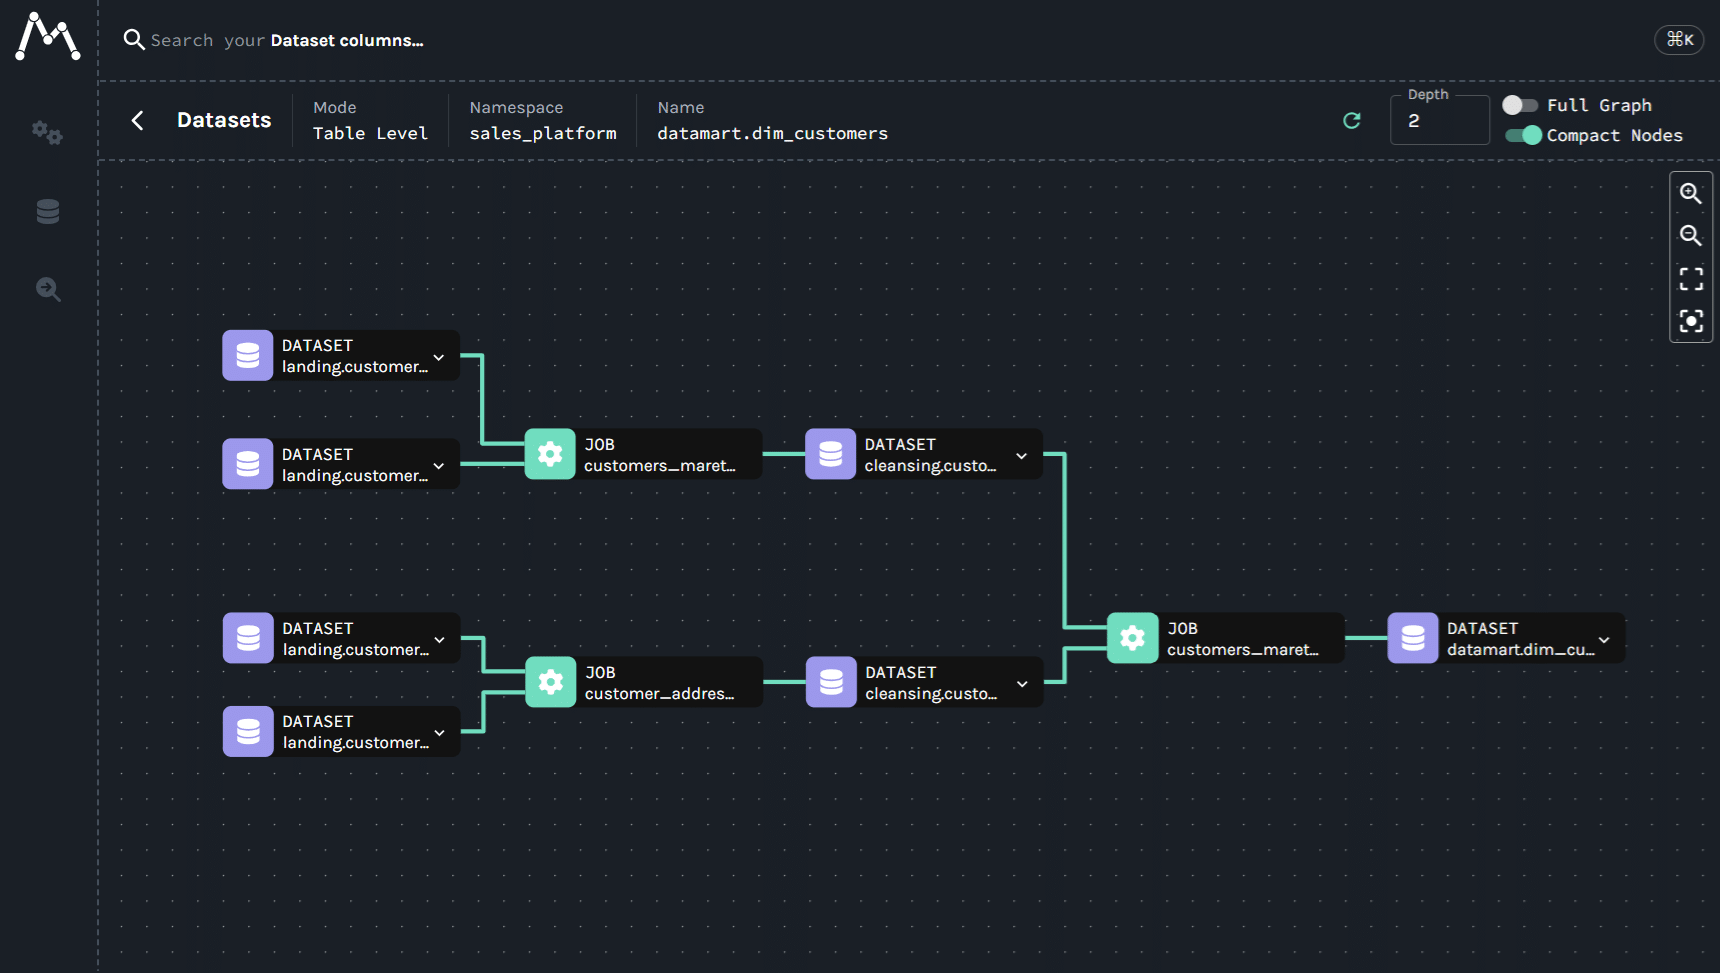
Marquez data representation
Marquez provides a visual representation of the data lineage, allowing you to understand the relationships between tables and their dependencies easily. The image below shows an example of how Marquez represents the data lineage for the sales pipeline.
DQOps data lineage
DQOps supports both table-level and column-level data lineage. You can either manually configure mappings or import lineage directly from Marquez.
The dim_customers table depends on data from the source tables.
Therefore, any data quality issues present in dim_customers table may have originated from the source tables.
Searching for issues in tables created using a complex pipeline can be time-consuming.
This search may need to be repeated after each pipeline fix to ensure that the issue has been resolved.
Utilizing data lineage in DQOps enables us to quickly identify the root cause of any data quality issues.
Using data lineage in DQOps
In this example, data quality checks have been set up on various dimensions for the tables.
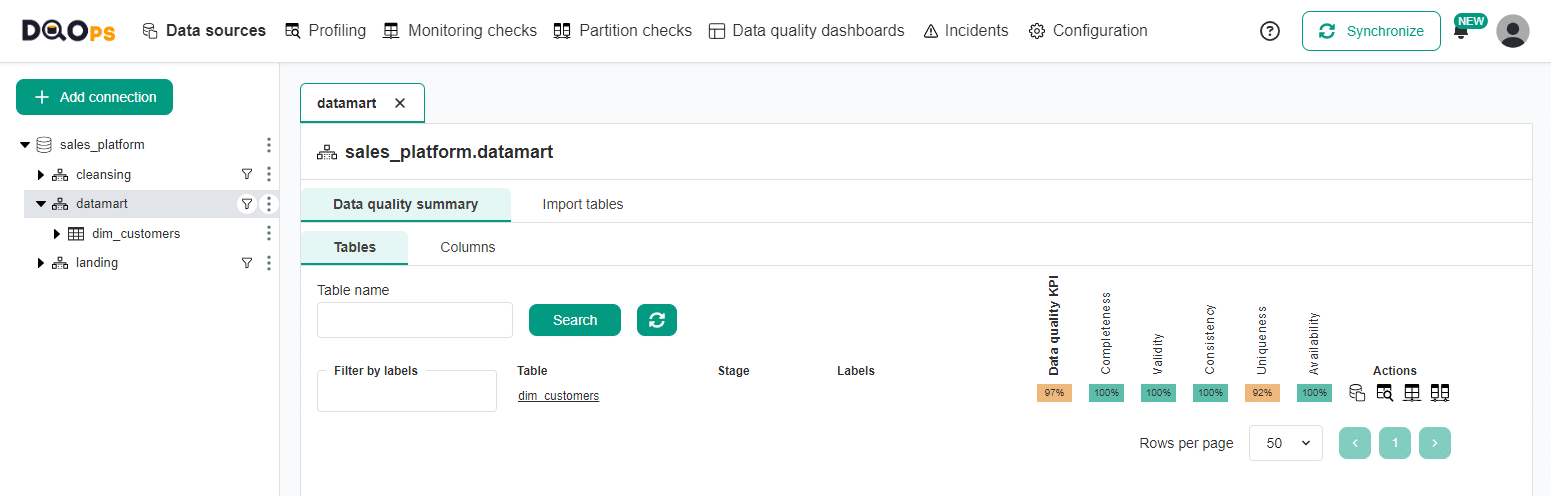
To check the quality status of the tables in the schema, select the schema from the tree view and click in the Data quality summary tab.
An issue with uniqueness can be observed in the dim_customers table from the data mart.
Now, we can view the Data lineage which has been imported in our example from Marquez.
First, click on the target table in the tree view on the left and select the Data lineage tab.
The Data lineage graph displays the status of the source tables.
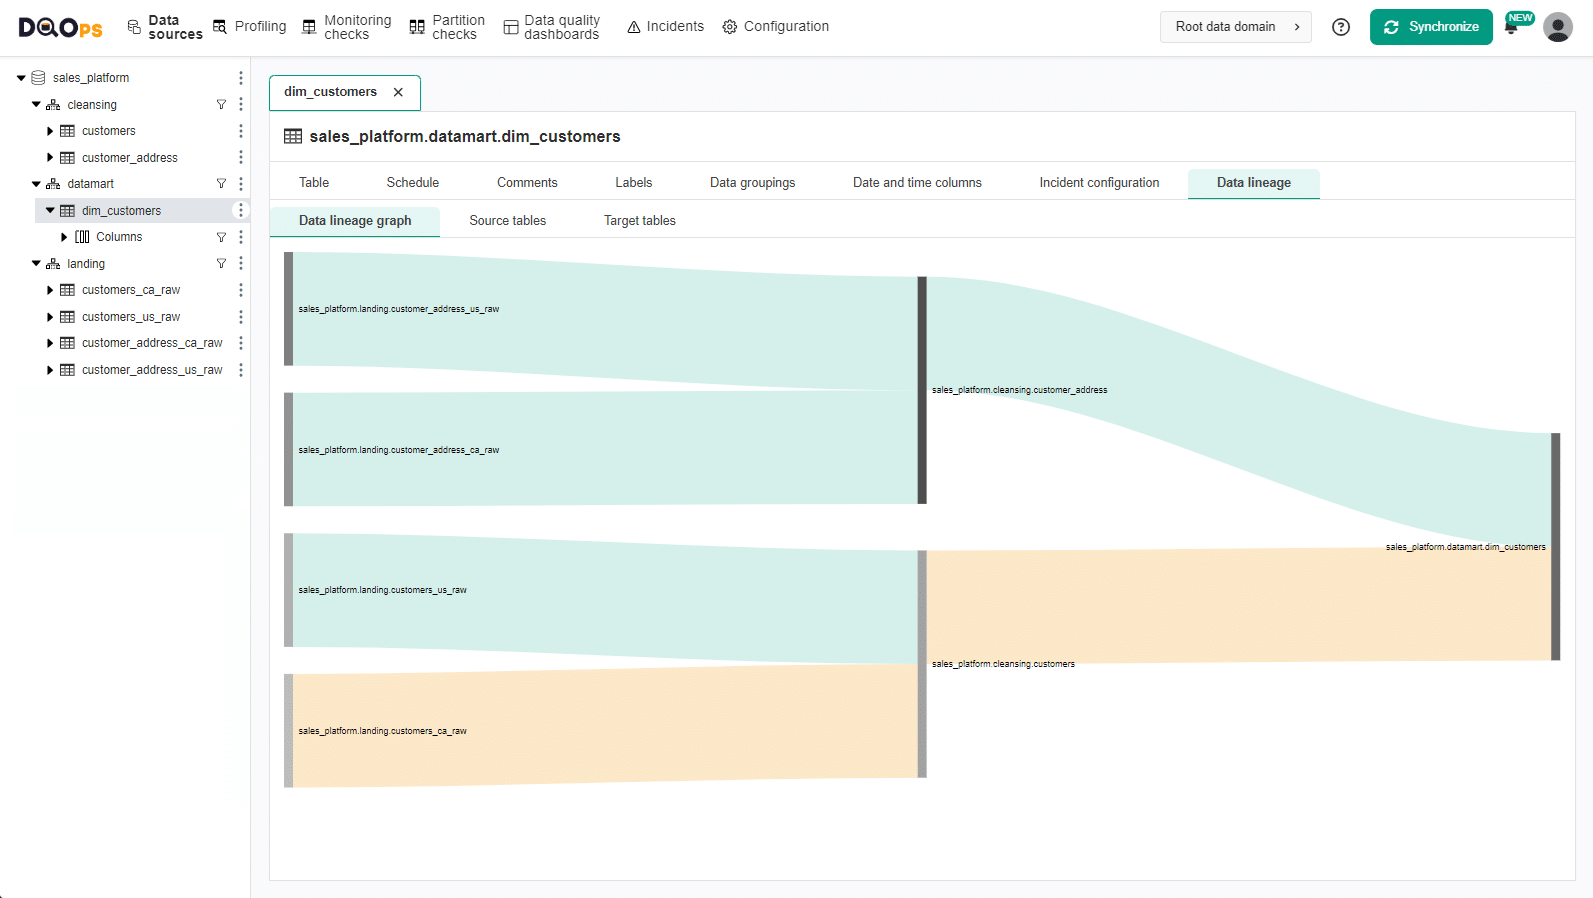
You can reveal which source table caused the issue in the verified table. The problem has a root in the customers_ca_raw table from the landing stage. All other tables have no defects.
When the mouse is put over the defective table flow, the data quality status popup is shown.
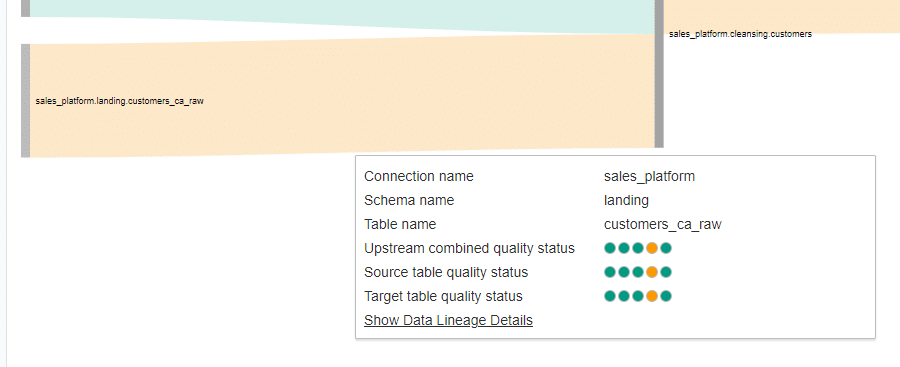
The Connection name, schema name, and source table name point to the table on the left of the hovered flow line.
The Upstream combined quality status is a combined data quality of all preceding tables in a flow. The Source table quality status and Target table quality status are data quality statuses between the tables of the hovered line.
The circles next to them represent the results from data quality check dimensions. You will see at least three of them which correspond to the first three dots in the order: Completeness, Validity, and Consistency. The dimensions in the next circles depend on the configured checks. The color of the circle represents the results: white for no checks were run, green for correct results, orange for error results, red for fatal error results, and grey for check execution errors.
In this example, there are five dimensions configured and one of them failed.
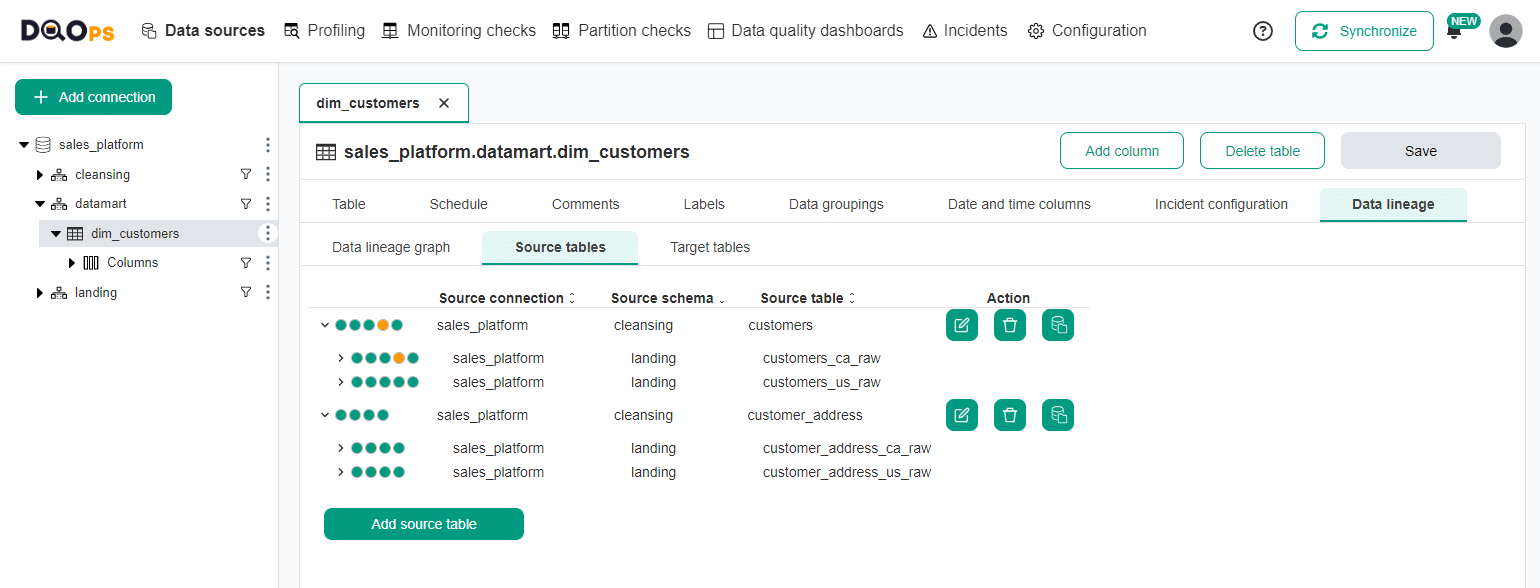
Let's move to the Source tables sub-tab under the Data lineage tab.
When you expand the source tables, you can see the quality statuses of the upstream tables that influence your target table, as shown on the screen below.
You can see that the observed issue comes from the customers_ca_raw table in the Ingestion stage schema named landing.
Hovering over a circle will display more details.
Activating data lineage synchronization
Data lineage synchronization is a paid feature. Please contact DQOps sales for more information.