Last updated: July 05, 2025
How to Run Data Quality Checks in Azure Data Factory
Read this guide to learn how to use data quality checks in Azure Data Factory data pipelines, and how to handle data quality issues.
Overview
By integrating Azure Data Factory with the DQOps API, you can streamline data quality processes and gain deeper insights into your data. This integration empowers you to:
- Run data quality checks
- Collect comprehensive statistics about tables
- Import table schema to DQOps
- Get table data quality status,
This guide provides a practical demonstration of running data quality checks on data residing in Azure Blob Storage.
Prerequisite
Before you integrate DQOps into Azure Data Factory pipelines, you need to configure a data source in DOQps. You can easily connect to the data source located on Azure, Databricks, or elsewhere. DQOps supports all commonly used databases. You can check out the complete list of supported databases here.
Azure Data Factory integration
To interact with the DQOps API, you will need a unique personal API key. This key acts as your authentication credential.
Getting the personal API Key
You can easily get your personal, user-unique API Key through the DQOps Web UI.
- Open your DQOps instance's Web UI in your browser.
- Click on the user profile icon in the top-right corner of the interface.
- Click on the Generate API Key button to create a new key.
- Copy the generated API key and use it in your Azure Data Factory pipeline.


Run checks
DQOps offers granular control over which checks are executed. You can specify checks attached to a table on a connection, with specific names for labels, quality dimensions, types of checks, and more.
To create the run checks job in DQOps from Azure Data Factory:
-
Create a new pipeline and add a new Web activity.
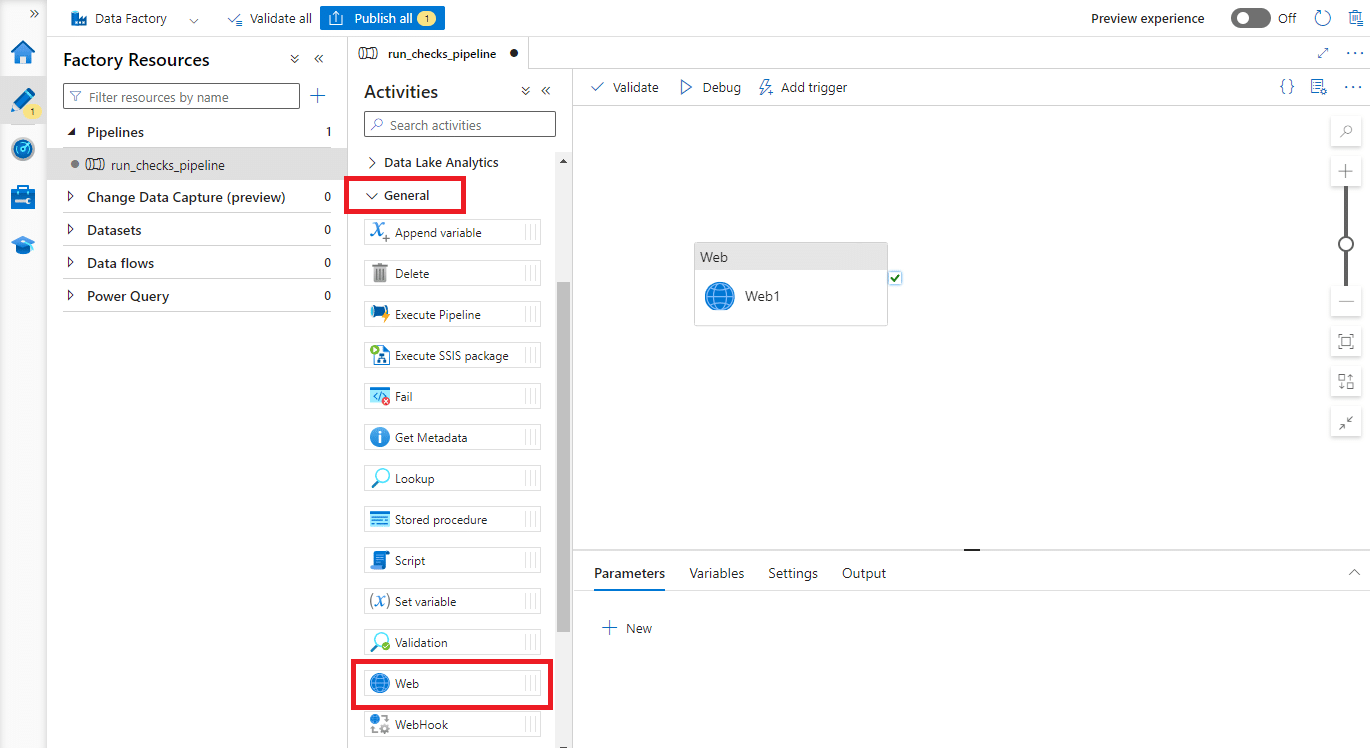
-
Click on the Web activity and open the Settings tab.

-
Configure the Setting as follows:
-
Fill the URL with the link that calls the run checks endpoint. It is crucial to set the wait parameter, which makes the DQOps backend wait for the execution to finish. Calling the run checks endpoint without the wait parameter will run checks without allowing you to see the results in Azure Data Factory.
Construct the URL using the following template and replacing <your_DQOps_instance> with your actual DQOps instance address.
-
Set the Method as POST.
-
Specify the checks to be executed in the Body of the request. The following example runs all activated profiling checks on the "files.readouts" table from the "azure-storage-parquet" connection and collects error samples on failed checks.
-
Leave the Authentication combo box as None.
- In the Headers section, add three variables. The name Authorization contains the token starting with Bearer and space character. The rest of the value is your personal API Key. The names accept and Content-Type should contain value as application/json.
-
-
Save the pipeline by clicking on Publish all button.
To initiate the pipeline execution, follow these steps:
-
Navigate to Add trigger and select the Trigger now

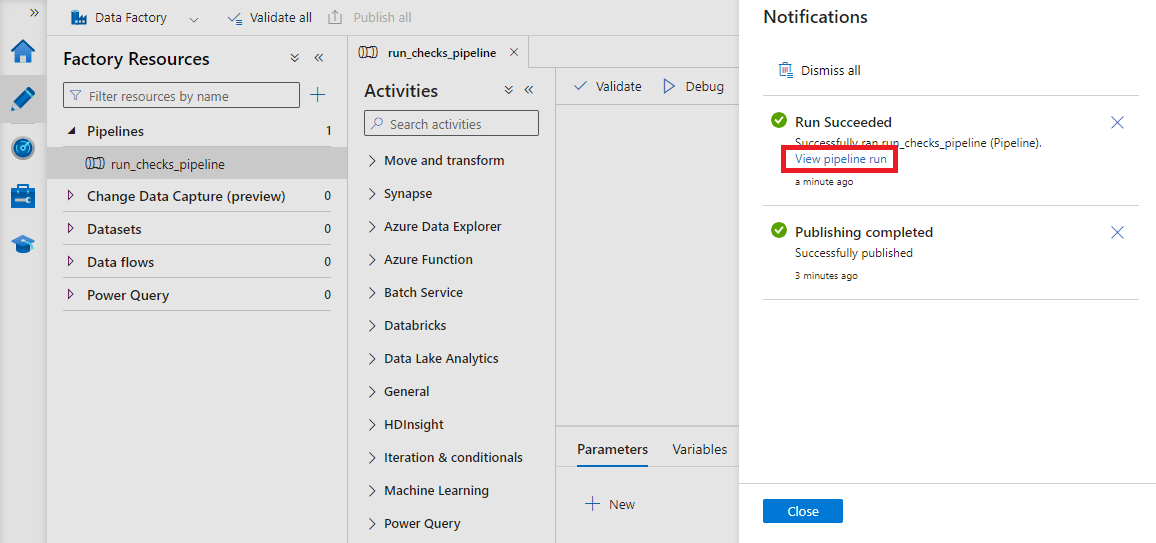
In a moment, you should receive a notification about the completion of the pipeline execution.
-
Click the view pipeline run link to access detailed execution information
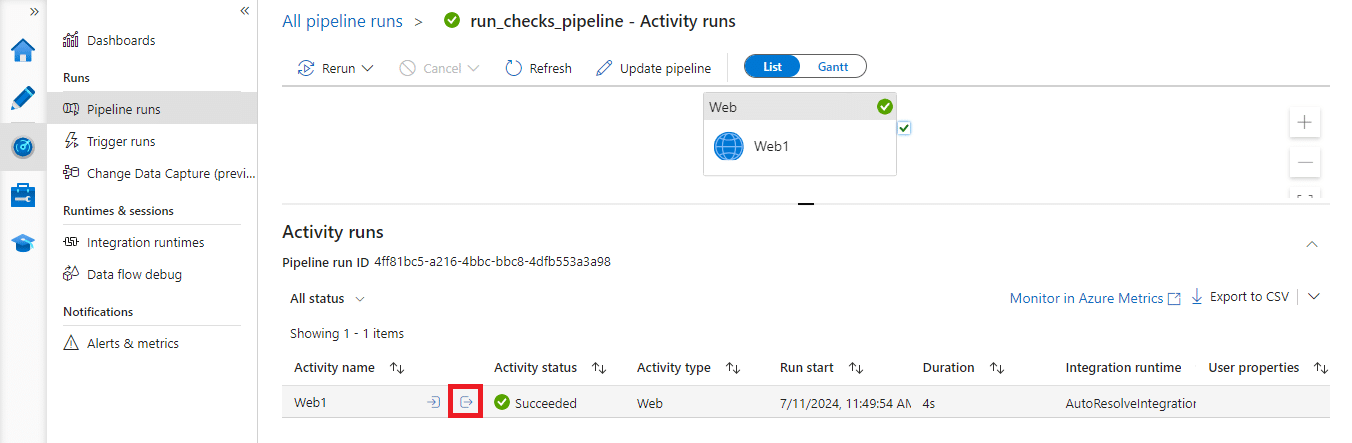
-
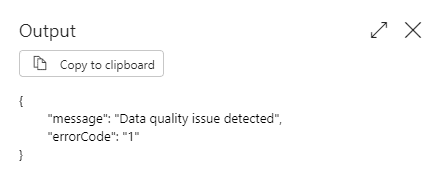
Select the output of the Web activity to retrieve the DQOps API response in JSON format.
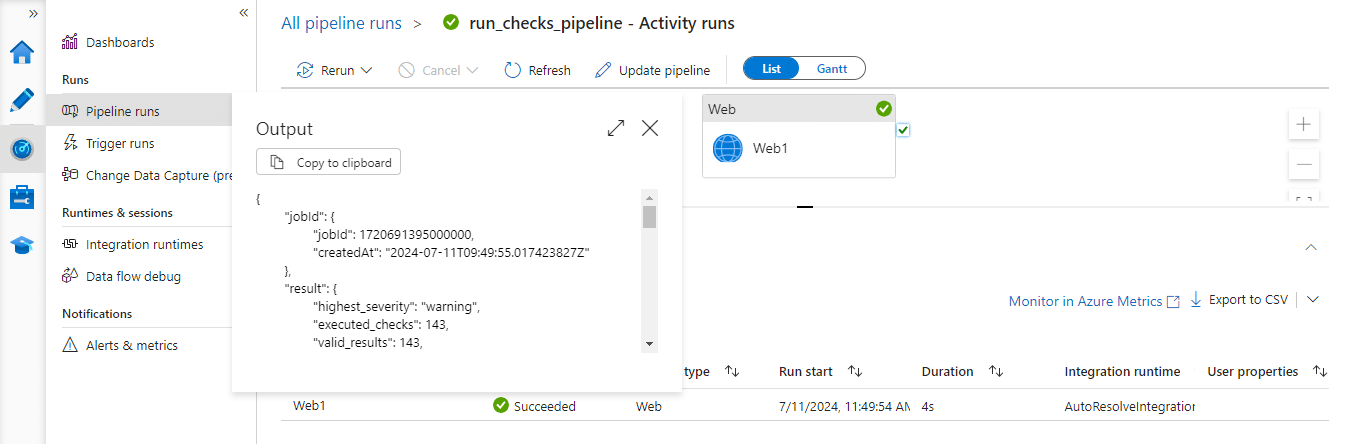
You can see that running checks resulted in 47 execution warnings. The data has data quality issues and requires review.
The run checks API call can be integrated into existing pipelines to create conditional branches during pipeline execution.
Integrate run checks action with your pipeline
To integrate run checks with your pipeline, you can disallow copying new data to a corrupted data source. To do this, you need to use the returned JSON from DQOps.
First, call DQOps to fetch the status of your data, then verify the status. If it is successful, the data is copied. If not, the pipeline is marked as failed, and the code of the issue is returned.
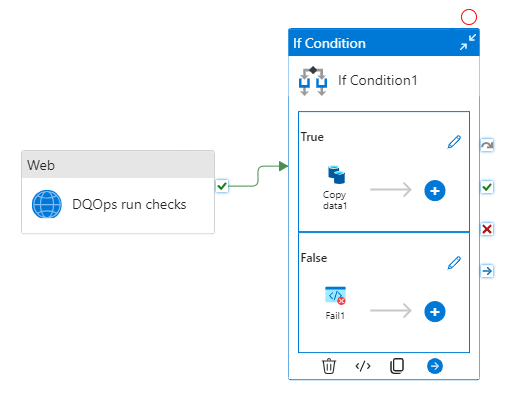
To create this pipeline, add the If condition activity to the previously configured Web activity (now named "DQOps run checks") and fill the Expression field with:
The expression verifies that the highest severity from the returned JSON is "valid."
The "valid" status means that no issues have been detected. If any issues are detected, the status becomes the severity of the issue, such as warning, error, or fatal.
To mark the issue, add the Fail activity in the False section of the If condition activity.
To make the Fail activity more informative, utilize the returned data from the DQOps API.
Fill in the Fail message (e.g., "Data quality issue detected") and Error code (the code below).
@if(
    contains(activity('DQOps run checks').output.result.highest_severity, 'warning'), 1,
    if(
        contains(activity('DQOps run checks').output.result.highest_severity, 'error'), 2,
        if(
            contains(activity('DQOps run checks').output.result.highest_severity, 'fatal'), 3, 4
        )
    )
)
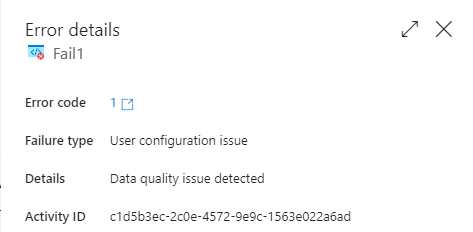
The Error code corresponds to different severity levels by assigning integer numbers as follows: warning - 1, error - 2, fatal - 3. The code 4 is used for other issues, such as sensor execution errors or user misconfigurations in DQOps.

If there are no issues, the copy data activity will be executed. Otherwise, you will see a failure on the Monitor page along with an error message.
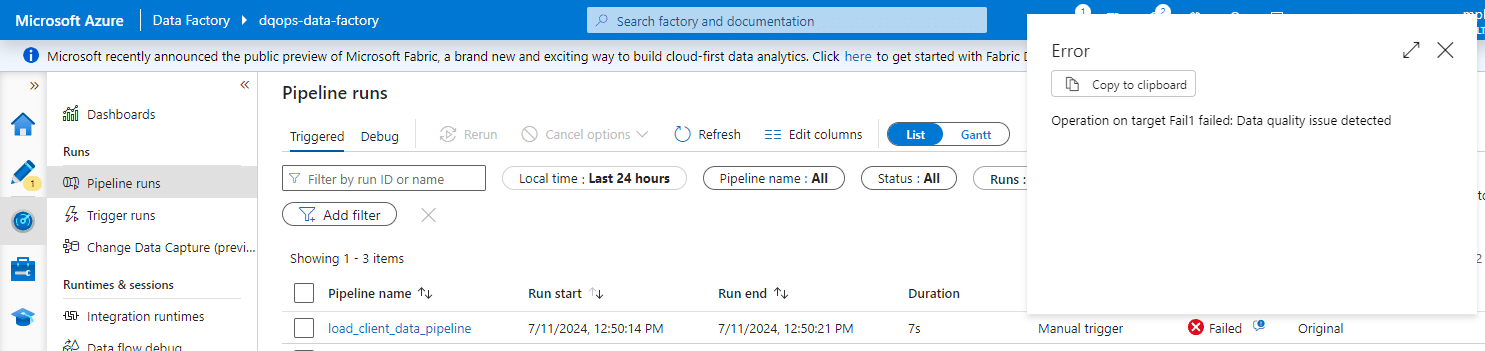
The error details will also provide you with the error code.
Instead of the Fail activity, you can also initiate another REST API that will promptly notify about data quality issues as soon as they are detected.
Example jobs
Here are some example jobs for DQOps REST API that provide a range of endpoints. You can access the details through the Swagger API at the following address:
You need to replace <your_DQOps_instance> with your DQOps instance address.
The collect statistics job in DQOps provides summary information about your tables and columns. This information is can help in deciding which data quality checks and threshold levels should be set to monitor data quality. You can specify to run this job only to the specific table on a connection.
Here is an example endpoint for collecting statistics for a table:
The Body of the request should contain the name of the table for which statistics will be collected.
For example, the following request collects statistics for the table "files.readouts" from the "azure-storage-parquet" connection.
Example of the response returned.
The import table job is used to import the table schema into the existing connection in DQOps.
The Body of the request in the example below imports the table schema of "files.readouts" table from the "azure-storage-parquet" connection.
Example of the response returned.
{
  "jobId": {
    "jobId": 1720701935000000,
    "createdAt": "2024-07-11T12:45:35.687507400Z"
  },
  "result": {
    "source_table_specs": [{
      "incremental_time_window": {
        "daily_partitioning_recent_days": 7,
        "monthly_partitioning_recent_months": 1
      },
      "columns": {
        "actual_value": {
          "type_snapshot": {
            "column_type": "DOUBLE",
            "nullable": "True"
          },
          "comments": []
        },
        "check_category": {
          "type_snapshot": {
            "column_type": "VARCHAR",
            "nullable": "True"
          },
          "comments": []
        },
        // ...
      }, "comments": []
    }]
  },
  "status": "finished"
}
The table data quality status provides an overall assessment of data quality status for a specific table, based on checks run in the DQOps platform. If there are any issues with the table, the operator will inform the severity of the issue and point towards an areas that require improvement in data quality.
This job can be used to collect information about data quality before or after carrying out significant operation, potentially saving operational costs and time.
The URL contains the name of the connection, schema and table.
Request method: GET
http://<your_DQOps_instance>/api/connections/{connectionName}/schemas/{schemaName}/tables/{tableName}/status
The following URL calls the API to retrieve the status for the table files.readouts from the azure-storage-parquet connection.
http://<your_DQOps_instance>/api/connections/azure-storage-parquet/schemas/files/tables/readouts/status
Example of the response returned.
{
    "connection_name": "azure-storage-parquet",
    "schema_name": "files",
    "table_name": "readouts",
    "current_severity": "valid",
    "highest_historical_severity": "valid",
    "last_check_executed_at": "2024-07-10T12:33:11.818Z",
    "executed_checks": 406,
    "valid_results": 399,
    "warnings": 5,
    "errors": 2,
    "fatals": 0,
    "execution_errors": 0,
    "data_quality_kpi": 100,
    "checks": {
        // ...
    },
    "columns": {
        // ...
    },
    "dimensions": {
        // ...
    }
}
Next steps
- We have provided a variety of use cases that use openly available datasets from Google Cloud to help you in using DQOps effectively. You can find the full list of use cases here.
- DQOps allows you to keep track of the issues that arise during data quality monitoring and send alert notifications directly to Slack. Learn more about incidents and notifications.
- The data in the table often comes from different data sources and vendors or is loaded by different data pipelines. Learn how data grouping in DQOps can help you calculate separate data quality KPI scores for different groups of rows.