Last updated: July 05, 2025
How to Use DQOps User Interface - Overview
This guide introduces the concept of DQOps user interface, how the screen is organized, how to work with multiple tables, and navigate across the platform.
Overview
The DQOps web interface is divided into three main areas.
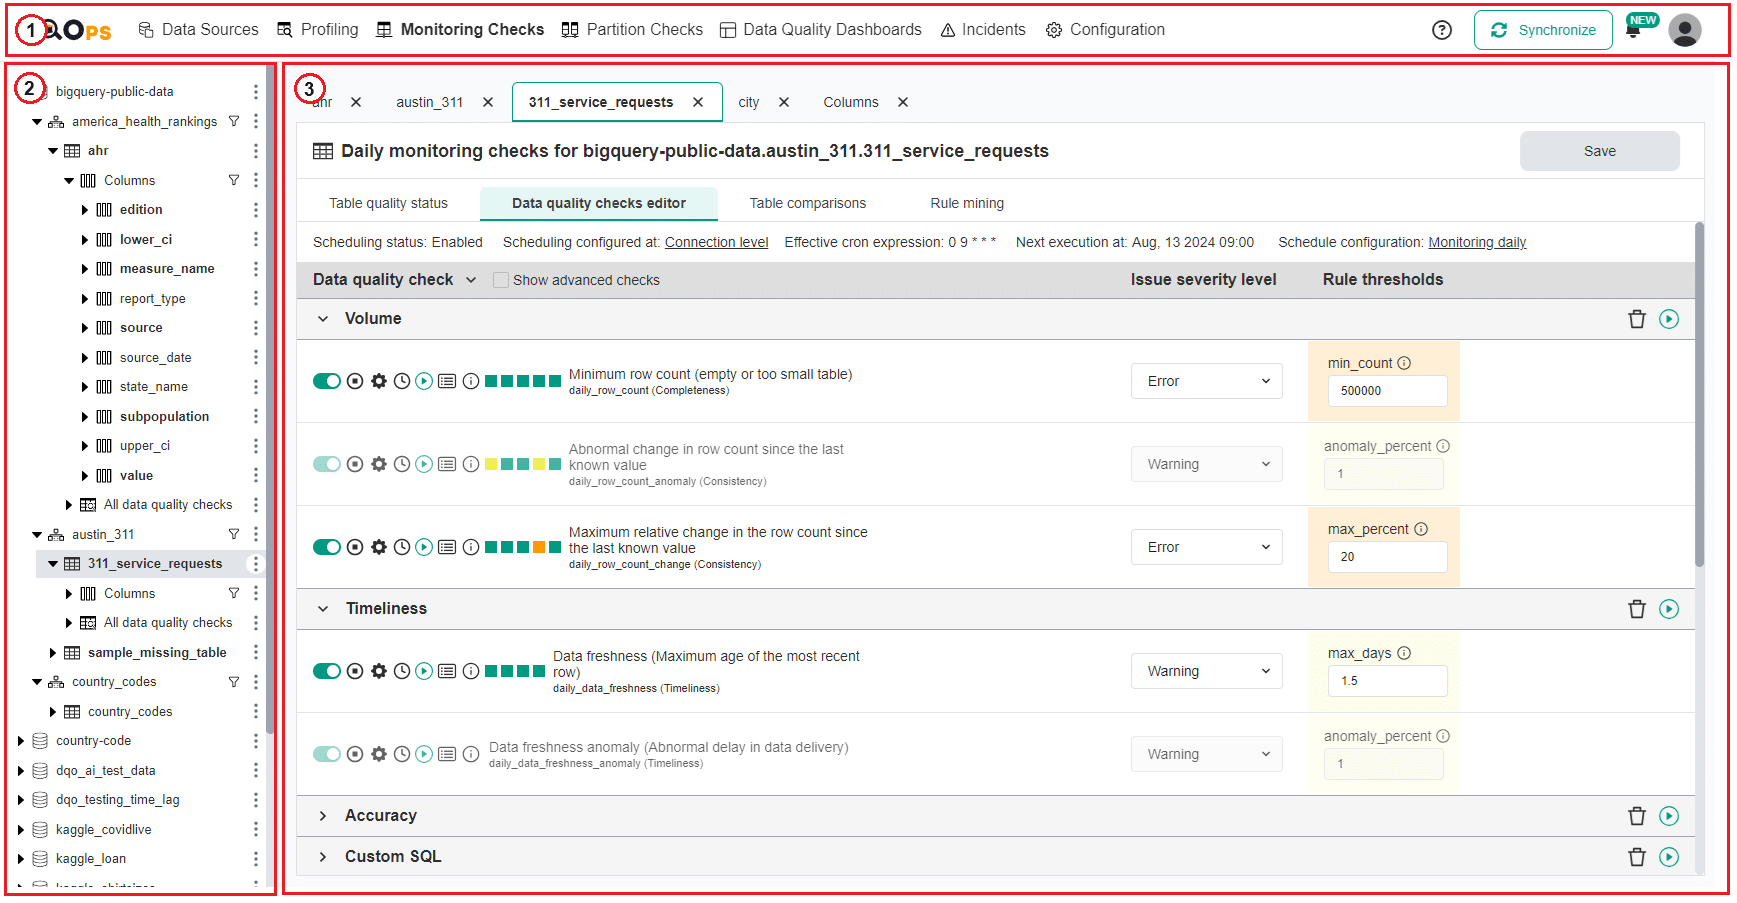
- The navigation bar has links to the main DQOps data quality monitoring sections and provides access to the main settings and other functions.
- The tree view displays all the data sources available in your workspace or a list of dashboards depending on the section chosen in the navigation bar.
- The main workspace changes according to your selection in the navigation bar and the tree view.
Home screen
The DQOps home screen provides a quick guide on how to start data quality monitoring. Here, you can also access summaries that provide a centralized view of the data quality or all your monitored tables and columns, as well as summary of the incidents. These summaries are created based on the results of previously executed monitoring and partition data quality checks. The results form profiling data quality are not included in the calculation.
Tables summary
The Tables summary screen provides a centralized view of the data quality of all your tables within DQOps.
To access Tables summary click on the DQOps logo in the top left corner and select the Tables tab.
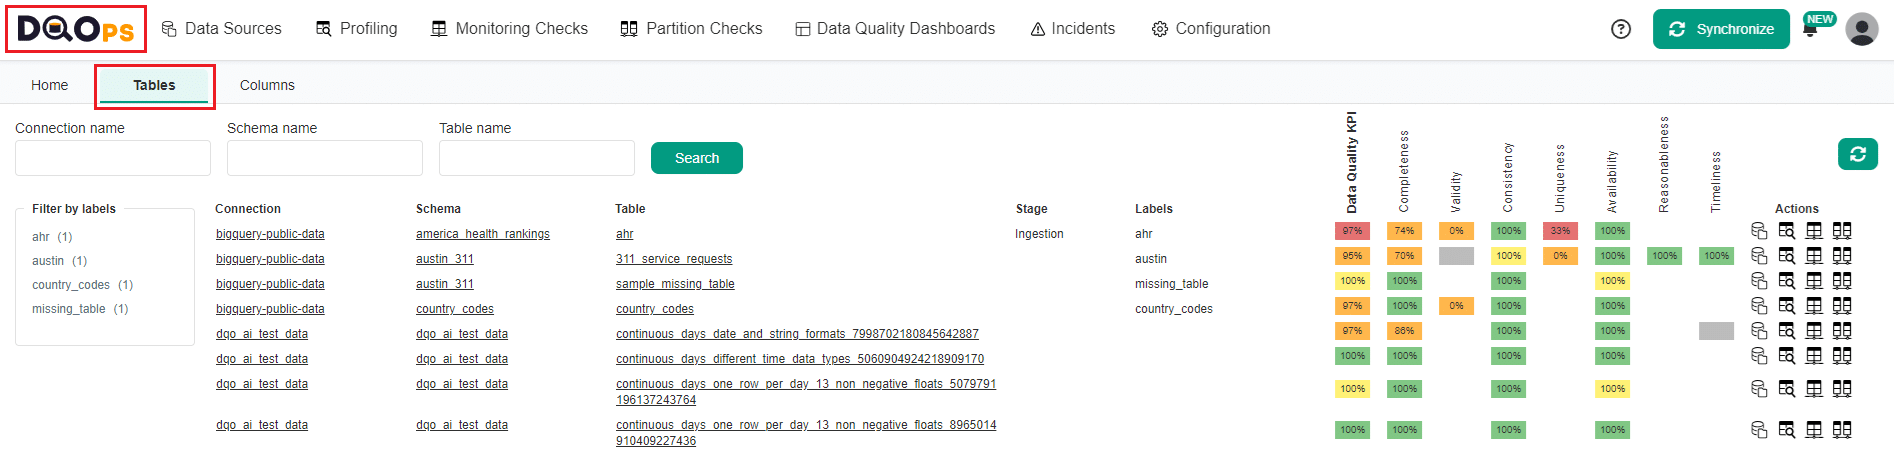
Searching and filtering the tables:
- Search: Use the search bar at the top of the screen to find specific tables based on connection name, schema name, or table name. You can also use wildcards (*) to easily locate tables that meet specific criteria without needing to enter exact names.
- Filter by Label: Refine your view by applying filters to the table labels on the left-hand side. This helps you locate tables based on your user-defined table labels.
The Tables summary screen displays the following information for each table:
- Connection - The database connection the table belongs to.
- Schema - The schema within the connection where the table is located.
- Table - The name of the specific table.
- Stage - The current stage of the table (e.g., development, production).
- Labels - User-defined labels associated with the table for easier organization.
- Data Quality KPIs - A summary of data quality KPIs calculated from partial data values, providing a quick overview of data quality of the table.
-
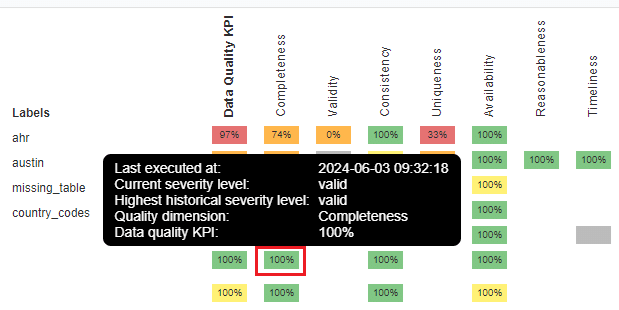
Data Quality KPIs by dimensions - This column displays a breakdown of data quality KPIs calculated from executed checks categorized by specific dimensions (e.g., completeness, validity, consistency). Hovering over the KPIs value will display a tooltip containing more details.
-
Action buttons - Click on these buttons
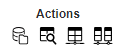 to link to Data sources, Profiling, Monitoring checks, or Partition checks section screens.
Columns summary
The Column summary screen provides a granular view of the data quality for each column within your tables.
To access Columns summary click on the DQOps logo in the top left corner and select the Columns tab.
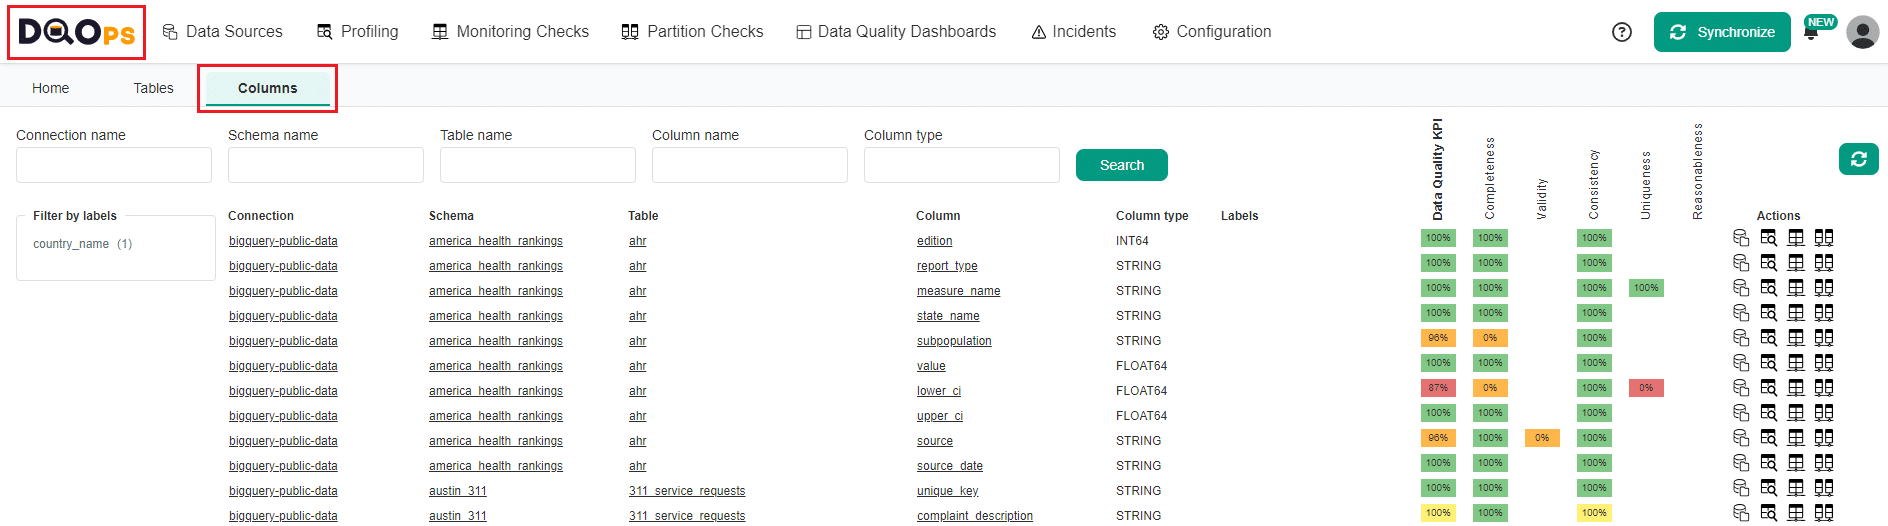
Searching and filtering the columns:
- Search: Use the search bar at the top of the screen to find specific columns based on connection name, schema name, table name, column name, or column type (e.g., INTEGER, STRING, DATE). You can also use wildcards (*) to easily locate columns that meet specific criteria without needing to enter exact names.
- Filter by Label: Refine your view by applying filters to the table labels on the left-hand side. This helps you locate tables based on your user-defined table labels.
The table summary screen displays the following information for each table:
- Connection - The database connection the table belongs to.
- Schema - The schema within the connection where the table is located.
- Table - The table where the column is located.
- Column - The name of the specific column.
- Column type - The data type of the column (e.g., INTEGER, STRING, DATE).
- Data Quality KPIs - A summary of data quality KPIs from partial data values, providing a quick overview of data quality of your columns.
-
Results from data quality dimensions - This column displays a breakdown of data quality KPIs calculated from executed checks categorized by specific dimensions (e.g., completeness, validity, consistency). Hovering over the KPIs value will display a tooltip containing more details.
-
Action buttons - Click on these buttons
to link to Data sources, Profiling, Monitoring checks, or Partition checks section screens.
Incidents summary
The Incidents summary provides an overview of all incidents created in DQOps, which are groupings of similar data quality issues. To learn more about Incidents refer to the Data quality incident management, grouping and notifications section
To access Incidents summary click on the DQOps logo in the top left corner and select the Incidents summary tab.
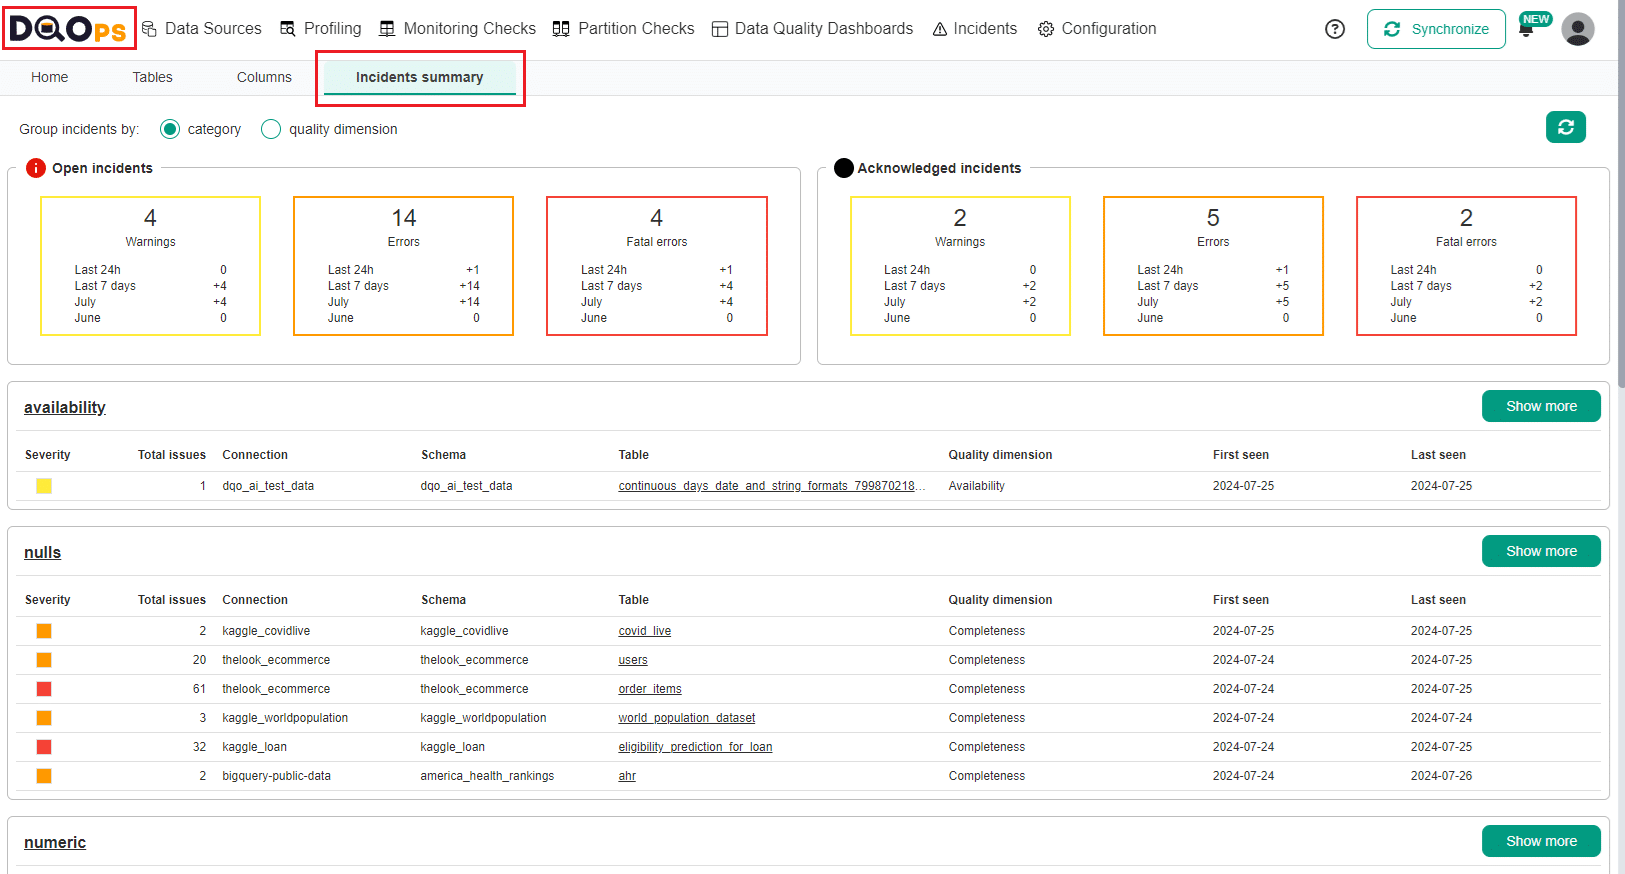
The Incidents summary screen provides an overview of data quality incidents categorized by either check category or data quality dimension. You can easily switch between these groupings using the provided radio buttons. The Refresh button located at the top right of the screen, allows you to refresh the displayed incident data.
At the top of The Incidents summary screen, there are two sections displaying the summaries of Open and Acknowledged incidents. Each section is divided into three blocks based on severity level: Warnings, Errors and Fatal errors. In each block, there is a summary of new incidents from the last 2 months, along with detailed data showing the number of incidents detected in the last 24h, last 7 days, current month and previous month.
Below the Open and Acknowledged incidents summaries, there is a table that list incidents grouped by the selected check category or the quality dimension, depending on your grouping selection. The table includes the following columns:
- Severity - Indicates the severity of the incident with colored squares (yellow for warning, orange for error and red for fatal error)
- Total issues - Displays the total number of times the data quality issue has occurred in the incident.
- Connection - The name of the connection where the incident was detected.
- Schema - The schema name within the connection where the incident occurred.
- Table - The name of the table where the incident was detected.
- Quality dimension or Check category (depending on chosen grouping) - This column will display either the data quality dimension associated with the incident (e.g., Completeness, Validity, Consistency) or the check category that triggered the incident (e.g., anomaly, datetime, nulls, uniqueness).
- First seen - Shows the date the incident was first detected.
- Last seen - Displays the date the incident was last detected.
Each table has a Show more button. Clicking this button will navigate you to the dedicated Incidents screen for a more detailed view.
Navigation bar
The navigation bar allows you to select the specific sections that you want to focus on.

- The Home screen section, which you can access by clicking on the DQOps logo. It allows you to view the Welcome page, as well as summaries of Tables and Columns.
- The Data sources section allows you to add new connections, import schemas and tables, set up schedules, add comments and labels, configure data grouping, set the date and time columns for partition checks, and modify the settings of the incidents and notifications.
- The Profiling section allows you to collect and review basic data statistics, as well as enable and run profiling data quality checks that should be used to profile data and run experiments to see which check would be most appropriate for monitoring the quality of data.
- The Monitoring checks section allows you to enable and run daily or monthly monitoring data quality checks that are standard checks that monitor data quality.
- The Partition checks section allows you to enable and run daily or monthly partition data quality checks that measure data quality for each daily or monthly partition by creating a separate data quality score.
- The Data Quality Dashboards section lets you review the summaries of data quality monitoring on multiple built-in data quality dashboards.
- The Incidents section helps you review and manage the issues that arise during data quality monitoring.
- The Configuration section lets you customize built-in data quality sensors and rules.
The right side of the navigation bar provides access to the main settings and some other functions.

- Help - Links to the support page, documentation, DQOps account manager and configuration parameters settings set at the start of DQOps. You can change the configuration settings by setting command line arguments at the start of the application.
- Synchronize - Synchronize locally stored results with your DQOps Cloud account.
- Notifications - View DQOps notifications and enable/disable the scheduler. The Notifications icon displays NEW tag, when there is a new notification.
- User account - Provide information about your account, current limits and access to the DQOps Cloud account.
Tree view
The tree view changes depending on the section chosen in the navigation bar.
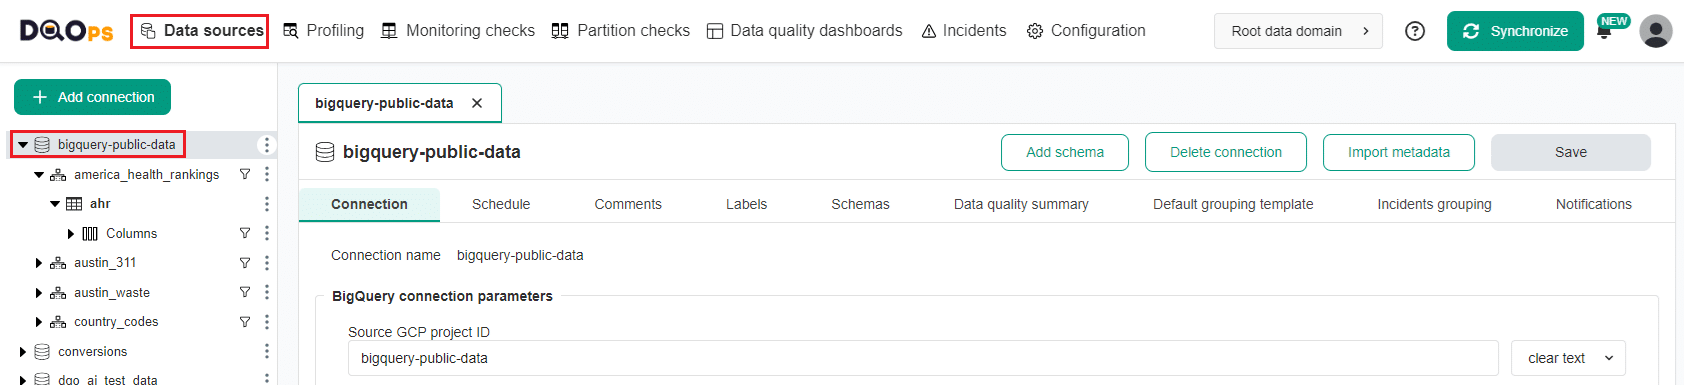
Data sources, Profiling, Monitoring checks and Partition checks tree view
The tree view at the Data sources, Profiling, Monitoring checks and Partition checks displays all the added sources and allows expanding its schemas, tables, and columns. Additionally, in the Profiling, Monitoring checks and Partition checks sections, the three view contains the list of checks.
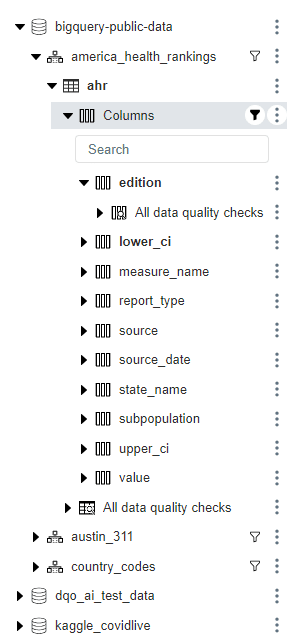
Clicking on an object in the tree view displays available components in the main workspace depending on the chosen section.
For efficient navigation, a funnel icon is available to filter the list of tables and columns. By clicking the funnel icon, a filter dialog opens, allowing users to refine the list based on table or column names or partial matches.
Visual cues for check configuration in the tree view
- In the Data sources section, a table or column with a bold font indicates a configured check on any category.
- In the Profiling, Monitoring checks, and Partition checks sections, tables or columns with configured checks are displayed in bold font.
- In the Partition checks section, tables without configured data or a datetime column needed to run partition checks are displayed in orange font to highlight potential issues.
Tree view context menu
Clicking the vertical dots at the end of each element in the tree view reveals a context menu offering various functions.
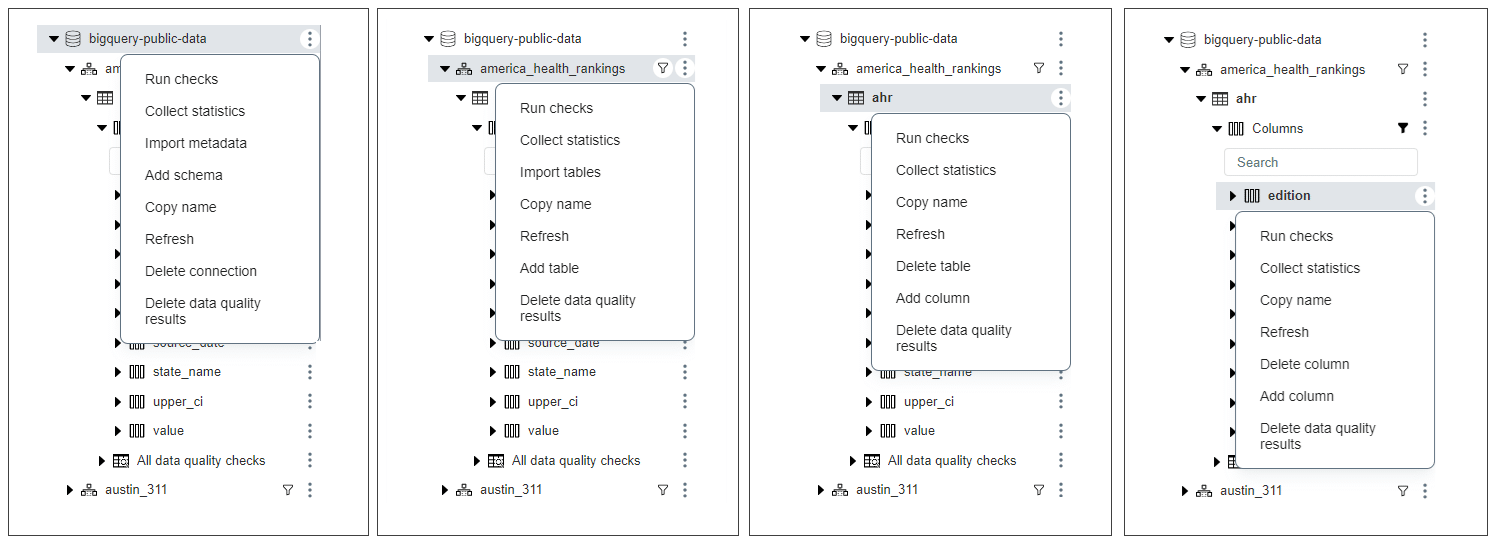
The available options depend on the selected element type and section.
- Run checks: Launches a dialog to execute checks on specific connections, tables, or columns.
- Collect statistics: Launches a dialog to gathers statistics for specific connections, tables, or columns.
- Import tables: Open a screen for importing schemas and tables.
- Copy name: Copies the element name to the clipboard.
- Refresh: Updates the data for the selected connection, schema, table, or column.
- Add schema/table/column: Add new schemas, table or column.
- Delete connection/table: Allow deleting connection or table.
- Delete data quality results: Launches a dialog to delete results from statistics, sensors, checks, errors, etc.
- Reimport metadata: Allows reimporting tables metadata.
Data Quality Dashboards tree view
The tree view in the Data Quality Dashboards section displays the list of built-in dashboards divided into categories. When you hover your cursor over a dashboard name, thumbnails will appear.

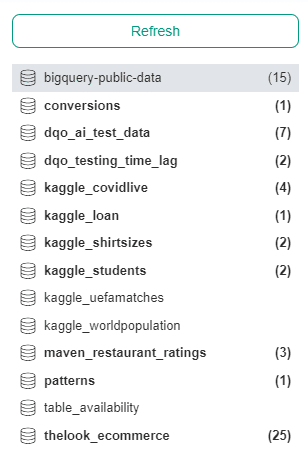
Incidents tree view
The tree view in the Incidents section displays a list of all added sources and the number of open incidents for the last 15 days (including today) in brackets. The connections with new incidents are displayed in bold font.
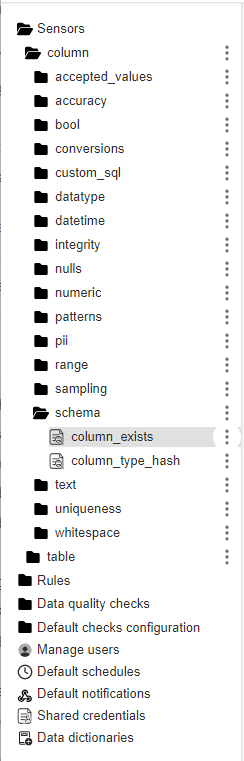
Configuration tree view
In the Configuration section, the tree view displays a list of all built-in data quality Sensors, Rules and Data quality checks that can be customized. Go to the working with DQOps section, to learn how to create custom data quality checks.
The tree view in this section also provides access to the configuration of the following:
- Default checks configuration: This allows you to configure default data quality checks patterns that are automatically activated after importing new tables. Learn how to configure check patterns.
- Manage users: This allows you to add new users and manage their roles.
- Default schedules: This allows you to configure schedules that are automatically set after importing new tables.
- Default notifications: This allows you to configure webhooks.
- Shared credentials: This allows you to add and manage shared credentials.
- Data dictionaries: This allows you to add and manage dictionaries.
Main workspace
Once you select a section from the navigation bar and tree view, the main workspace will show you various data quality components. These include home screen summaries, data source options, information about schemas, tables, and columns, a list of data quality checks, and data quality dashboards.
Clicking on an object in the tree view always opens a new tab in the main workspace that helps in navigating between open elements.
Tabbed interface
When you select an item from the tree view, it opens a new tab in the main workspace. You can open and close tabs within each section such as Data sources, Profiling, Monitoring checks, Partition checks, Data Quality Dashboards, Incidents and Configuration. Each section can have a maximum of seven tabs open at a time. If you try to add an eighth tab, the first one will be automatically removed to maintain the limit. These tabs are stored locally, which means that you can always return to them even after closing the application.

If the tab's content no longer exists, a pop-up notification will appear and the corresponding tab will close automatically.

Main workspace tabs
Below we explain the main tabs of the workspace in the Data sources, Profiling, Monitoring checks and Partition checks sections. The number of tabs differs depending on the selected element from the tree on the left.
In the Data sources section, at the connection level, you can access:
- Connection: Provides details about the connection parameters.
- Schedule: Allows you to configure of the check execution schedule at the connection level.
- Comments: Allows adding comments to your connection.
- Labels: Allows adding labels to your connection.
- Schemas: Allow importing schemas and tables.
- Data quality summary: Displays summaries of the data quality status. You have the option to choose one of two subtabs:
- Tables: This subtab provides a summary of the data quality status for tables in this connection.
- Columns: This subtab provides a summary of the data quality status for columns in this connection.
- Default grouping template: Allows setting up data grouping globally at the data source level. Learn how to configure data grouping.
- Incident grouping: Allows configuring incidents grouping level. Learn more about incidents that let you keep track of the issues that arise during data quality monitoring.
- Notifications: Allows configuring incidents and Webhooks for notifications. Learn how to configure notifications whenever a new incident is created or modified.
In the Data sources section, at the table level, you can access:
- Table: Provides details about the table and parameters concerning disabling check, error samples collection, filters, priority and stage.
- Schedule: Allows you to configure of the check execution schedule at the table level.
- Comments: Allows adding comments to your connection.
- Labels: Allows adding labels to your connection.
- Default grouping: Allows setting up data grouping at the table level. Learn how to configure data grouping.
- Incident configuration: Allows configuring incidents grouping level. Learn more about incidents that let you keep track of the issues that arise during data quality monitoring.
- Data lineage: Allows configuring data lineage. Learn more about data lineage that simplifies data tracing and helping identify the root cause of data quality issues.
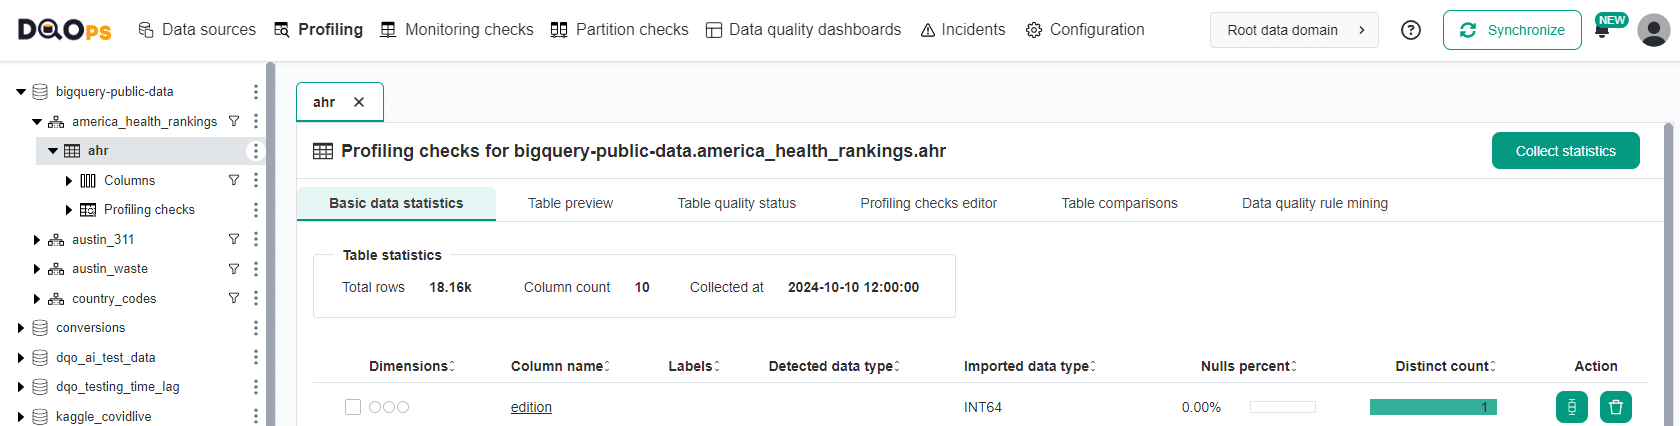
In the Profiling section, at the table level, you can access:
- Basic data statistics: Allows you to collect basic statistics about data sources during the data profiling stage.
- Table preview: Provides a summary preview of the table.
- Table quality status: Provides a summary of the results of the executed profiling checks.
- Profiling checks editor: Gives access to the Check editor of profiling checks.
- Table comparison: Enables you to identify differences between two tables (accuracy issues) using profiling checks.
- Data quality rule mining: - Gives access to the data quality rule mining engine, which allows you to automatically configure data quality checks.
In the Monitoring checks section, at the table level, you can access:
- Observability status: Provides a quick overview of trends and issues in schema changes, volume, and freshness anomalies at table level and distinct count and null percent anomalies at the column level. Follow the link to learn more about the Observability status.
- Table quality status: Provides a summary of the results of the executed monitoring checks.
- Free version: Summary of daily monitoring checks only.
- Paid versions: Summary of both daily and monthly monitoring checks.
- Data quality checks editor: Provides access to the Check editor for monitoring checks.
- Free version: Limited to running daily monitoring checks.
- Paid versions: Enables running both daily and monthly monitoring checks.
- Table comparisons: Enables you to identify differences between two tables (accuracy issues) using monitoring checks.
- Copy verified profiling checks: Allows to automatically replicate data quality checks and their parameters that were previously configured and activated within the Profiling section to Monitoring checks to continuously monitor data quality. Follow the link to learn more about copying the verified profiling check to the monitoring checks.
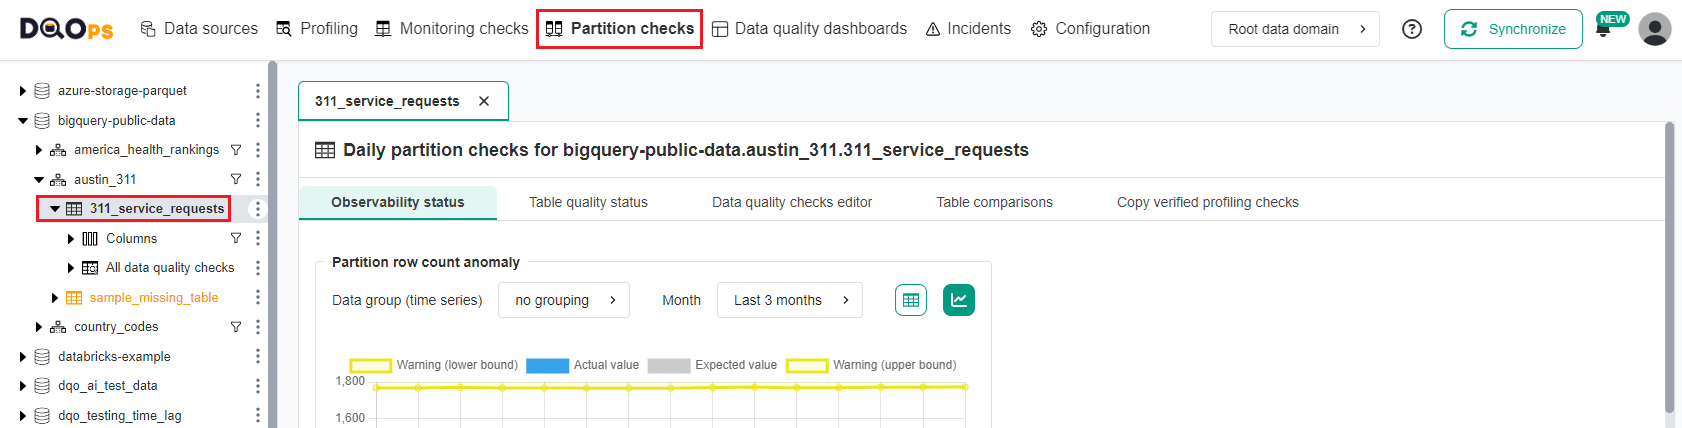
In the Partition checks section, at the table level, you can access:
- Observability status: Provides a quick overview of trends and issues in partition volume at table level and partition distinct count and null percent anomalies at the column level. Follow the link to learn more about the Observability status.
- Table quality status: Provides a summary of the results of the executed partition checks.
- Free version: Summary of daily partition checks only.
- Paid versions: Summary of both daily and monthly partition checks.
- Data quality checks editor: Provides access to the Check editor for partition checks.
- Free version: Limited to running daily partition checks.
- Paid versions: Enables running both daily and monthly partition checks.
- Table comparisons: Enables you to identify differences between two tables (accuracy issues) using partition checks using partition checks.
- Copy verified profiling checks: Allows to automatically replicate data quality checks and their parameters that were previously configured and activated within the Profiling section to Partition checks to continuously monitor data quality. Follow the link to learn more about copying the verified profiling check to the partition checks.
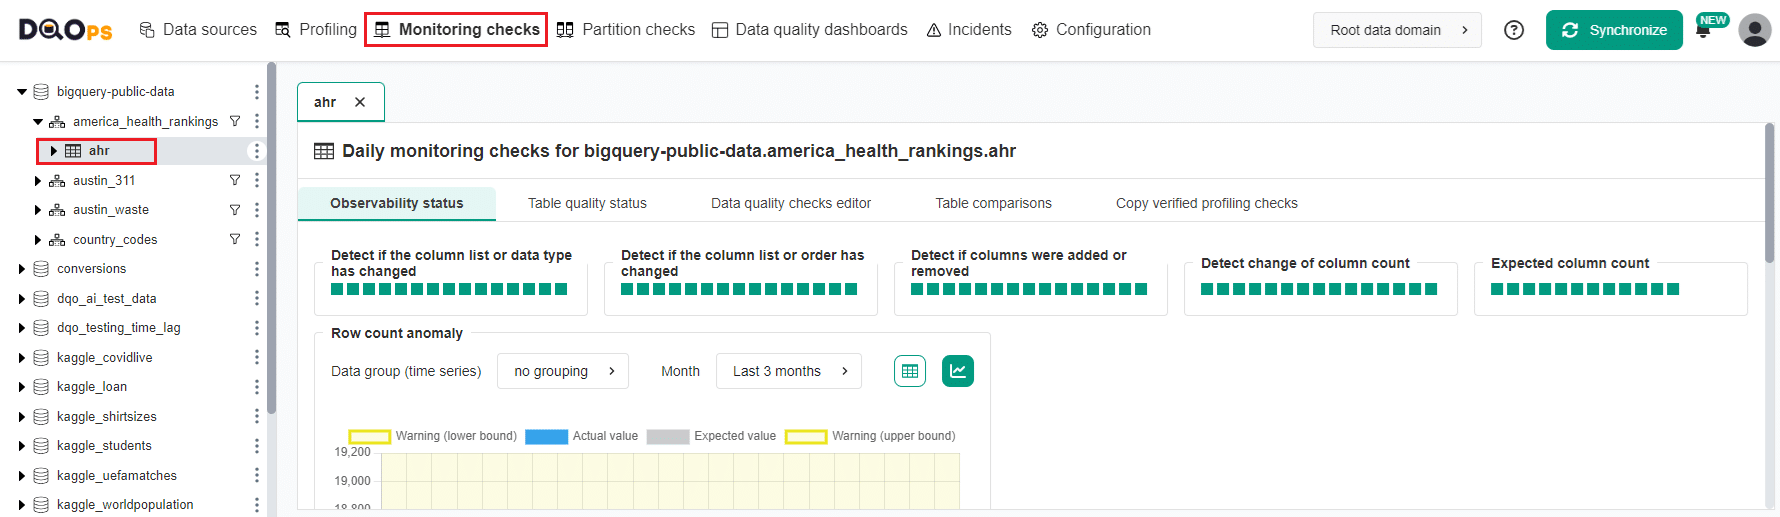
Observability status
The Observability status screen provides a quick overview of any data quality problems for the selected table or column. This allows you to proactively identify potential issues before they impact downstream processes.
With that screen, you can analyze trends in schema changes, volume, and freshness anomalies at table level and distinct count and null percent anomalies at the column level. The screen also displays a summary of data quality issues for the table or columns of choice.
The screen below provides an example of the Observability status screen at the table level in the Monitoring section.
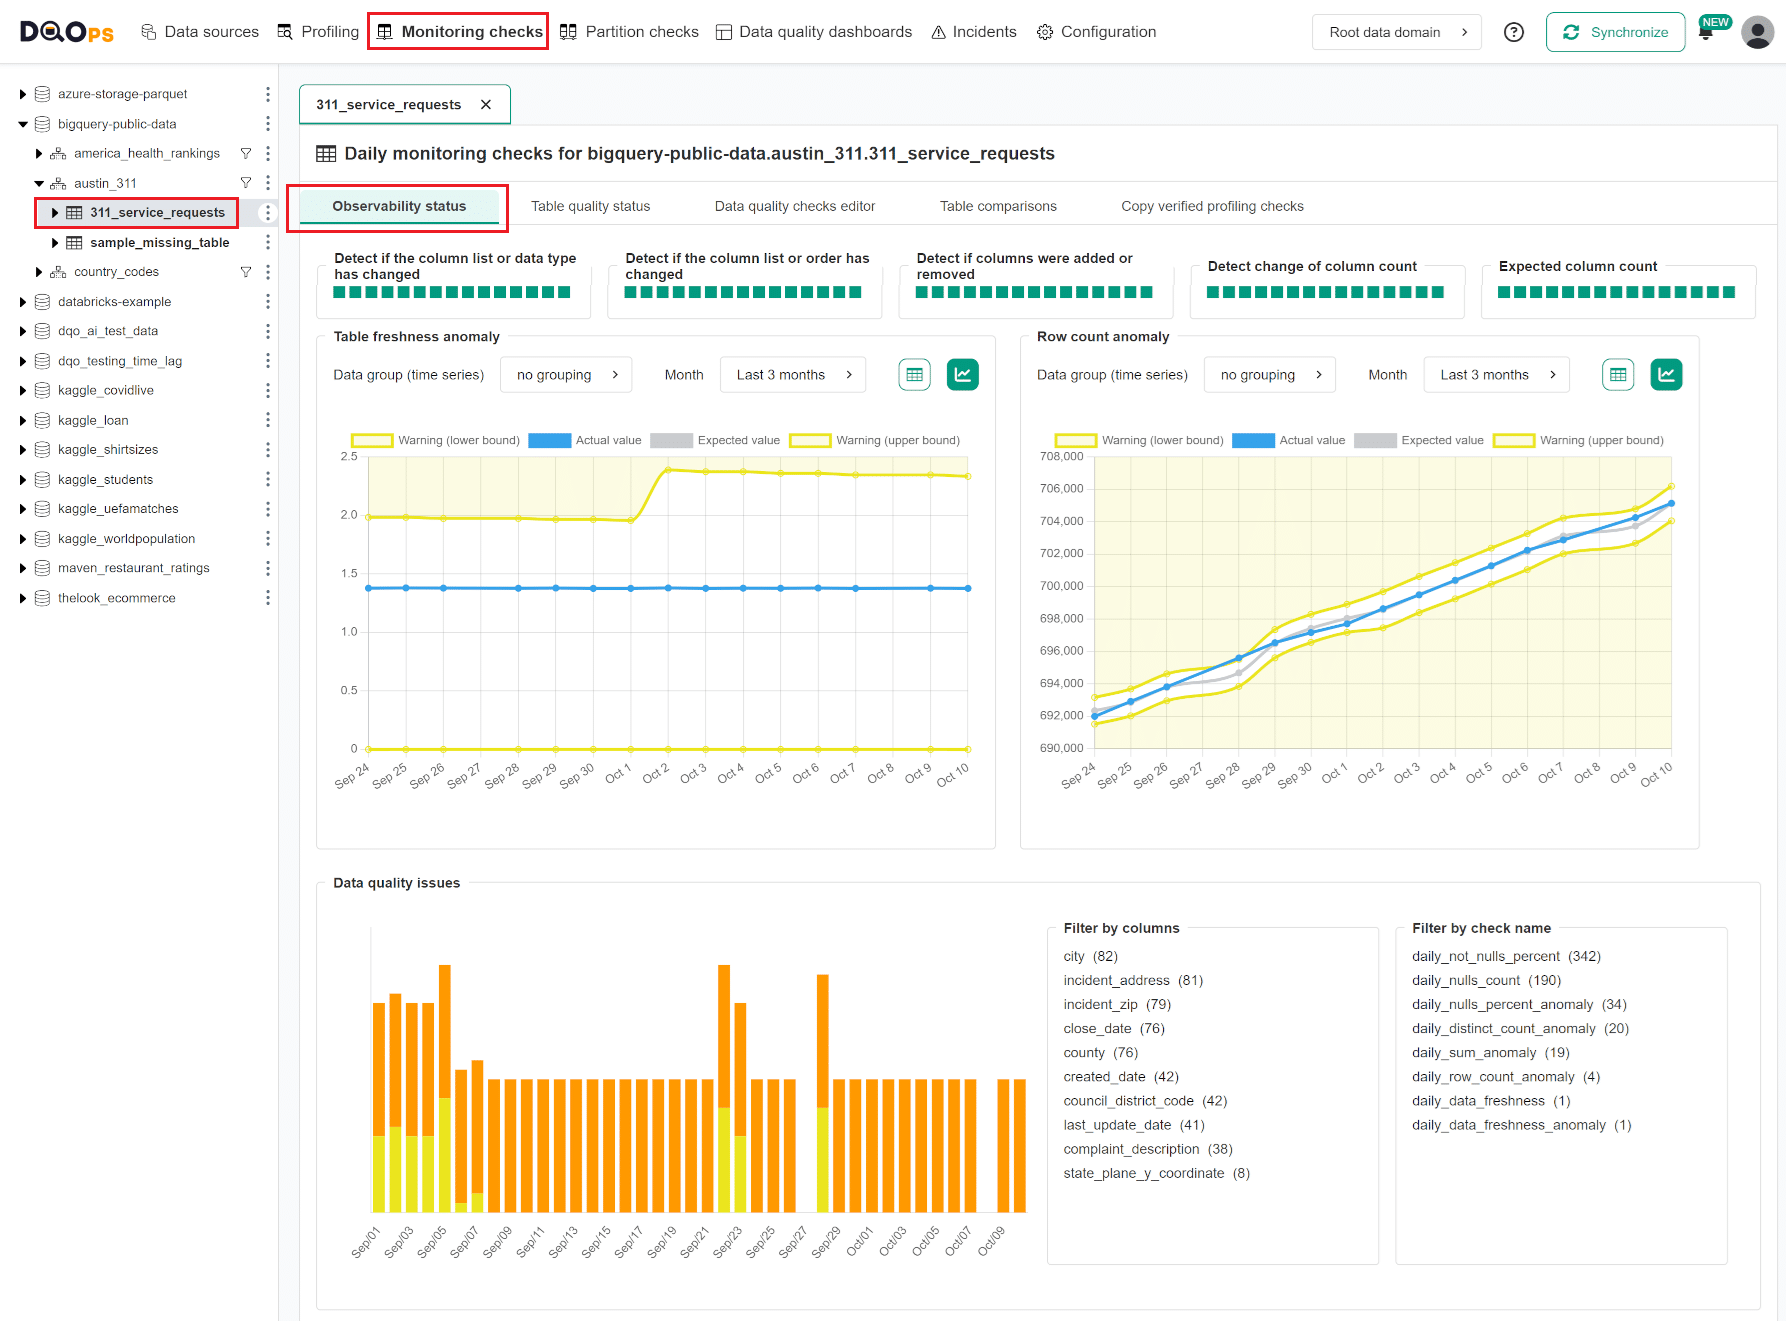
The number of elements on the screen depends on which checks have been activated. At the top of the screen, there are 5 blocks showing the last 15 results from 5 checks in the schema category. These results are displayed as squares with colors indicating the check's result.
Below, there are line graphs that display table freshness and volume anomalies.
Towards the bottom of the screen, there is a column chart that provides a summary of data quality issues for the selected table.
For more details, please visit the data observability documentation.
Table quality status
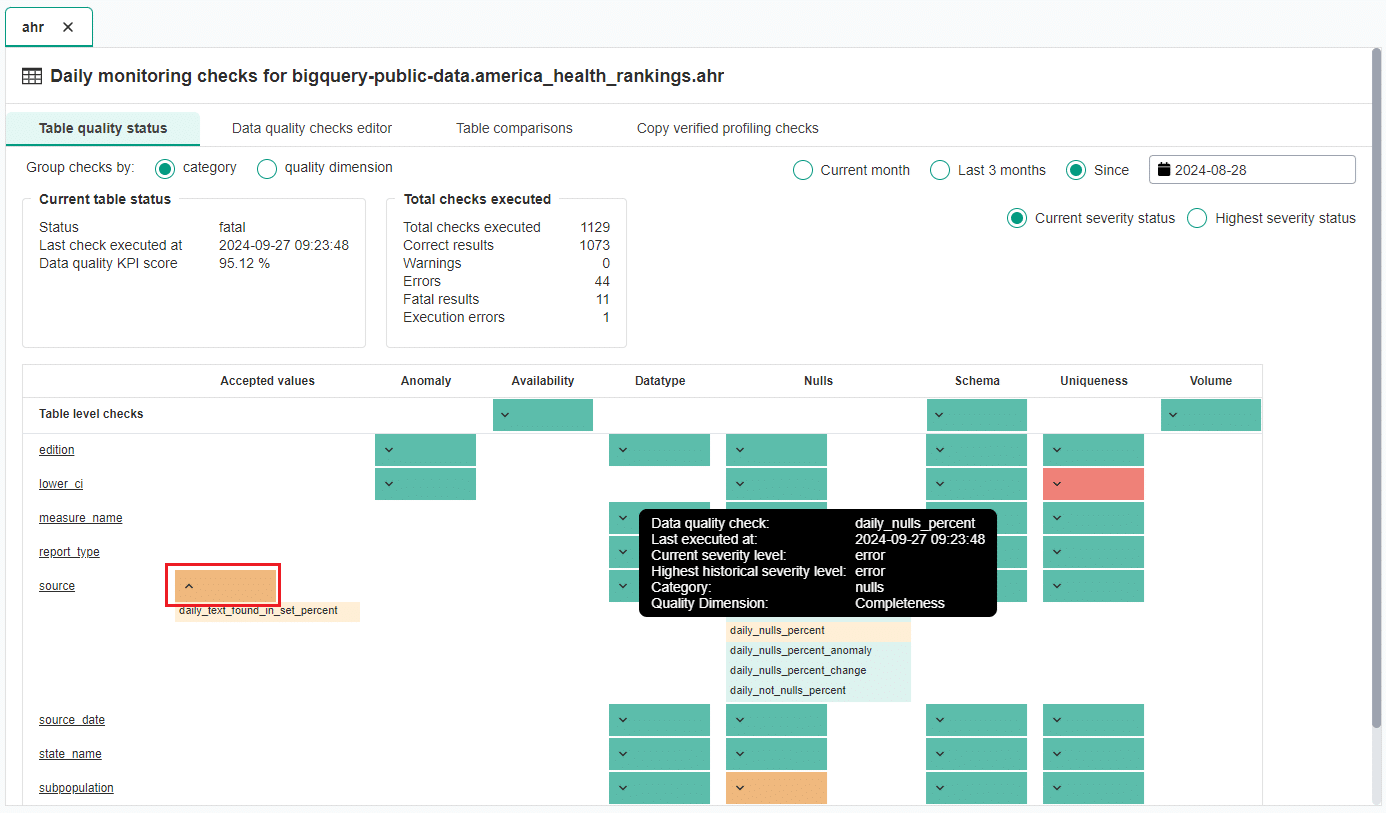
In the Profiling, Monitoring checks, and Partition checks, there is a tab called Table quality status. This tab provides a summary of the results of the executed checks, grouped by check category or data quality dimension.
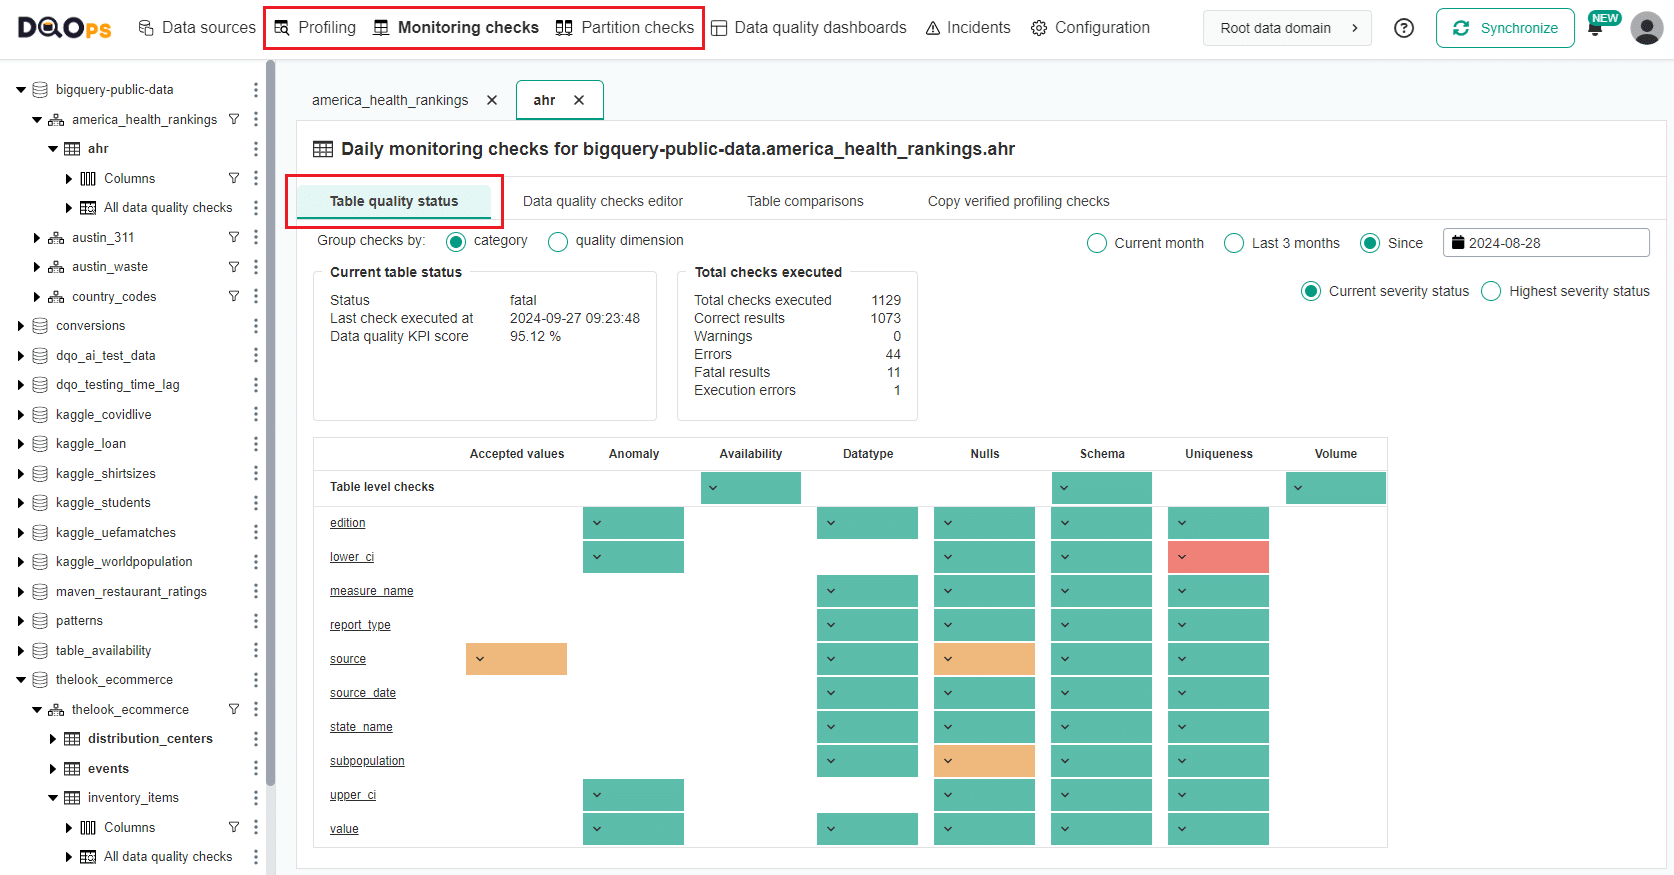
By using the radio buttons in the upper right corner of the screen, you can view the results for the Current month, Last 3 months, or select a specific starting date. You can also switch between viewing the Current severity status and the Highest severity status.
There are two tables on the left-hand side of the screen, which show the Current table status and the summary of the Total checks executed.
Below these tables, there is a table with the severity statuses divided by the check category or data quality dimension, depending on the selected option. The first row displays the results from the table-level checks executed on the table, while the following rows show the column names and the results from the executed column-level checks. The color indicate the current or the highest severity status:
- Green for a correct result
- Yellow for a warning
- Orange for an error
- Red for a fatal error
You can view the list of executed checks by clicking on the arrow on the left. Hovering over a check name will display more details.
Check editor
The Check editor screen allows you to work with checks. There are two types of checks editors Simplified and Advanced. Both types of editors share the same core functionalities, such as activation, deactivation and run of table and column-level checks, viewing results, and accessing additional settings.
The primary difference lies in the ability to define multiple severity levels in the Advanced mode. Learn more about threshold levels
To open the check editor, simply click on the Profiling, Monitoring checks, or Partition checks section. Then, select a table from the tree view on the left, and choose the Data quality checks editor tab in the workspace. To access the check editor for the column-level checks, click on the column in the tree view, and the check editor will open in the workspace.
Simplified check editor (Default)
The Simplified check editor is the default view when you open the DQOps platform. It provides the basic check configuration allowing you to activate checks with a single issue severity level (warning, error, or fatal) from a dropdown menu and access essential check settings and actions.
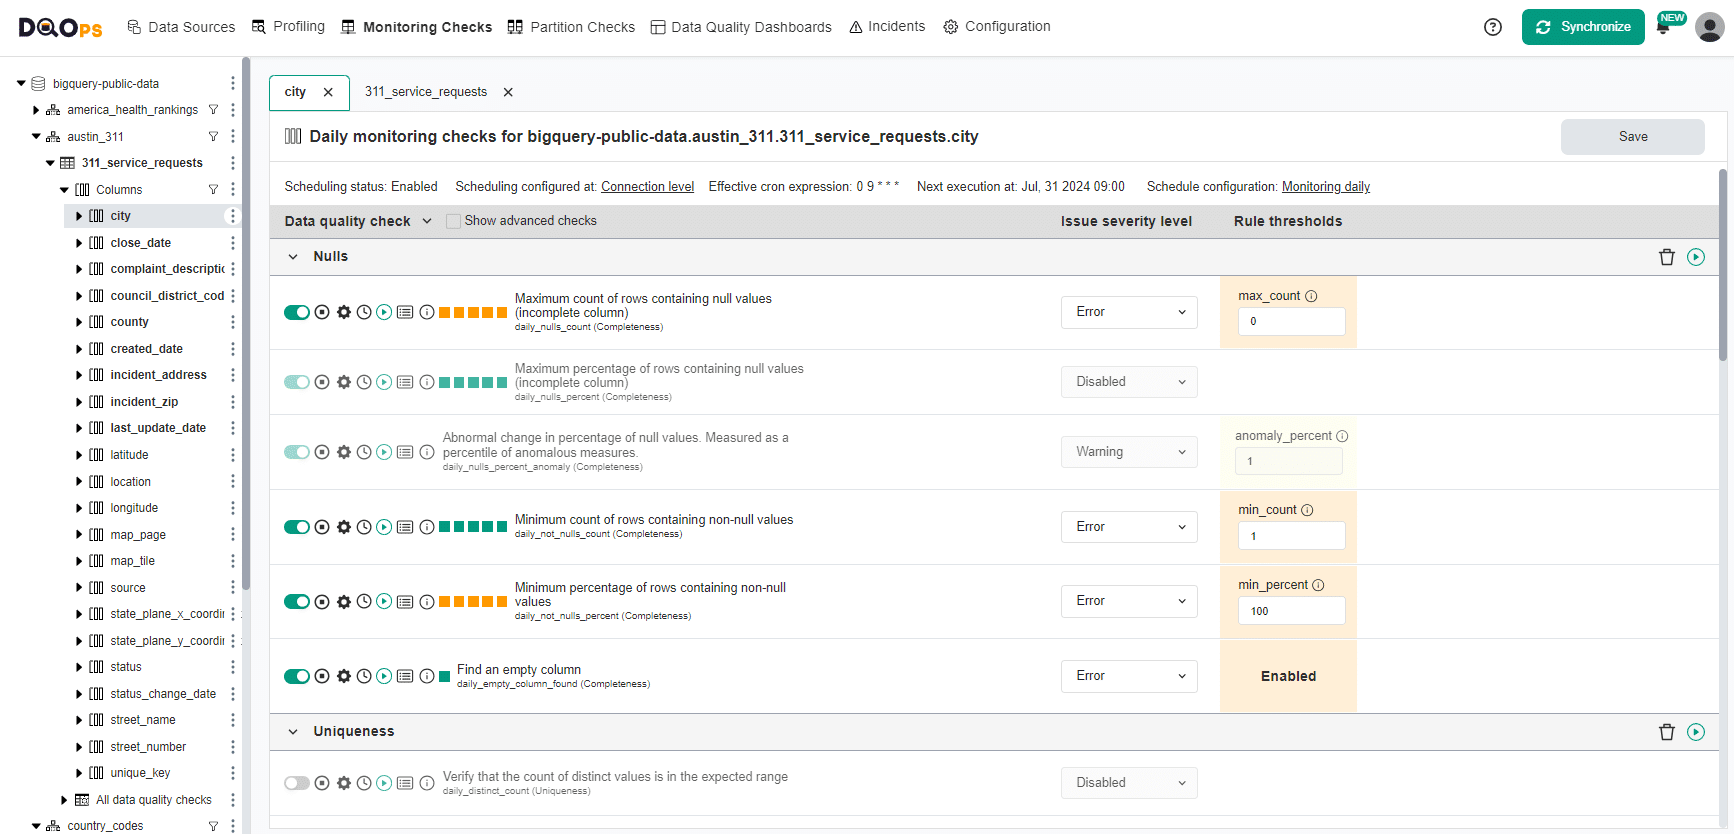
To change the issue severity level, simply click on the dropdown menu and choose the desired severity level. If you select the "Multiple levels" option, you will switch to the Advanced check editor.
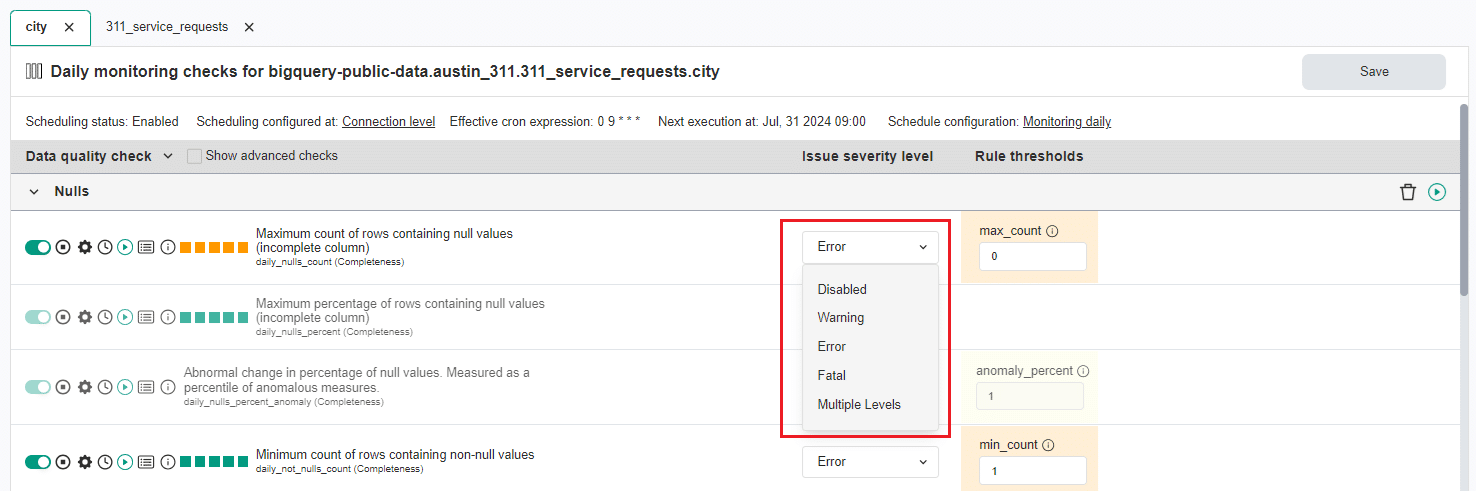
Advanced check editor
In the advanced mode, you can configure different thresholds for warning, error, and fatal error severity levels.
To access the Advanced mode, select the Multiple levels option from the Issue severity level dropdown menu in the simplified data check editor, as shown above. Once you have made this selection, you will receive a prompt informing you that the editor will switch to an advanced mode.
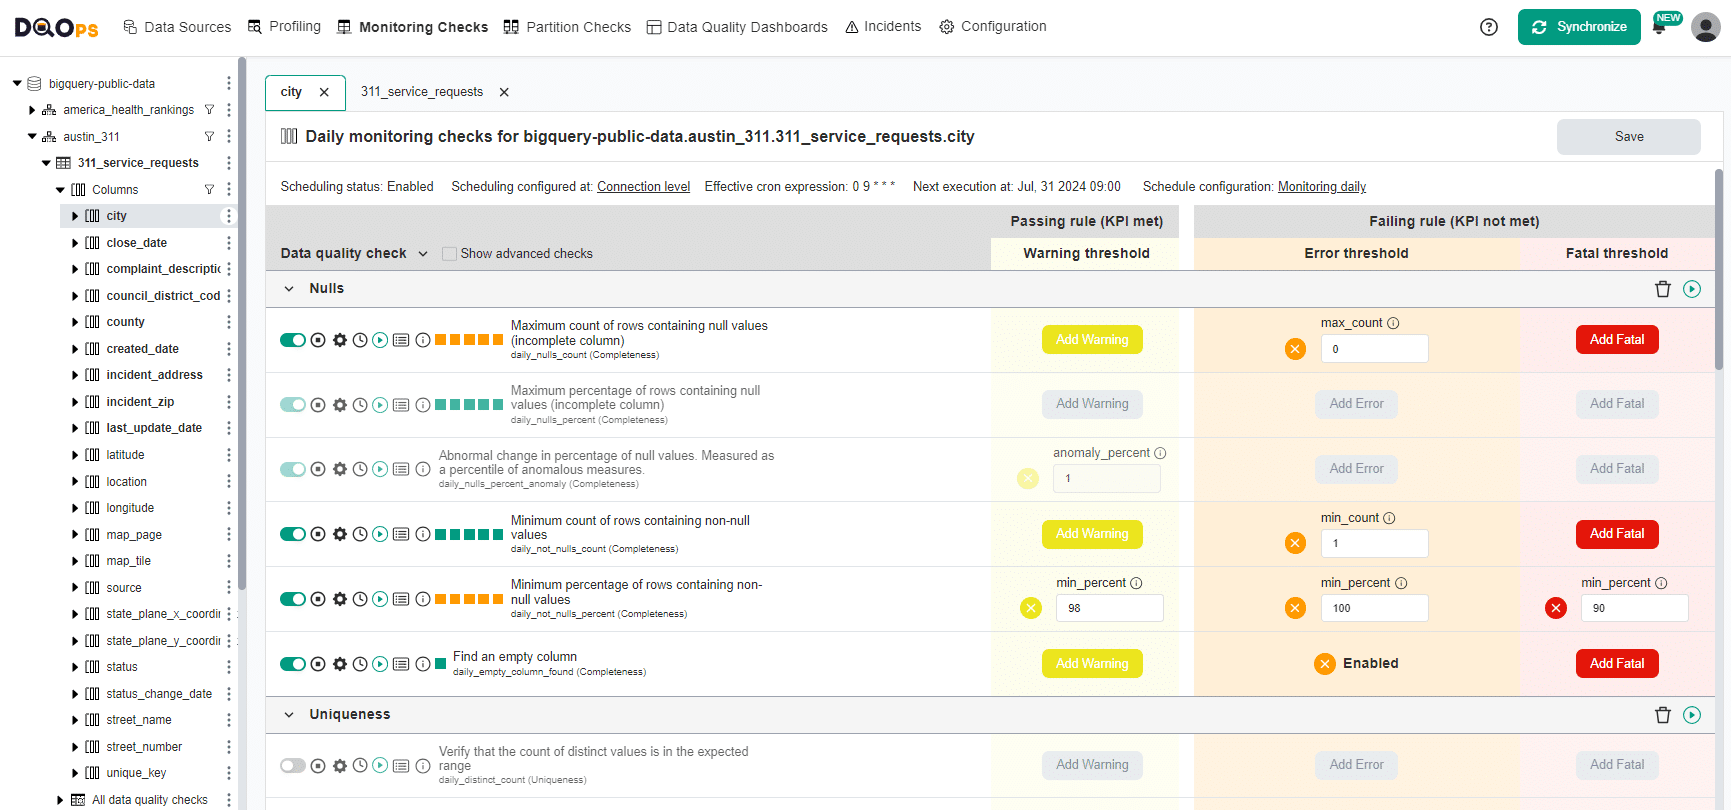
Common Check editor features
Both the advanced and simplified checks editors share the following elements:
At the top of the check editor, you will find information about the type of checks (profiling, monitoring, or partition), and the full path name containing connection, schema, table name, and column name for the column-level check editor.
Below this, you will find information about the schedule configuration with the time of the next check execution. Additionally, in the Partition checks section, there is additional information about the configuration of the date partitioning column.
The table with data quality checks contains a list of checks divided into different data quality subcategories. You can expand and collapse these categories by clicking on an arrow. Learn more about the different check subcategories. By clicking on the Show advanced checks checkbox, located at the top of the table, you can view all checks available in DQOps.
On the left of the name of each check, there are several buttons and icons. Under the name of the check, there is a technical check name, and in brackets, the data quality dimension category to which this check belongs.
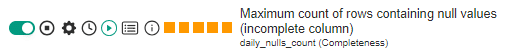
The buttons and icons located on the left side of each check name allow you to perform various actions:
- Activate/Deactivate checks: A Toggle button (light green for checks activated with data quality policies and darker green for checks activatad manually or with rule miner) enables activating or deactivating checks. You can learn more about configuring check policies.
- Disable checks: Use the Disable button to disable checks.
-
Check Settings: Access check settings to configure custom data groupings, modify inclusion/exclusion in KPI and SLA, rename data quality dimension, add SQL WHERE conditions, modify scheduling settings, or add labels.
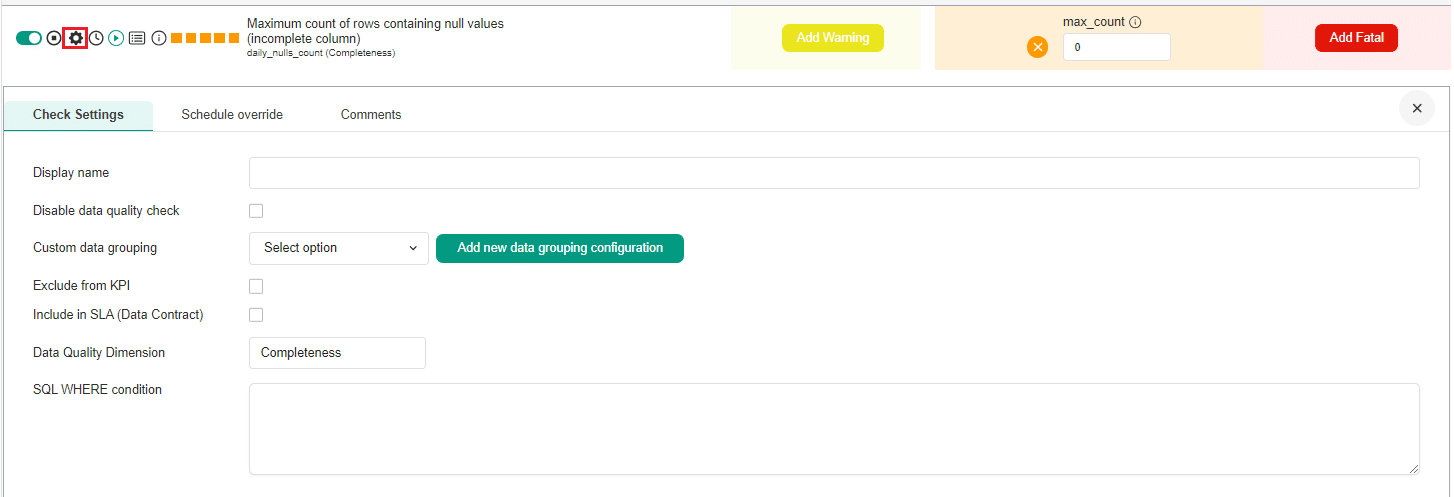
-
Check schedule status: Gives information about the status of the check schedule status (disabled or enabled schedule).
- Run data quality checks: Trigger manual execution of checks.
-
View Check Results: Access detailed results for checks, sensor readouts, and execution errors, as well as error sampling for column checks
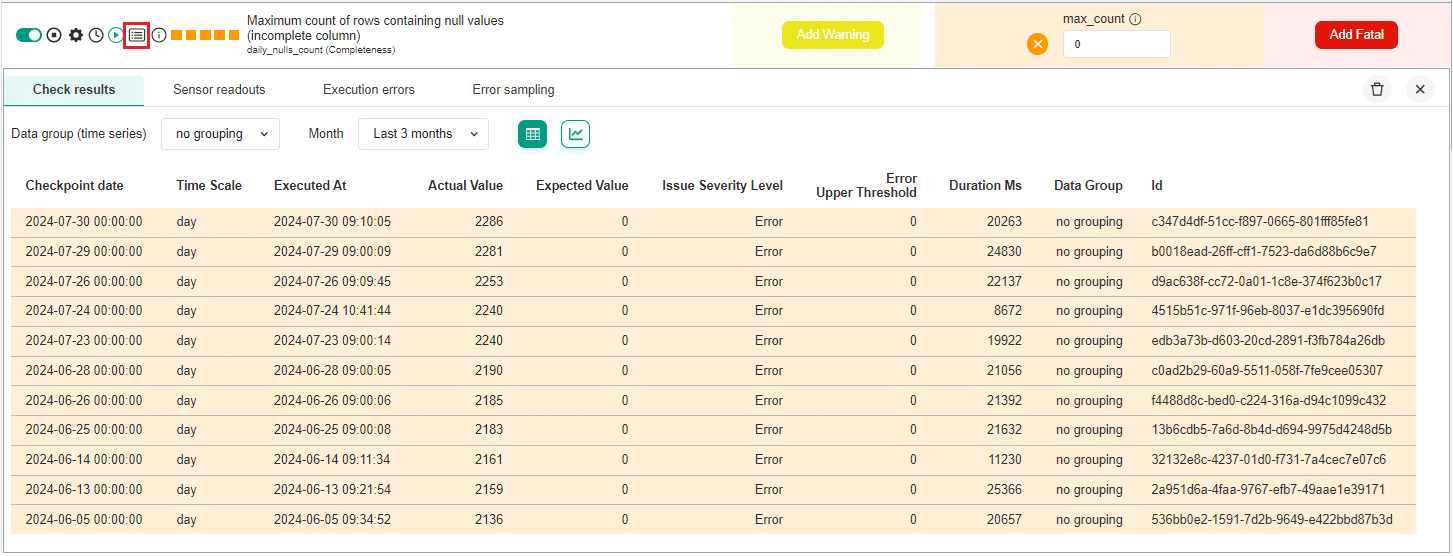
-
Check Information: View tooltip with detailed information about the specific check.
- Check results colored square: Indicates the result of the last check run:
- Green for a correct result
- Yellow for a warning
- Orange for an error
- Red for a fatal error
- Black for execution error.
Notifications
Notifications provide a log of all completed tasks, such as running checks, gathering statistics, importing metadata, synchronizing folders, etc.

You can use the notifications to access a complete log of all jobs that have been executed. This log allows you to check the status of each action, which can be "finished," "failed," "running," "waiting," "queued," or "canceled." Additionally, you can expand each job entry to view sub-jobs and access more detailed information about specific tasks.
Enable and disable scheduler
In the top part of notifications window you can start and stop the scheduler. You can learn more about scheduling here.

Cancel a queued or running job
If the job is queued or running you can cancel or stop it by clicking the X button.

Run checks summary
You can view the result of executed checks by simply hovering on run checks job. Color of the square represents the highest severity status of the results (green for a correct result, yellow for a warning, orange for an error and red for a fatal error).

What's next
- Check the detailed process of running data quality checks and all DQOps engine internal components involved in the process in the Data quality check execution flow section.
- You haven't installed DQOps yet? Check the detailed guide on how to install DQOps using pip or run DQOps as a Docker container.
- DQOps allows you to keep track of the issues that arise during data quality monitoring and send alert notifications directly to Slack. Learn more about incidents and Slack notifications.