Last updated: July 22, 2025
How to detect duplicate data and measure uniqueness, examples
Read this guide to learn how to detect duplicate data and how distinct values, data uniqueness, and duplicate data are related to each other.
The data uniqueness and duplicate detection checks are configured in the uniqueness category in DQOps.
What is data uniqueness
The problem of duplicate data is simple, duplicate values cannot be used to identify rows, because we don't know which row is the rightful one, and which is the duplicate.
We use the term data uniqueness to refer to a perfect situation when all identity columns contain unique values, and there are no duplicate data.
Why data uniqueness matters
Let's look at an example dictionary table storing a dictionary of product categories in an eCommerce platform.
category_id |
category_name |
|
|---|---|---|
| 1 | Shoes | |
| 2 | T-shirts | |
| 3 | Underwear | <- the first row for the category_id 3 |
| 3 | Pants | <- duplicate row |
We can see that two categories have the same value for the key column category_id, which should be unique. Is it Underwear or Pants?
Which data must be unique
Not all columns must contain unique values. The columns that store measures, decimal values, floating-point numbers, dates, comments, or foreign keys to other tables most likely contain duplicate values, which is fine.
The columns that must contain unique values are:
-
Primary key columns.
-
Identity columns.
-
Business keys.
-
Alternate identifiers, such as a company name, should be unique.
These identifiers are used to identify rows in dictionaries or dimension tables uniquely. Those types of tables should be analyzed for duplicates.
How data gets duplicated
Duplicate values are rare in OLTP databases that can enforce unique constraints. The database engine discards transactions that are trying to insert duplicate rows. Duplicate values are present only when the table's schema does not enforce uniqueness constraints.
However, duplicate values are prominent in data lakes and data warehouses. Big Data platforms trade query performance with data consistency, not supporting uniqueness constraints. For example, parquet files do not support any uniqueness enforcement.
Duplicate records appear in the data lake or a data warehouse for many reasons.
-
The data pipeline loaded the same data again without cleaning the old data.
-
Multiple parallel operations loaded the same data twice.
-
The same source data was already duplicated in various source files.
-
The same data was loaded from two sources and aggregated in a single table.
-
A single step of a data pipeline was restarted. For example, Apache Airflow restated a single data-loading task inside a DAG.
-
The business key column was truncated, losing the differencing suffix of the business key. For example, the length of the company_name column is ten characters. Two similar yet different company names, "Great Corp Inc." and "Great Corp LLC." are truncated to a non-unique "Great Corp" name.
We can avoid issues if we analyze the key columns for duplicate values. Duplicate entries in the dictionary and dimension tables will affect all SQL queries that use joins. The dashboards will show wrong measures because fact rows referencing duplicate rows will be duplicated.
How DQOps detects duplicates
Duplicate detection depends on the behavior of the COUNT function in all SQL engines.
-
A
COUNT(column_name)counts all non-null values in a column. It is basically a row count of the table for rows containing a non-null value. -
A
COUNT(DISTINCT column_name)finds and counts all non-null, unique values in a column. It is also called a distinct count.
DQOps uses these two methods of counting values in a column to calculate uniqueness metrics.
-
The distinct_count check calculates the
COUNT(DISTINCT column_name)value, which is the number of distinct values in a column, even if they are unique or duplicated. -
The duplicate_count check calculates both the distinct count of values and the count of non-null values. The difference between them is the number of duplicated values that appear more than once in the column.
All other uniqueness checks provided by DQOps are variants of these two data quality checks. The other checks measure the percentage of duplicate values or use anomaly detection on time series to detect changes to the number of distinct or duplicate values.
Uniqueness statistics
DQOps shows the uniqueness statistics captured by the data profiler on two screens: the list of columns in the profiling section and a column's profiling summary screen.
Table statistics
The table-level profiling statistics screen shows only the number of distinct values for each column. Columns with fewer unique values are highlighted with a darker green background color. These are the columns that potentially contain duplicate values.

Column statistics
The data profiling screen for a column shows all data uniqueness metrics captured by the DQOps data profiler.

Distinct count
The count of distinct values is the number of different values regardless of how many times they appear in the dataset.
The sample dataset shown earlier has three distinct values of the category_id column and four distinct values of the category_name column.
category_id |
category_name |
|
|---|---|---|
| 1 | Shoes | |
| 2 | T-shirts | |
| 3 | Underwear | |
| 3 | Pants | <- another appearance of the category_id value |
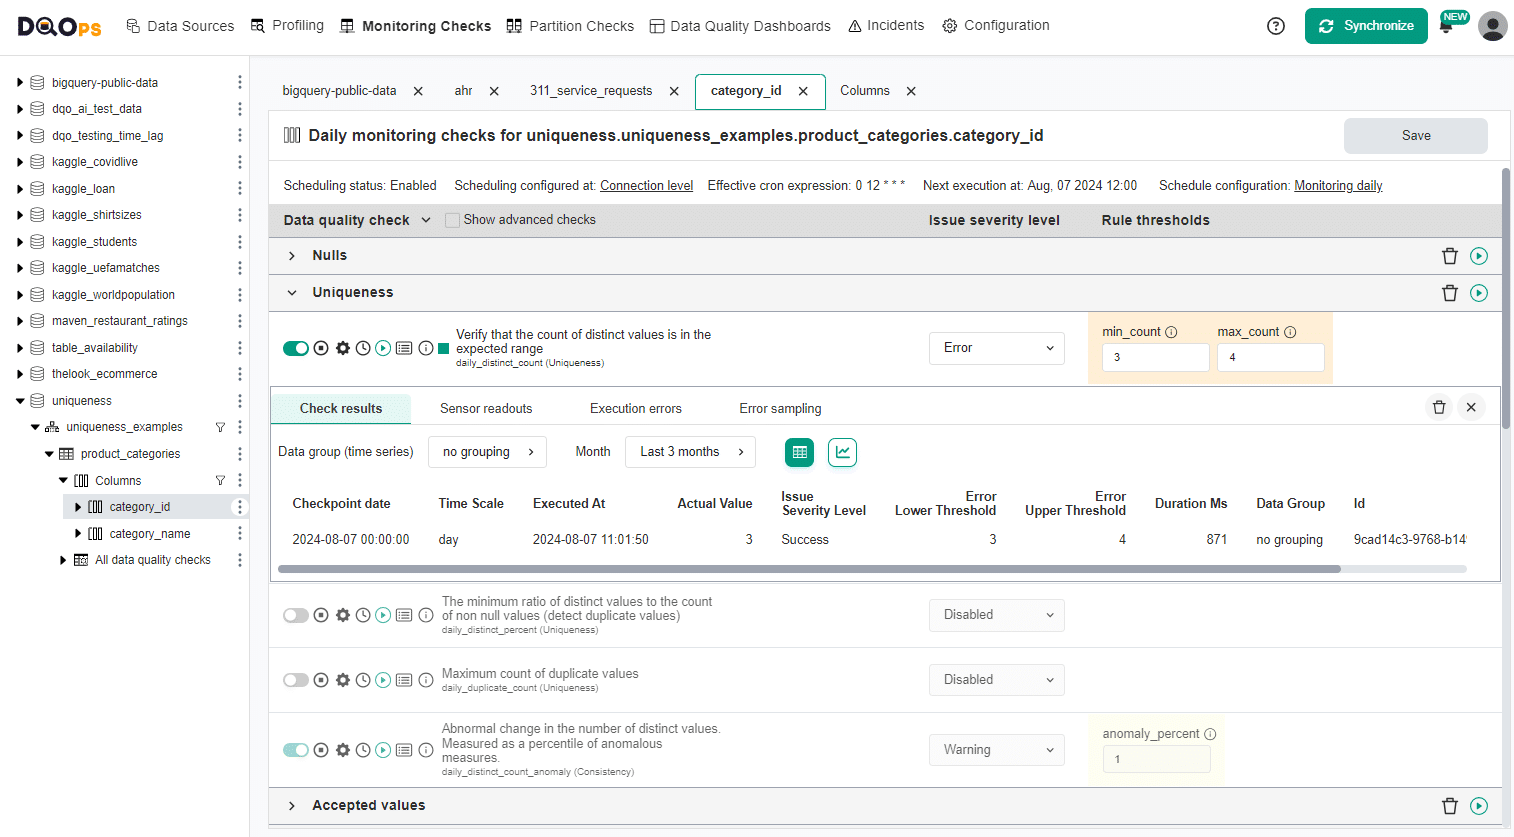
Validating distinct count in UI
The distinct_count check verifies that the count of distinct values is within an accepted range. The range is defined by setting the min_count and max_count parameters.
Validating distinct count in YAML
The configuration of the distinct_count check is simple.
Distinct percent
The distinct_percent check compares the count of distinct values to the count of all non-null values.
It is a measure of data duplication. The formula is 100.0 * COUNT(DISTINCT column_name) / COUNT(column_name).
A value below 100% indicates that the column contains duplicate values.
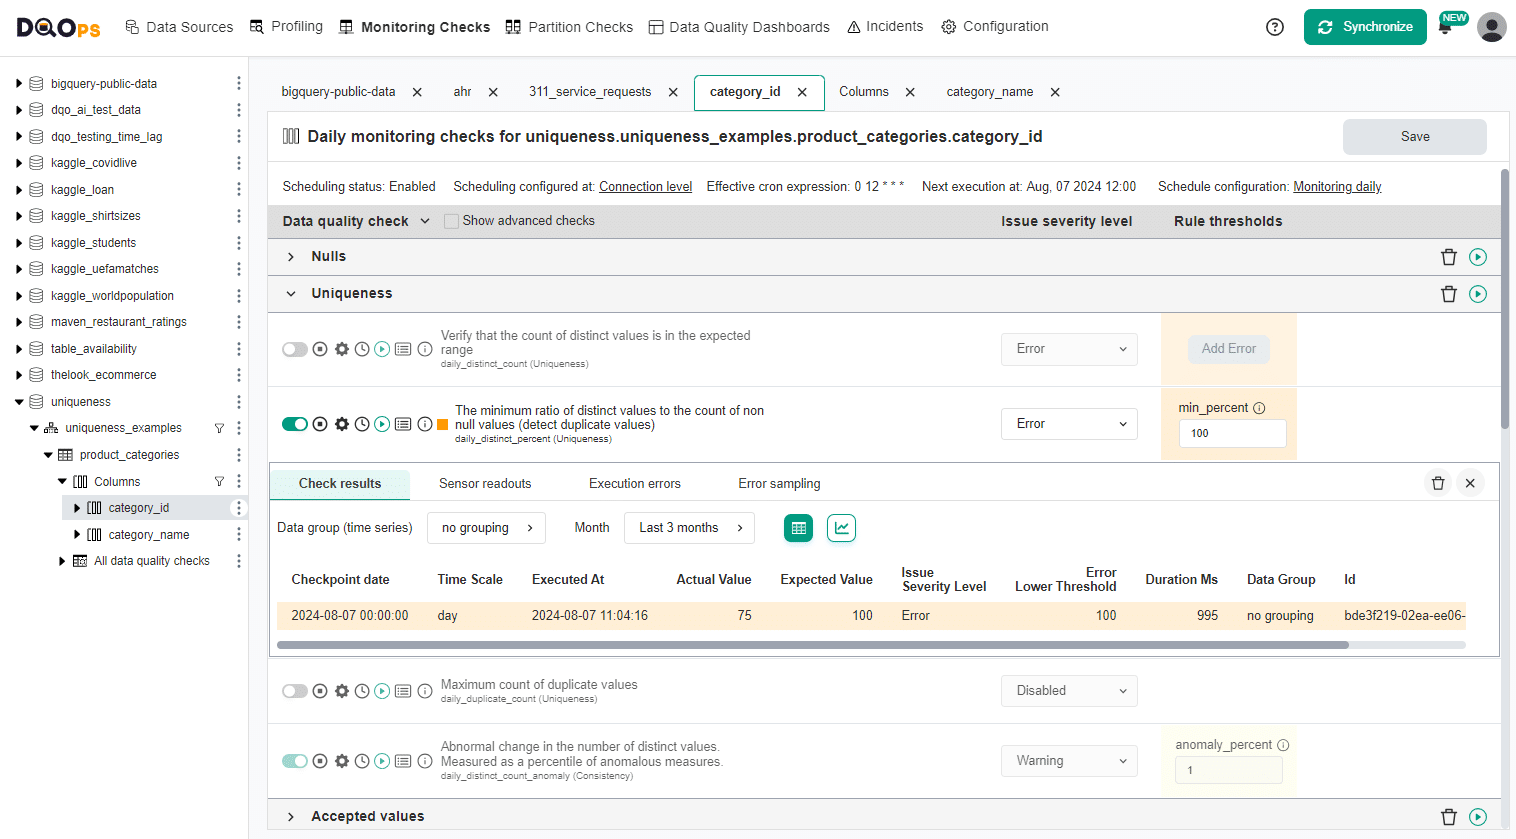
Validating distinct percent in UI
The distinct_percent check has one parameter, the max_percent value.
Validating distinct percent in YAML
The configuration of the distinct_percent check in a YAML file is shown below.
Duplicate count
The duplicate_count check finds and counts duplicate values.
It compares the count of non-null values and the count of distinct values.
The difference calculated by the expression COUNT(column_name) - COUNT(DISTINCT column_name) returns the number of duplicates.
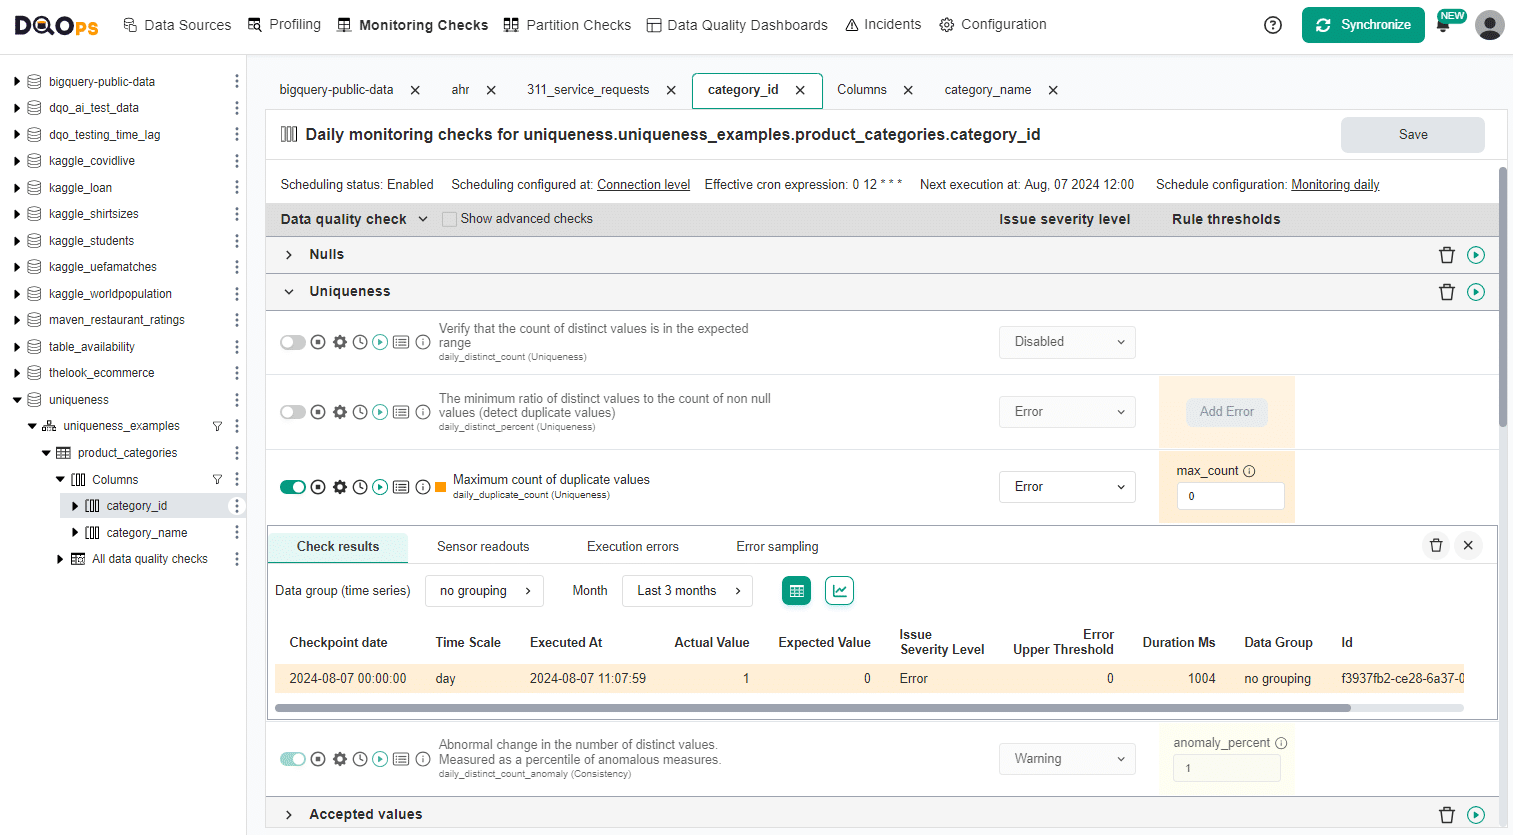
Finding duplicates in UI
The duplicate_count check takes one parameter max_count, which is the maximum accepted number of duplicate values.
Duplicates error sampling in UI
To assist with identifying the root cause of errors and cleaning up the data, DQOps offers error sampling for uniqueness checks. You can view representative examples of data that do not meet the specified data quality criteria by clicking on the Error sampling tab in the results section.

For additional information about error sampling, please refer to the Data Quality Error Sampling documentation.
Finding duplicates in YAML
The configuration of the duplicate_count check in a YAML file is shown below.
Distinct count anomalies
DQOps activates the default data observability check for distinct count anomaly detection. The daily_distinct_count_anomaly check needs 30 days to monitor the distinct count and adapt to the dynamics of this metric before it can detect anomalies. The default configuration of the daily_distinct_count_anomaly raises a warning severity issue when the change of the distinct count is in the top 1% of the most significant changes.
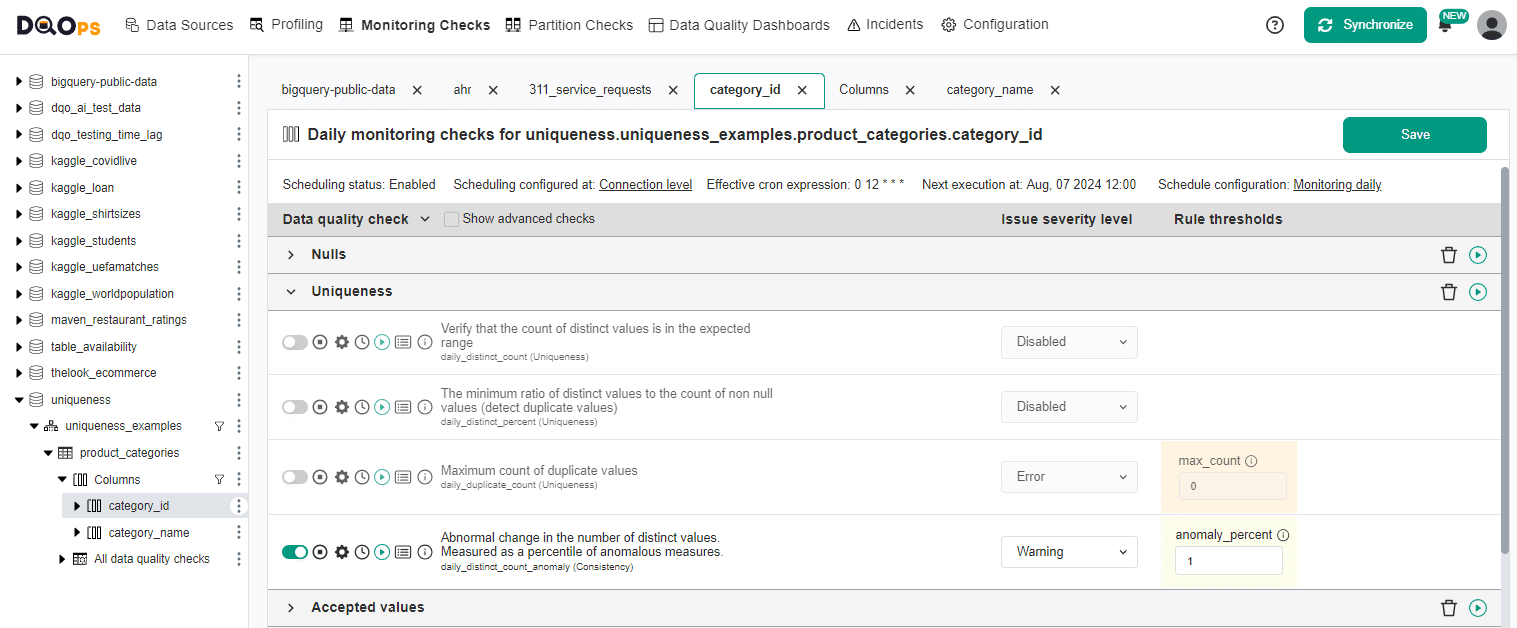
Distinct count anomaly detection in UI
The default configuration of the daily_distinct_count_anomaly check is shown below. The check will show the first values after 30 days. However, the check will not reveal any results if the distinct count has been unchanged for the last three months. That is because the time series anomaly detection rule needs to detect the scale of day-to-day changes.
Distinct count anomaly detection in YAML
The configuration of the daily_distinct_count_anomaly check is shown below.
Multi-column duplicates
DQOps can also detect multi-column duplicates. The following data comes from a public dataset containing annual health measures for each state in the US. The table does not have a primary key column.
The records should be unique for each combination of the edition, report_type, measure_name, state_name, and subpopulation.
| edition | report_type | measure_name | state_name | subpopulation | value | lower_ci | upper_ci | source | source_date |
|---|---|---|---|---|---|---|---|---|---|
| 2021 | 2021 Health Disparities | Able-Bodied | West Virginia | American Indian/Alaska Native | 57.0 | 45.0 | 69.0 | U.S. Census Bureau, American Community Survey PUMS | 2015-2019 |
| 2021 | 2021 Health Disparities | Able-Bodied | Vermont | American Indian/Alaska Native | 58.0 | 47.0 | 70.0 | U.S. Census Bureau, American Community Survey PUMS | 2015-2019 |
| 2021 | 2021 Health Disparities | Able-Bodied | Kentucky | American Indian/Alaska Native | 60.0 | 54.0 | 65.0 | U.S. Census Bureau, American Community Survey PUMS | 2015-2019 |
| 2021 | 2021 Health Disparities | Able-Bodied | West Virginia | Less Than High School | 61.0 | 60.0 | 63.0 | U.S. Census Bureau, American Community Survey PUMS | 2015-2019 |
| 2021 | 2021 Health Disparities | Able-Bodied | District of Columbia | American Indian/Alaska Native | 62.0 | 49.0 | 75.0 | U.S. Census Bureau, American Community Survey PUMS | 2015-2019 |
Configuring multi-column duplicate checks
A table-level uniqueness check detects duplicates in a combination of columns. When all columns are used, it will identify duplicate records in a table with the complete rows.
Detect multi-column duplicates in UI
The duplicate records check is available in count and percentage versions.
The duplicate_records_count check counts the distinct records based on the selected columns in columns parameter.
The duplicate_records_percent check compares the count of distinct records to the count of all records excluding that containing only nulls based on the selected columns in columns parameter.
The multi-column uniqueness checks are available under the table in the tree on the left, in the Data quality checks editor tab.

To select the columns used for the duplicate verification, click the columns editor.
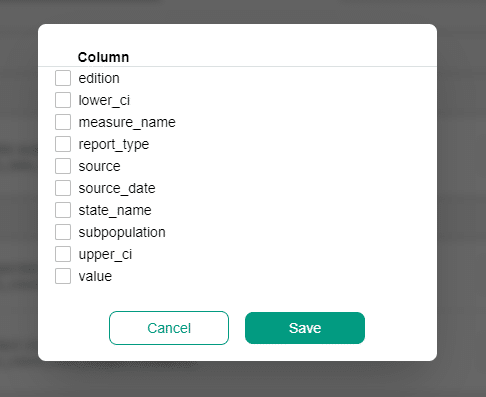
When columns are not configured or none are selected, then all columns are implicitly used by the uniqueness check.
Detect multi-column duplicates in YAML
The configuration of the duplicate_records_percent check in a YAML file is shown below.
Configuring other uniqueness checks
The DQOps data quality check editor shows the remaining uniqueness checks after clicking the Show advanced checks checkbox.
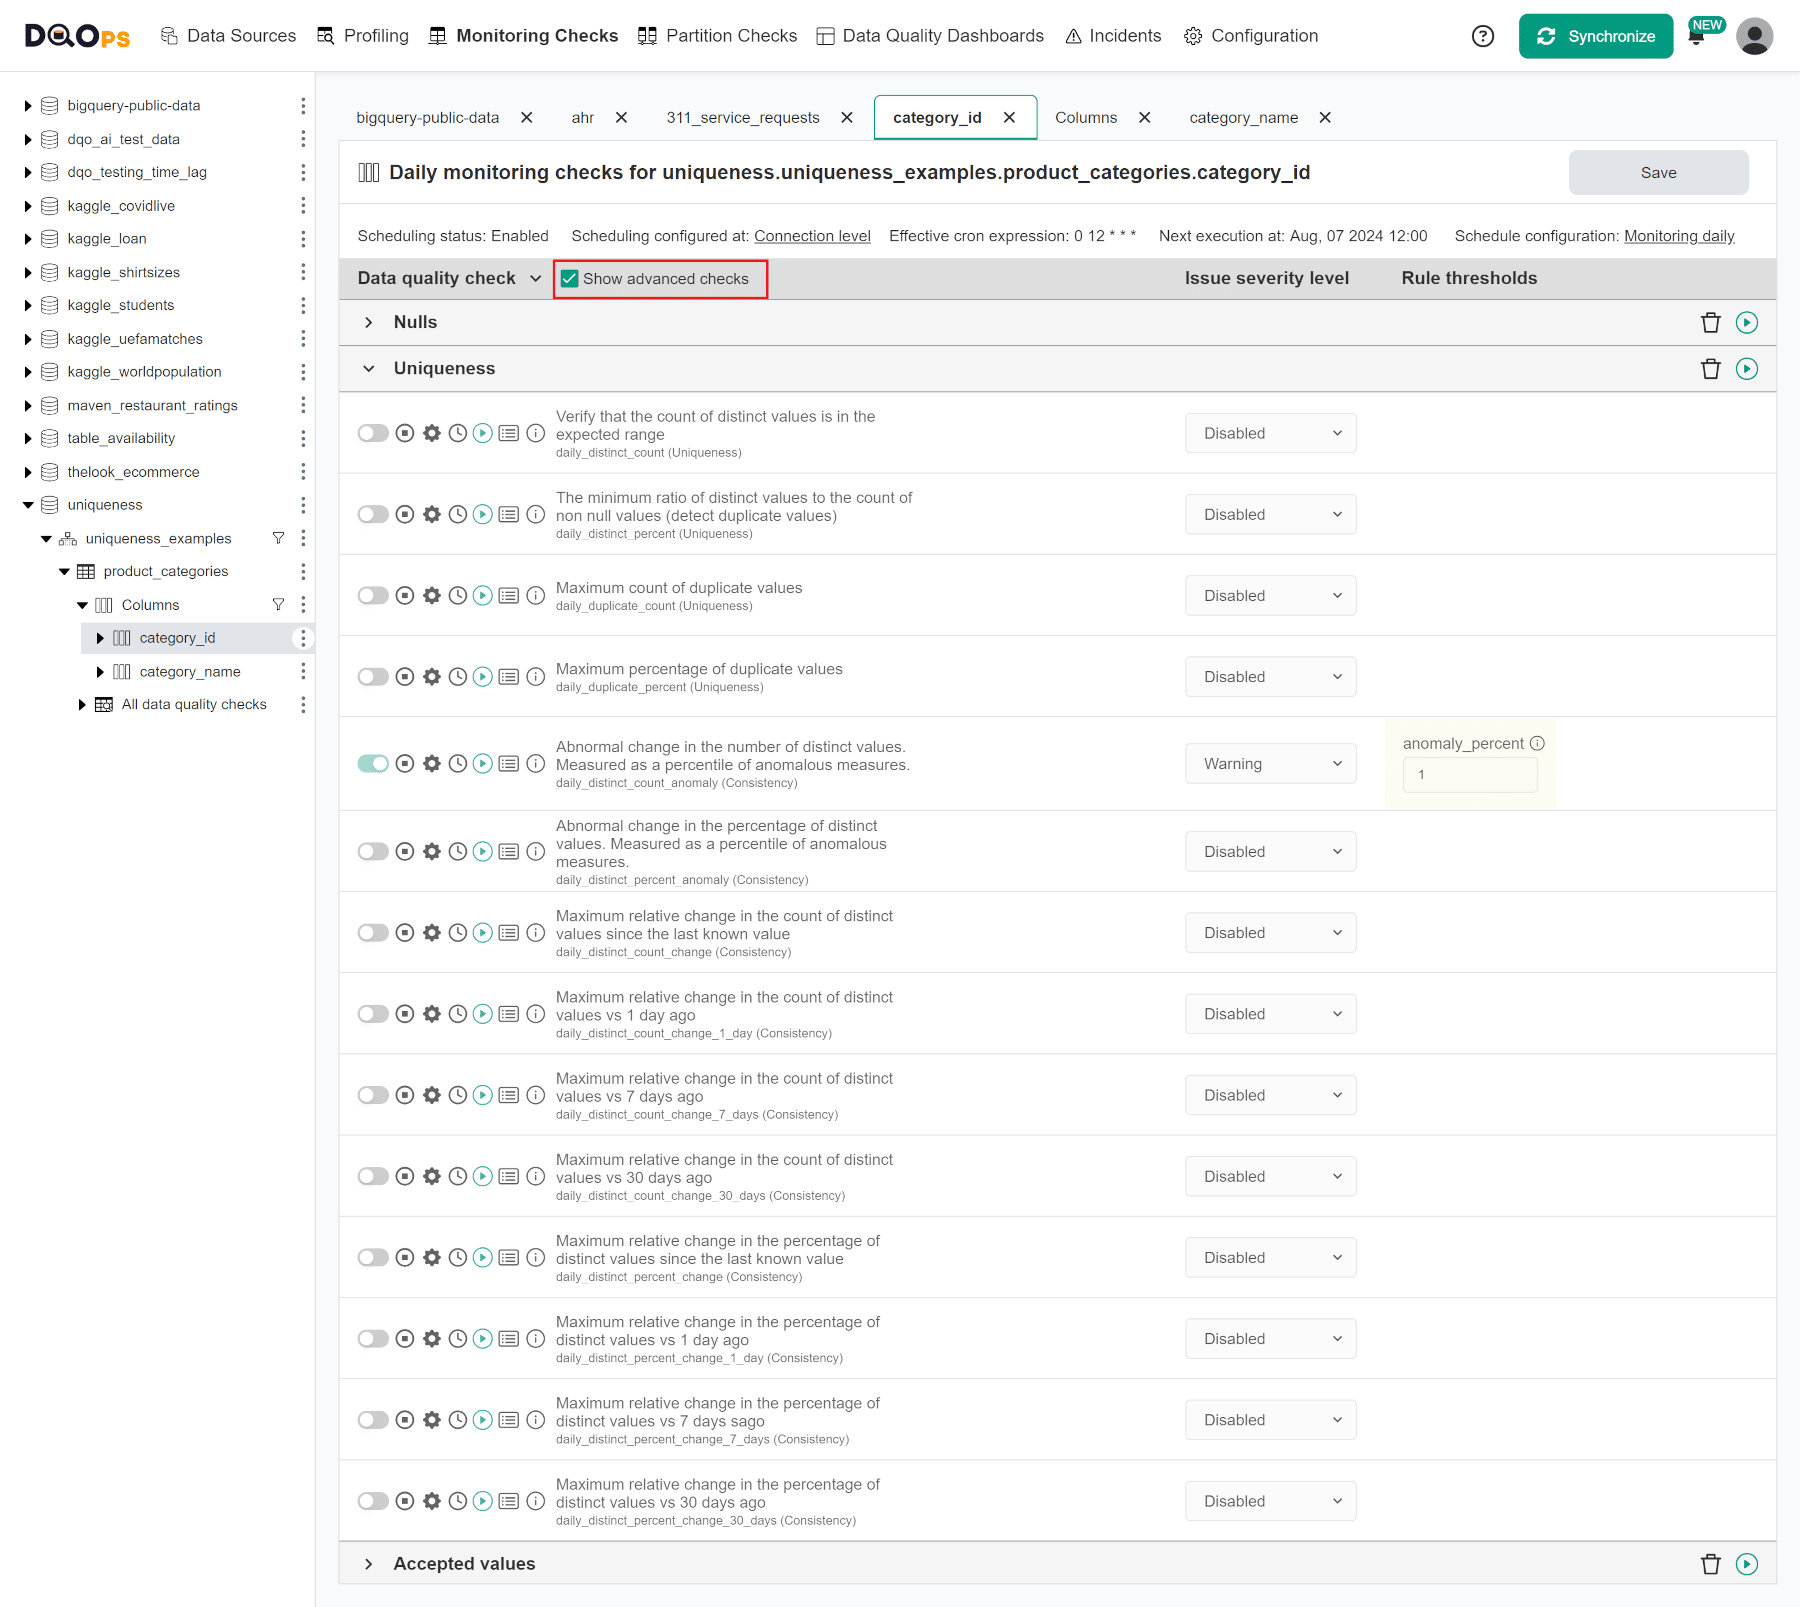
(click to expand)
Use cases
| Name of the example | Description |
|---|---|
| Percentage of duplicates | This example shows how to detect that the percentage of duplicate values in a column does not exceed the maximum accepted percentage using the duplicate_percent check. |
List of uniqueness checks at a column level
| Data quality check name | Friendly name | Data quality dimension | Description | Standard check |
|---|---|---|---|---|
| distinct_count | Verify that the count of distinct values is in the expected range | Uniqueness | This check counts distinct values and verifies if the distinct count is within an accepted range. It raises a data quality issue when the distinct count is below or above the accepted range. | |
| distinct_percent | The minimum ratio of distinct values to the count of non null values (detect duplicate values) | Uniqueness | This check measures the percentage of distinct values in all non-null values. It verifies that the percentage of distinct values meets a minimum and maximum values. The default value of 100% distinct values ensures the column has no duplicate values. | |
| duplicate_count | Maximum count of duplicate values | Uniqueness | This check counts duplicate values. It raises a data quality issue when the number of duplicates is above a minimum accepted value. The default configuration detects duplicate values by enforcing that the min_count of duplicates is zero. | |
| duplicate_percent | Maximum percentage of duplicate values | Uniqueness | This check measures the percentage of duplicate values in all non-null values. It raises a data quality issue when the percentage of duplicates is above an accepted threshold. The default threshold is 0% duplicate values. | |
| distinct_count_anomaly | Abnormal change in the number of distinct values. Measured as a percentile of anomalous measures. | Consistency | This check monitors the count of distinct values and detects anomalies in the changes of the distinct count. It monitors a 90-day time window. The check is configured by setting a desired percentage of anomalies to identify as data quality issues. | |
| distinct_percent_anomaly | Abnormal change in the percentage of distinct values. Measured as a percentile of anomalous measures. | Consistency | This check monitors the percentage of distinct values and detects anomalies in the changes in this percentage. It monitors a 90-day time window. The check is configured by setting a desired percentage of anomalies to identify as data quality issues. | |
| distinct_count_change | Maximum relative change in the count of distinct values since the last known value | Consistency | This check monitors the count of distinct values and compares it to the last known value. It raises a data quality issue when the change exceeds an accepted threshold. | |
| distinct_count_change_1_day | Maximum relative change in the count of distinct values vs 1 day ago | Consistency | This check monitors the count of distinct values and compares it to the measure from the previous day. It raises a data quality issue when the change exceeds an accepted threshold. | |
| distinct_count_change_7_days | Maximum relative change in the count of distinct values vs 7 days ago | Consistency | This check monitors the count of distinct values and compares it to the measure seven days ago to overcome the weekly seasonability impact. It raises a data quality issue when the change exceeds an accepted threshold. | |
| distinct_count_change_30_days | Maximum relative change in the count of distinct values vs 30 days ago | Consistency | This check monitors the count of distinct values and compares it to the measure thirty days ago to overcome the monthly seasonability impact. It raises a data quality issue when the change exceeds an accepted threshold. | |
| distinct_percent_change | Maximum relative change in the percentage of distinct values since the last known value | Consistency | This check monitors the percentage of distinct values and compares it to the last known value. It raises a data quality issue when the change exceeds an accepted threshold. | |
| distinct_percent_change_1_day | Maximum relative change in the percentage of distinct values vs 1 day ago | Consistency | This check monitors the percentage of distinct values and compares it to the measure from the previous day. It raises a data quality issue when the change exceeds an accepted threshold. | |
| distinct_percent_change_7_days | Maximum relative change in the percentage of distinct values vs 7 days sago | Consistency | This check monitors the percentage of distinct values and compares it to the measure seven days ago to overcome the weekly seasonability impact. It raises a data quality issue when the change exceeds an accepted threshold. | |
| distinct_percent_change_30_days | Maximum relative change in the percentage of distinct values vs 30 days ago | Consistency | This check monitors the percentage of distinct values and compares it to the measure thirty days ago to overcome the monthly seasonability impact. It raises a data quality issue when the change exceeds an accepted threshold. |
Reference and samples
The full list of all data quality checks in this category is located in the column/uniqueness reference. The reference section provides YAML code samples that are ready to copy-paste to the .dqotable.yaml files, the parameters reference, and samples of data source specific SQL queries generated by data quality sensors that are used by those checks.
List of uniqueness checks at a table level
| Data quality check name | Friendly name | Data quality dimension | Description | Standard check |
|---|---|---|---|---|
| duplicate_record_count | Maximum count of duplicate records | Uniqueness | This check counts duplicate records values. It raises a data quality issue when the number of duplicates is above a minimum accepted value. The default configuration detects duplicate rows by enforcing that the min_count of duplicates is zero. | |
| duplicate_record_percent | Maximum percentage of duplicate records | Uniqueness | This check measures the percentage of duplicate records values. It raises a data quality issue when the percentage of duplicates is above a minimum accepted value. The default threshold is 0% duplicate values. |
Reference and samples
The full list of all data quality checks in this category is located in the table/uniqueness reference. The reference section provides YAML code samples that are ready to copy-paste to the .dqotable.yaml files, the parameters reference, and samples of data source specific SQL queries generated by data quality sensors that are used by those checks.
What's next
- Learn how to run data quality checks filtering by a check category name
- Learn how to configure data quality checks and apply alerting rules
- Read the definition of data quality dimensions used by DQOps