Last updated: July 22, 2025
How to Measure Percentage of TRUE and FALSE Values? Examples
Read this guide to learn how to measure the percentage of true and false boolean values and how to set up data quality checks that assert the valid range.
The data quality checks for bool columns are configured in the bool category in DQOps.
Boolean statistics
Boolean columns are easy to analyze for data quality issues. They can have only three values: true, false, and null. DQOps has data quality checks for measuring the percentage of true and false values. The measure (the percentage) is verified with a range data quality check.
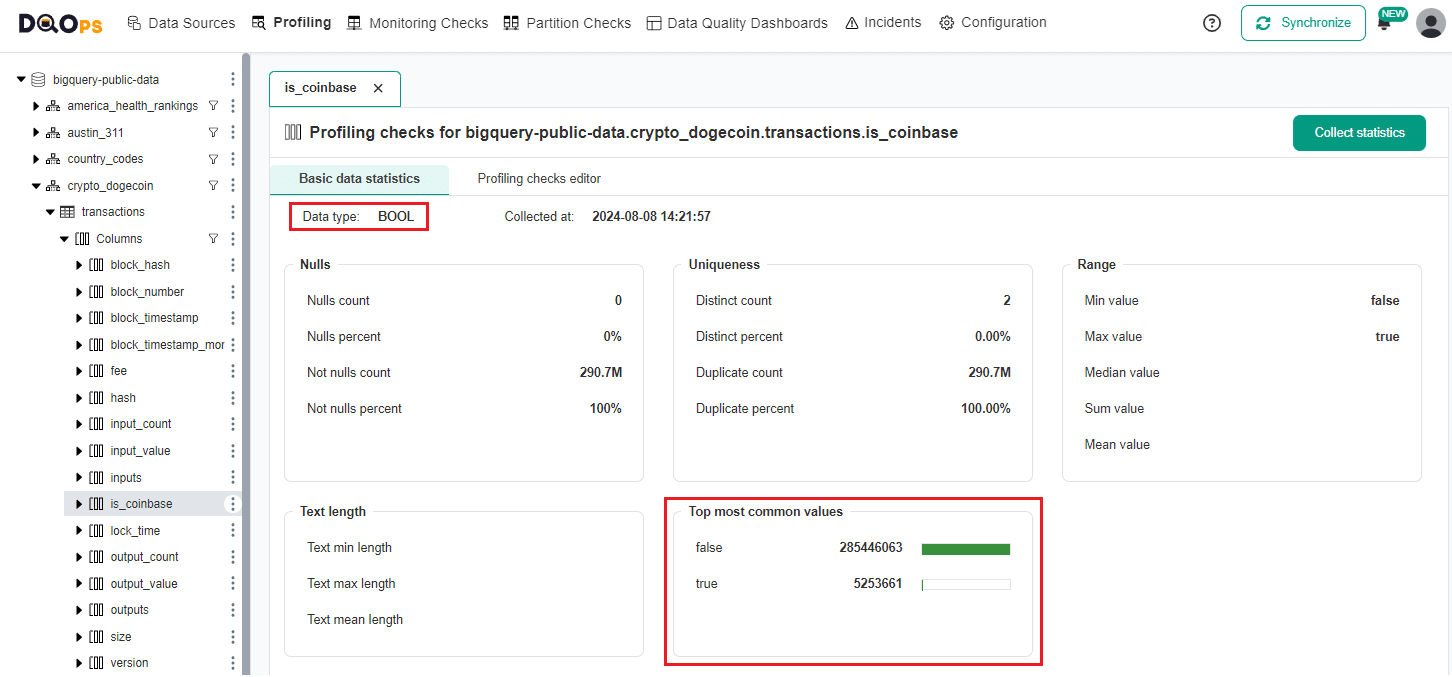
The profile of a sample bool column is shown below. The tested column has ~285M false values and ~5.2M true values. The percentage of true values is 1.8%.
Bool data quality checks
DQOps has two similar data quality checks for analyzing bool values.
-
true_percent validates the percentage of
truevalues -
false_percent validates the percentage of
falsevalues
Both bool checks accept two optional rule parameters, which set the valid percentage range of true or false values.
-
min_percentis the minimum accepted percentage, the value is between 0.0 and 100.0 (inclusive) -
max_percentis the maximum accepted percentage, the value is between 0.0 and 100.0 (inclusive)
Enable bool checks in UI
DQOps check editor shows the bool checks in the Bool category.

Bool checks error sampling in UI
To assist with identifying the root cause of errors and cleaning up the data, DQOps offers error sampling for this check. You can view representative examples of data that do not meet the specified data quality criteria by clicking on the Error sampling tab in the results section. For additional information about error sampling, please refer to the Data Quality Error Sampling documentation.
Enable bool checks in YAML
Bool checks are configured in the bool category node.
Analyze boolean values in other column types
DQOps can also analyze bool values in non-bool columns. Bool values in landing zone tables are often stored in text columns. The text values for true and false can take any form. DQOps supports calculated columns. A computed column is defined as an SQL expression that converts a raw value to an expected data type.
The following YAML file shows a calculated column tested with a bool data quality check.
Use case
| Name of the example | Description |
|---|---|
| Percentage of false boolean values | This example shows how to detect that the percentage of false values remains above a set threshold using false_percent check. |
List of bool checks at a column level
| Data quality check name | Friendly name | Data quality dimension | Description | Standard check |
|---|---|---|---|---|
| true_percent | Percentage of true values in bool column | Reasonableness | This check measures the percentage of true values in a boolean column. It raises a data quality issue when the measured percentage is outside the accepted range. | |
| false_percent | Percentage of false values in bool column | Reasonableness | This check measures the percentage of false values in a boolean column. It raises a data quality issue when the measured percentage is outside the accepted range. |
Reference and samples
The full list of all data quality checks in this category is located in the column/bool reference. The reference section provides YAML code samples that are ready to copy-paste to the .dqotable.yaml files, the parameters reference, and samples of data source specific SQL queries generated by data quality sensors that are used by those checks.
What's next
- Learn how to run data quality checks filtering by a check category name
- Learn how to configure data quality checks and apply alerting rules
- Read the definition of data quality dimensions used by DQOps