Last updated: October 22, 2024
Run data quality check
Read this guide to learn how to use the DQOps user interface and command line to run data quality checks.
Overview
In DQOps there are two ways to activate and run data quality checks:
- using the user interface
- using DQOps Shell
To activate checks, you need to add a connection. You can learn how to add connection here.
For more information about different types of checks, see DQOps concepts section.
Run data quality checks using the user interface
Navigate to the check editor
To navigate to the Check editor:
-
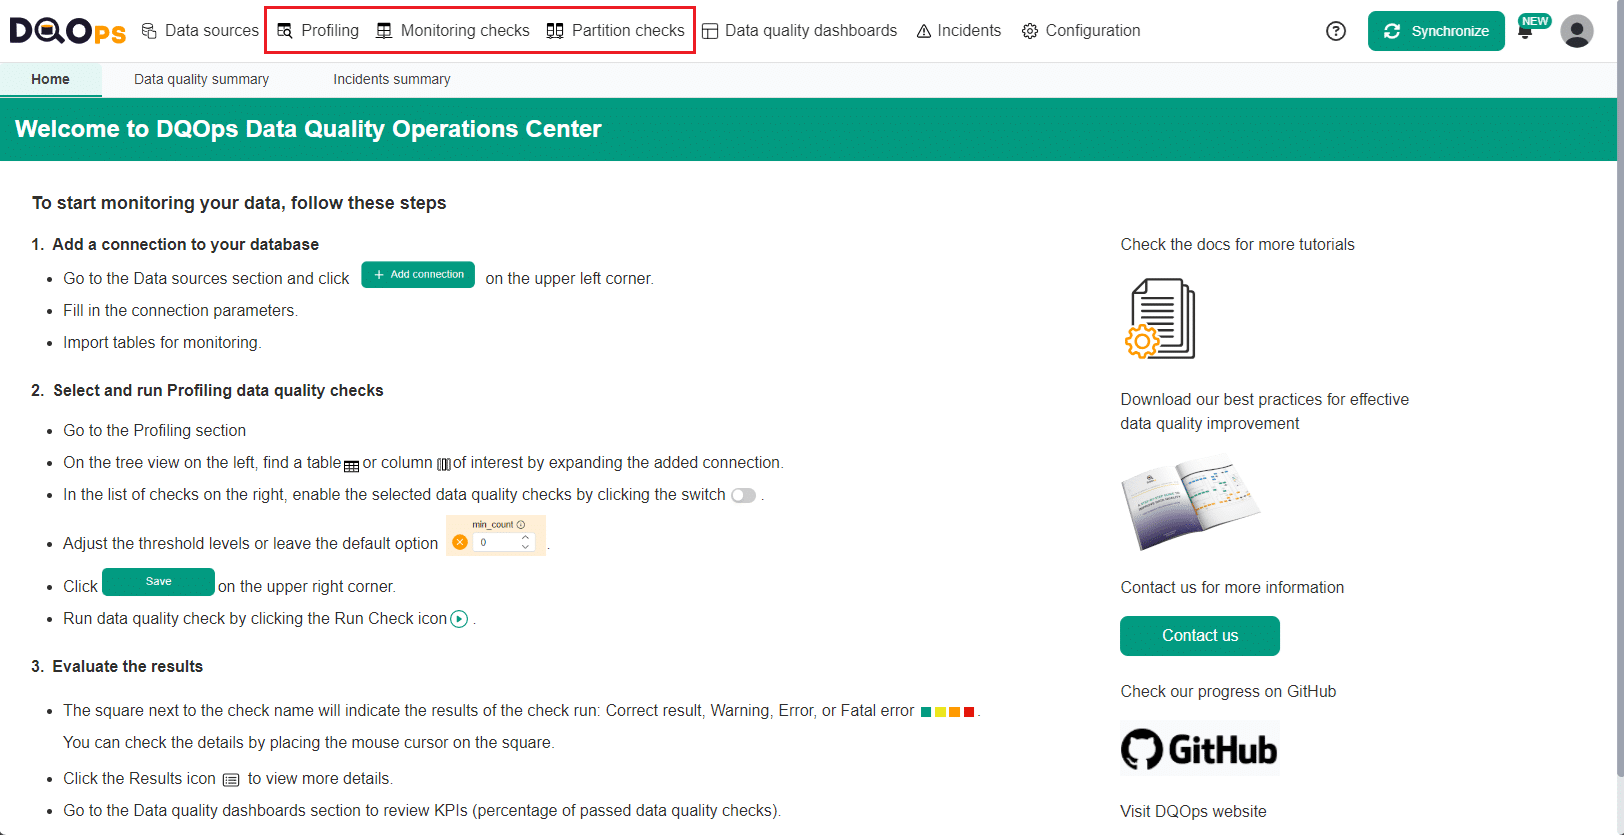
Click on the Profiling, Monitoring checks or Partition checks section at the top of the screen.
-
On the tree view on the left, select a table or column of interest by expanding the connection and select the Data quality check editor tab, (named Profiling checks editor in the Profiling section).
This will open a Check editor screen when you can work with checks. If you select a column directly, the check editor will open immediately without requiring additional steps.
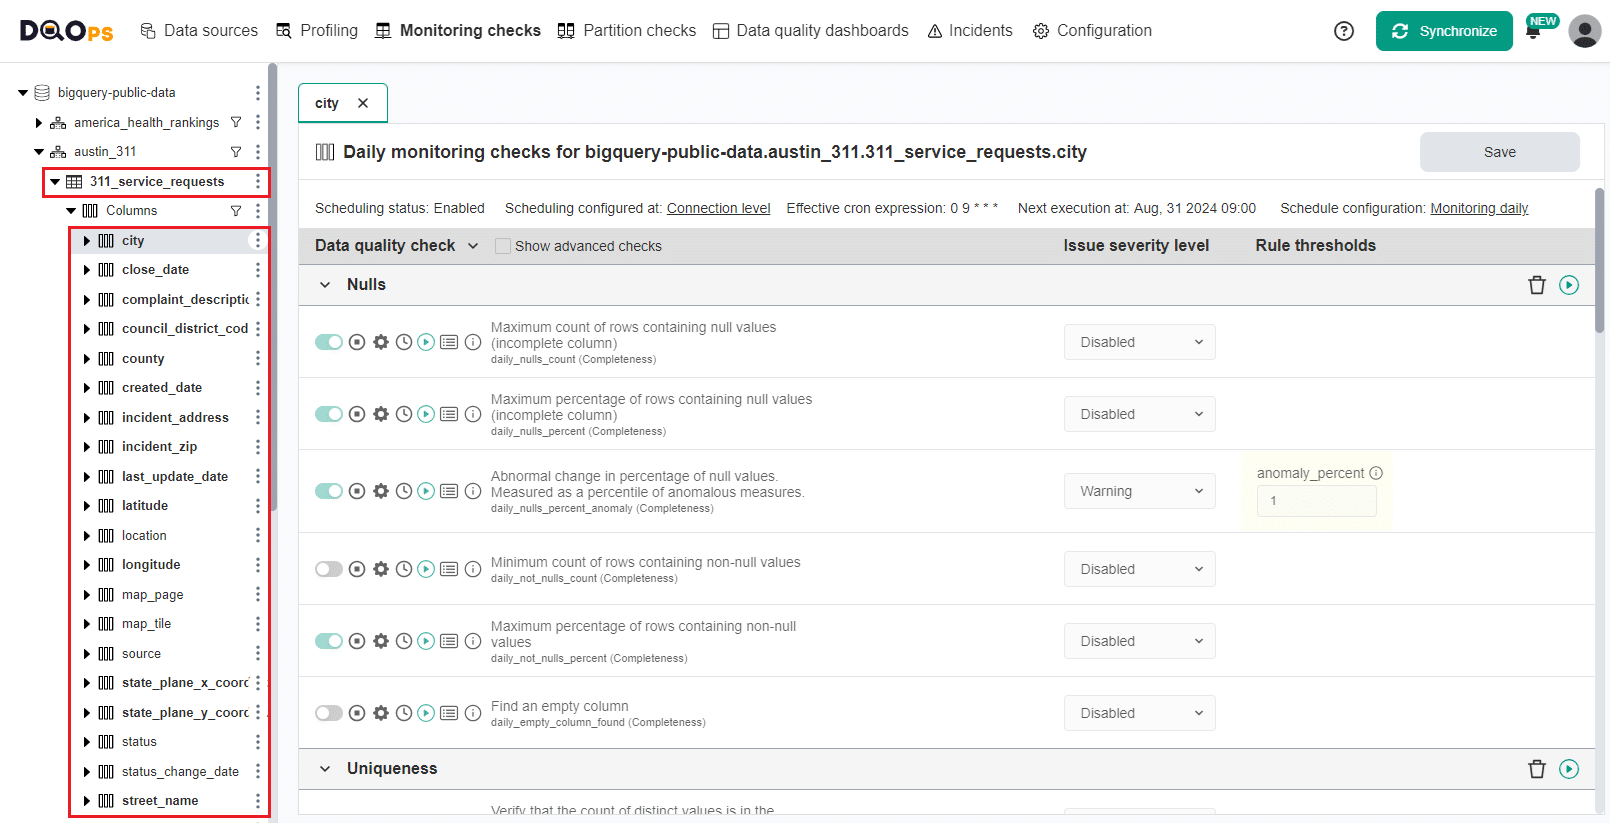
The table with data quality checks contains a list of checks divided into different data quality subcategories that you can expand and collapse by clicking on an arrow. Learn more about the different check categories.
By clicking on the Show advanced checks checkbox, located at the top of the table, you can view all checks available in DQOps.
The right side of the table allows selecting different threshold levels (issue severity levels). Learn more about threshold levels.
There are two types of checks editors Simplified and Advanced. The primary difference lies in the ability to define multiple severity levels in the Advanced mode. To access the Advanced mode, select the Multiple levels option from the Issue severity level dropdown menu in the simplified data check editor. Learn more about Simplified and Advanced check editor in the concept section.
The Check editor screen in the paid version of DQOps has additional subtabs that allow you to switch between Daily and Monthly checks.
Configure partitioning column to run partition checks
To run partition checks, you need to configure a date or datetime columns, which will be used as the time partitioning key for the table. Follow the link to learn how to configure partitioning column.
Run a check from a check editor
To run a check:
-
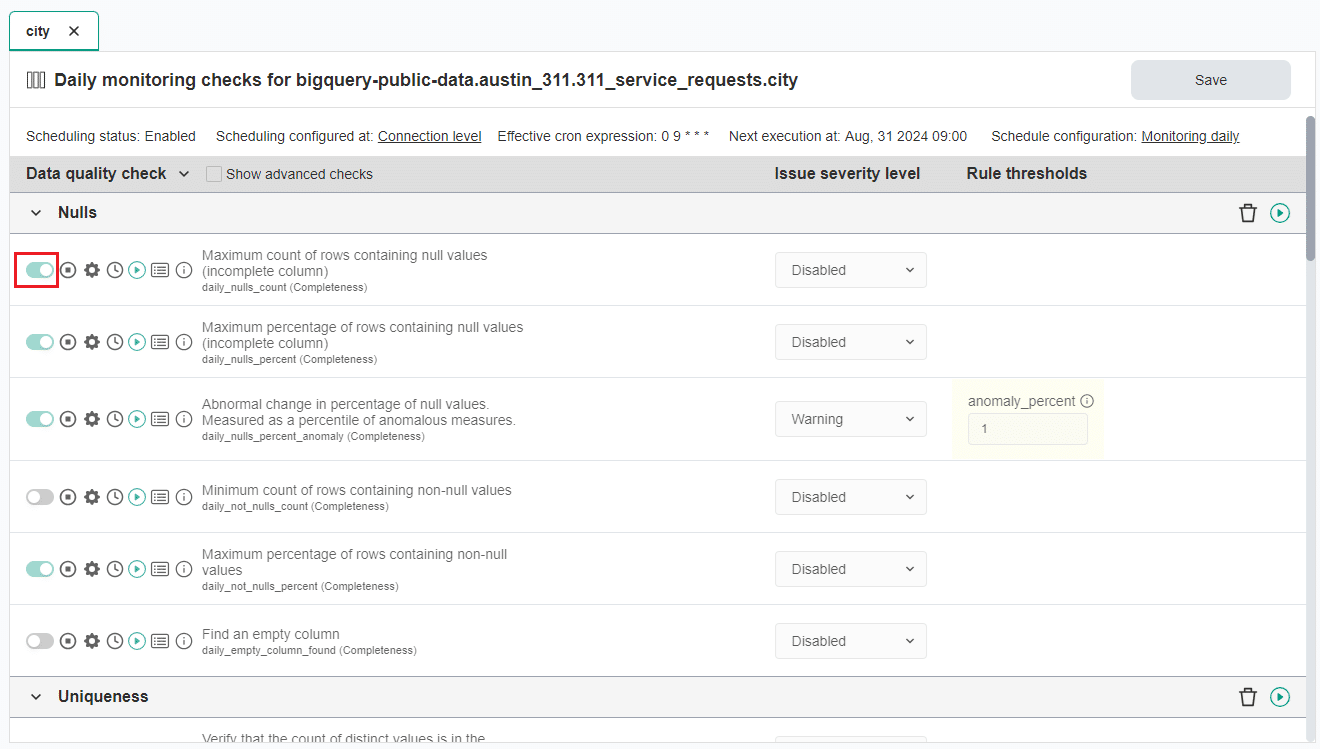
Activate the check of interest by clicking the toggle button next to the check name in the list on the right.
The gray color indicates that the check is not activated, light green indicates checks activated by data quality policies, and darker green indicates manually activated checks.
-
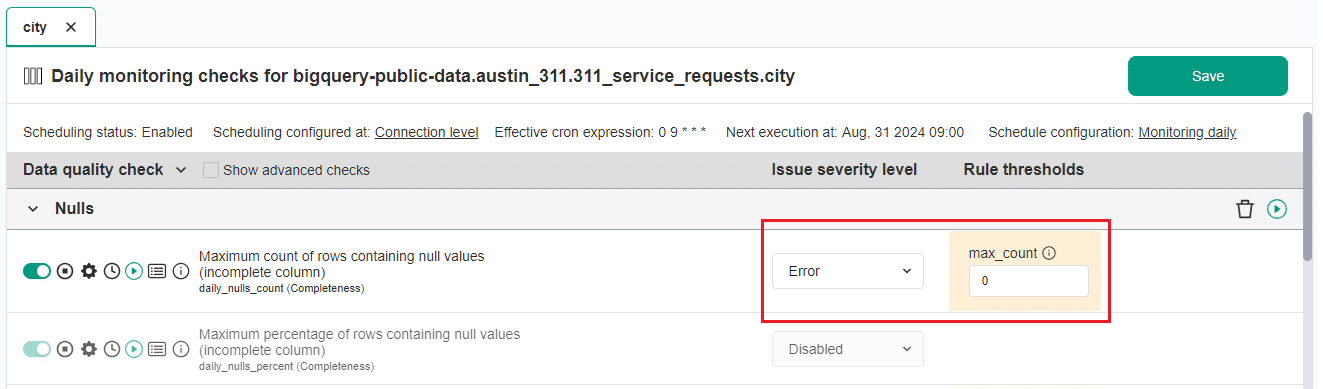
Choose the Issue severity level from the dropdown list and set the Rule thresholds or leave default values. Set parameters if the check has any. Click the Save button in the upper right corner.
You can read more about threshold severity levels in DQOps concepts section.
-
Run data quality check by clicking the Run check icon
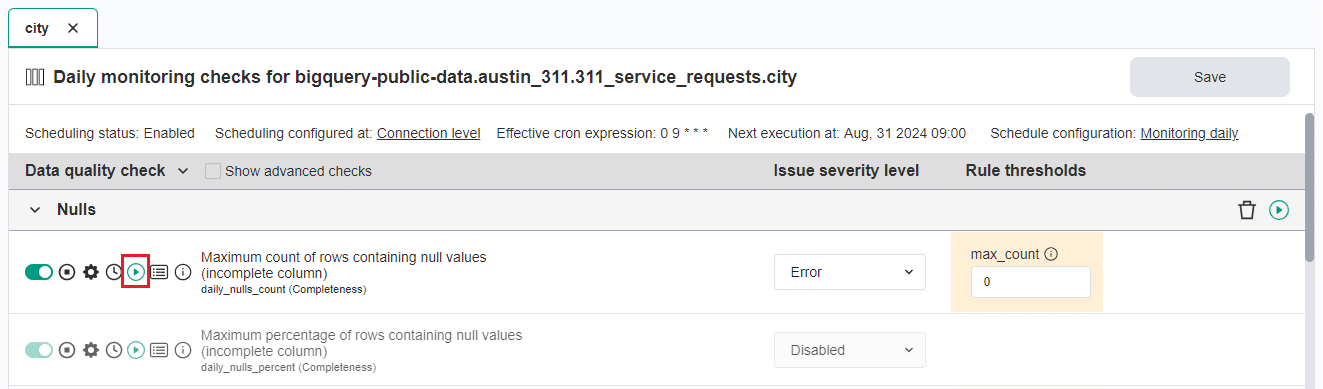
A square should appear next to the name of the checks indicating the results of the run check:
- Green for a correct result
- Yellow for a warning
- Orange for an error
- Red for a fatal error
- Black for execution error
Hover over the square to view a quick summary, or click the Results icon for a detailed results.
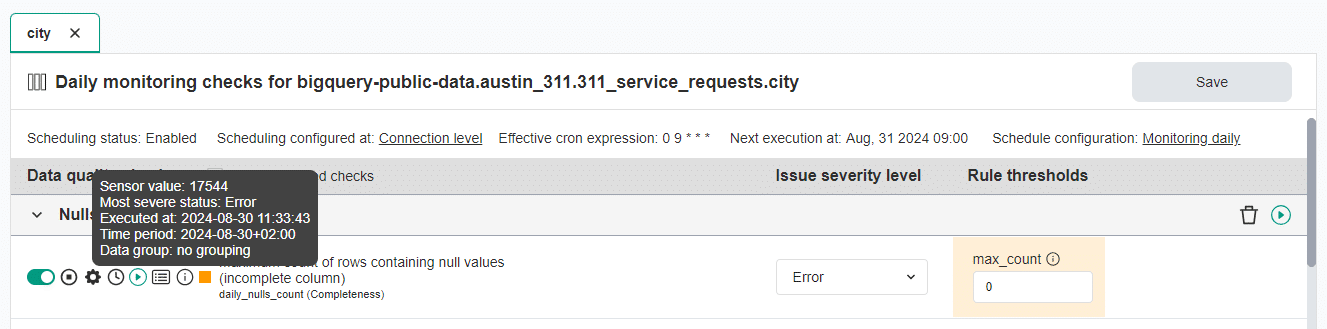
This check run resulted in an error. The column has 17 155 rows with null values, which was higher than the max_count error threshold 0.
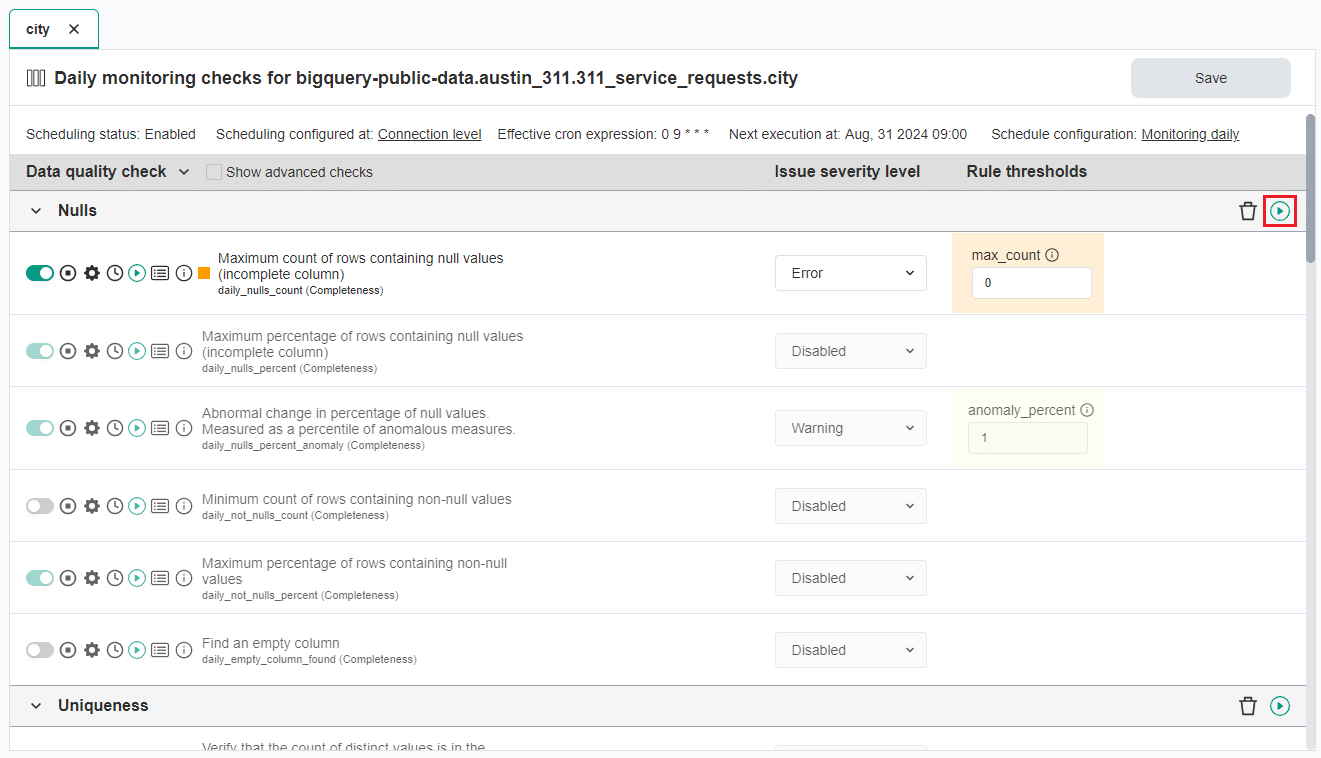
You can also run a check for the entire category by clicking on the Run button located to the left of the category name.
View detailed check results
To view detailed check results, sensor readouts, execution errors, or error samples click on the Results icon.
- The Check results tab shows the severity level resulting from the verification of sensor readouts based on set rule thresholds.
- The Sensor readouts tab displays the values obtained by the sensors from the data source.
- The Execution errors tab displays any errors that occurred during the check's execution.
- The Error sampling tab allows you to view representative examples of data that fail to meet specified data quality criteria.
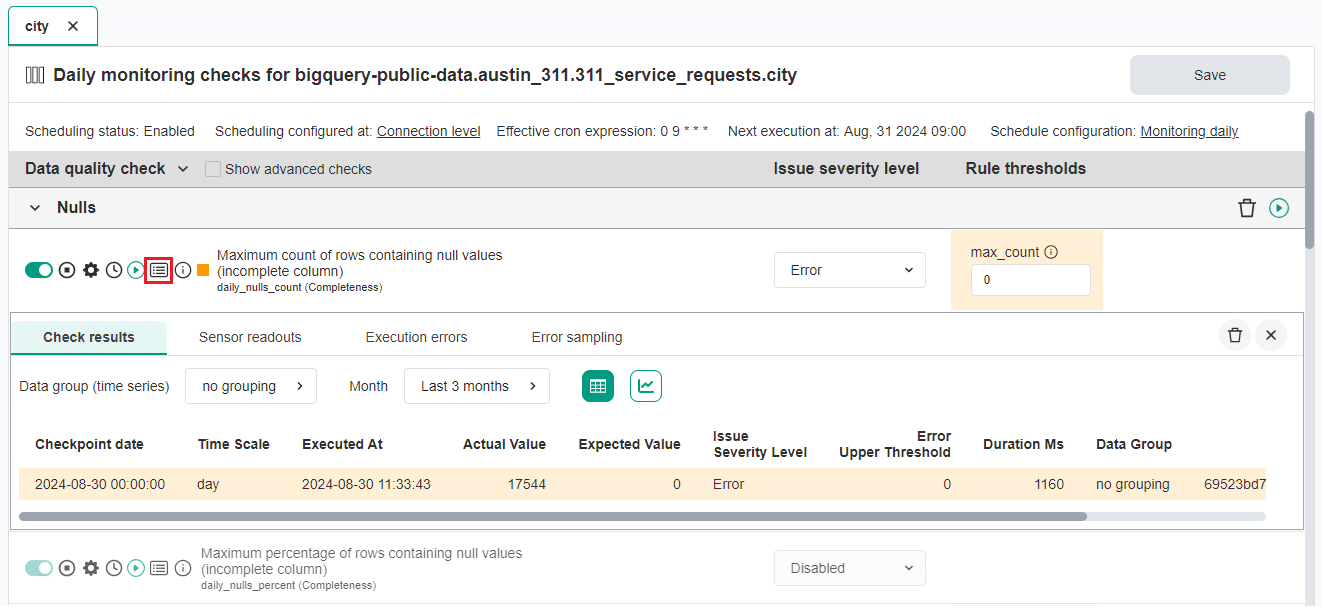
The Check results table displays detailed information about the run check. You can filter the table by data group and month using the dropdowns. Additionally, you can switch between the table and chart view by clicking on the icons on the right of the month filter dropdown. To close the detailed results view, click on the Results icon again or use the X button on the right.
Learn here how to delete data quality results.
Synchronize locally stored results with your DQOps Cloud account to be able to view the results on the dashboards.
To synchronize all the data click on the Synchronize button in the upper right corner of the navigation menu.
You can learn here how to Review the results of data quality monitoring on dashboards.
Run checks from a tree view
You can run checks for your entire connection, schema, table, or column from the tree view on the left-hand side of the screen. There are also additional parameters you can select.
To do so, click on the three-dot icon next to the table or column name in the tree view and select the Run check option. This will run all the activated checks for the selected connection, schema, table, or column.

A dialog box will appear where you can modify different options such as connection, schema and table name, column date, and column data type. There are also additional parameters when you can narrow the selection to the check type, check name, sensor name, table comparison name, labels, or tags.
After selecting options simply click the Run checks button to run checks.

If you want to run Partition checks, you can select from various incremental time window options here.
View detailed check results
When you select Partition checks type, you will have the additional option to select the time window.
Run data quality checks using the DQOps Shell
Data quality checks are stored in YAML configuration files. YAMl configuration files are located in the ./sources folder.
The complete DQOps YAML schema can be found here.
To add and run data quality checks using the DQOps Shell, follow the steps below.
-
Run the following command in DQOps Shell to edit YAMl configuration file and define data quality checks.
-
Provide the connection name and full table name in a schema.table format.
After entering the above data, Visual Studio Code will be automatically launched. -
Add the check to the YAML file using Visual Studio Code editor and save the file.
Below is an example of the YAML file showing a sample configuration of a profiling table check row_count. Some columns were truncated for clarity
apiVersion: dqo/v1 kind: table spec: timestamp_columns: partition_by_column: timestamp incremental_time_window: daily_partitioning_recent_days: 7 monthly_partitioning_recent_months: 1 columns: city: type_snapshot: column_type: STRING nullable: true monitoring_checks: daily: nulls: daily_nulls_count: error: max_count: 0 -
To execute the check, run the following command in DQOps Shell:
You can execute the check run for the whole connection, table or specific check type using additional parameters. For more details check the CLI section
You should see the table with the results similar to the one below.
Check evaluation summary per table:
+--------------------+-------------------------------+------+--------------+-------------+--------+------+------------+----------------+
|Connection          |Table                          |Checks|Sensor results|Valid results|Warnings|Errors|Fatal errors|Execution errors|
+--------------------+-------------------------------+------+--------------+-------------+--------+------+------------+----------------+
|bigquery-public-data|austin_311.311_service_requests|1     |1             |0            |0       |1     |0           |0               |
+--------------------+-------------------------------+------+--------------+-------------+--------+------+------------+----------------+
For a more detailed insight of how the check is run, you can initiate the check in debug mode by executing the following command:
In the debug mode you can view the SQL query (sensor) executed in the check.
**************************************************
Executing SQL on connection bigquery-public-data (bigquery)
SQL to be executed on the connection:
SELECT
SUM(
    CASE
        WHEN analyzed_table.`city` IS NULL THEN 1
        ELSE 0
    END
) AS actual_value
FROM `bigquery-public-data`.`austin_311`.`311_service_requests` AS analyzed_table
**************************************************
You can also see the results returned by the sensor.
What's next
- Now, you might want to learn how DQOps automatically configures the rule thresholds in data quality checks to find the most common data quality issues
- Learn how to delete data quality results.
- With DQOps you can activate, deactivate or modify multiple data quality checks at once. Follow the link to learn more.
- DQOps provide you with summary statistics about your table and column. This information can be valuable in deciding which data quality checks and threshold levels should be set to monitor data quality. For more details about Basic data statistics, click here.