Last updated: June 26, 2024
Managing errors
Read this guide to learn how to manage log errors and data quality check execution errors in DQOps and where they are stored.
Error logs
Location of the logging folder
Errors logs are stored locally in the .logs folder located in the DQOps User Home folder. The files in the .logs folder are rotated to save space. If an error occurs while running DQOps, please send the content of the folder to the DQOps support.
Follow the link, to learn more about DQOps user home folder.
Changing logging configuration
You can change the configuration of logging using the --dqo.logging.* and --logging.* parameters. These parameters should be passed to DQOps as the entry point parameters.
| Command argument | Description | Required | Accepted values |
|---|---|---|---|
--dqo.logging.console |
Enables logging to console, selecting the correct format. The default configuration 'OFF' disables console logging, allowing to use the DQOps shell without being distracted by log entries. Set the 'PATTERN' mode to send formatted entries to the console in a format similar to Apache logs. When running DQOps in as a docker container on a Kubernetes engine that is configured to capture DQOps container logs, use 'JSON' mode to publish structured Json log entries that can be parsed by fluentd or other similar log engines. JSON formatted messages use a Logstash compatible format. This parameter can also be configured by setting the DQO_LOGGING_CONSOLE environment variable. |
OFF JSON PATTERN |
|
--dqo.logging.console-immediate-flush |
When the console logging is enabled with --dqo.logging.console=PATTERN or --dqo.logging.console=JSON, turns on (for 'true') or turns of (for 'false') immediate console flushing after each log entry was written. Immediate console flushing is desirable when DQOps is started as a docker container and docker logs from DQOps should be forwarded to Kubernetes for centralized logging. This parameter can also be configured by setting the DQO_LOGGING_CONSOLE_IMMEDIATE_FLUSH environment variable. |
||
--dqo.logging.enable-user-home-logging |
Enables file logging inside the DQOps User Home's .logs folder. This parameter can also be configured by setting the DQO_LOGGING_ENABLE_USER_HOME_LOGGING environment variable. |
||
--dqo.logging.max-history |
Sets the maximum number of log files that can be stored (archived) in the .logs folder. This parameter can also be configured by setting the DQO_LOGGING_MAX_HISTORY environment variable. |
||
--dqo.logging.pattern |
Log entry pattern for logback used for writing log entries. This parameter can also be configured by setting the DQO_LOGGING_PATTERN environment variable. |
||
--dqo.logging.total-size-cap |
Total log file size cap of log files generated in the DQOps User Home's .logs folder. Supported suffixes are: kb, mb, gb. For example: 10mb, 2gb. This parameter can also be configured by setting the DQO_LOGGING_TOTAL_SIZE_CAP environment variable. |
||
--dqo.logging.user-errors.checks-log-level |
The logging level at which any errors captured during the data quality check evaluation are reported. When a data quality check is executed and the error is related to a sensor (query) or a rule (python) function, they are reported as sensor or rules issues.Only data quality check configuration issues that prevent running a data quality check are reported as check issues. The logging level for the whole application must be equal or higher to this level for effective logging. Check logs are logged under the com.dqops.user-errors.checks log. This parameter can also be configured by setting the DQO_LOGGING_USER_ERRORS_CHECKS_LOG_LEVEL environment variable. |
ERROR WARN INFO DEBUG TRACE |
|
--dqo.logging.user-errors.rules-log-level |
The logging level at which any errors captured during the data quality rule (python function) evaluation are reported. The logging level for the whole application must be equal or higher to this level for effective logging. Rule logs are logged under the com.dqops.user-errors.rules log. This parameter can also be configured by setting the DQO_LOGGING_USER_ERRORS_RULES_LOG_LEVEL environment variable. |
ERROR WARN INFO DEBUG TRACE |
|
--dqo.logging.user-errors.sensors-log-level |
The logging level at which any errors captured during the data quality sensor (query) execution are reported. The logging level for the whole application must be equal or higher to this level for effective logging. Sensor logs are logged under the com.dqops.user-errors.sensors log. This parameter can also be configured by setting the DQO_LOGGING_USER_ERRORS_SENSORS_LOG_LEVEL environment variable. |
ERROR WARN INFO DEBUG TRACE |
|
--dqo.logging.user-errors.statistics-log-level |
The logging level at which any errors captured during the statistics collection are reported. The logging level for the whole application must be equal or higher to this level for effective logging. Statistics logs are logged under the com.dqops.user-errors.statistics log. This parameter can also be configured by setting the DQO_LOGGING_USER_ERRORS_STATISTICS_LOG_LEVEL environment variable. |
ERROR WARN INFO DEBUG TRACE |
|
--dqo.logging.user-errors.yaml-log-level |
The logging level at which any errors captured during YAML file parsing are reported. The logging level for the whole application must be equal or higher to this level for effective logging. Statistics logs are logged under the com.dqops.user-errors.yaml log. This parameter can also be configured by setting the DQO_LOGGING_USER_ERRORS_YAML_LOG_LEVEL environment variable. |
ERROR WARN INFO DEBUG TRACE |
|
--logging.level.com.dqops |
Default logging level for the DQOps runtime. This parameter can also be configured by setting the LOGGING_LEVEL_COM_DQOPS environment variable. |
ERROR WARN INFO DEBUG TRACE |
|
--logging.level.root |
Default logging level at the root level of the logging hierarchy. This parameter can also be configured by setting the LOGGING_LEVEL_ROOT environment variable. |
ERROR WARN INFO DEBUG TRACE |
Data quality execution errors
The data quality execution errors can be divided into sensor and rule errors.
- The sensor execution errors are error messages received from the data source when the tested table does not exist or the sensor's SQL query is invalid.
- The rule execution errors are exceptions raised during the Python rule evaluation.
Location of the execution errors
The data quality execution errors are stored in the uncompressed parquet files located in the $DQO_USER_HOME/.data/errors folder.
For a full reference of execution errors parquet files schema, please follow the link.
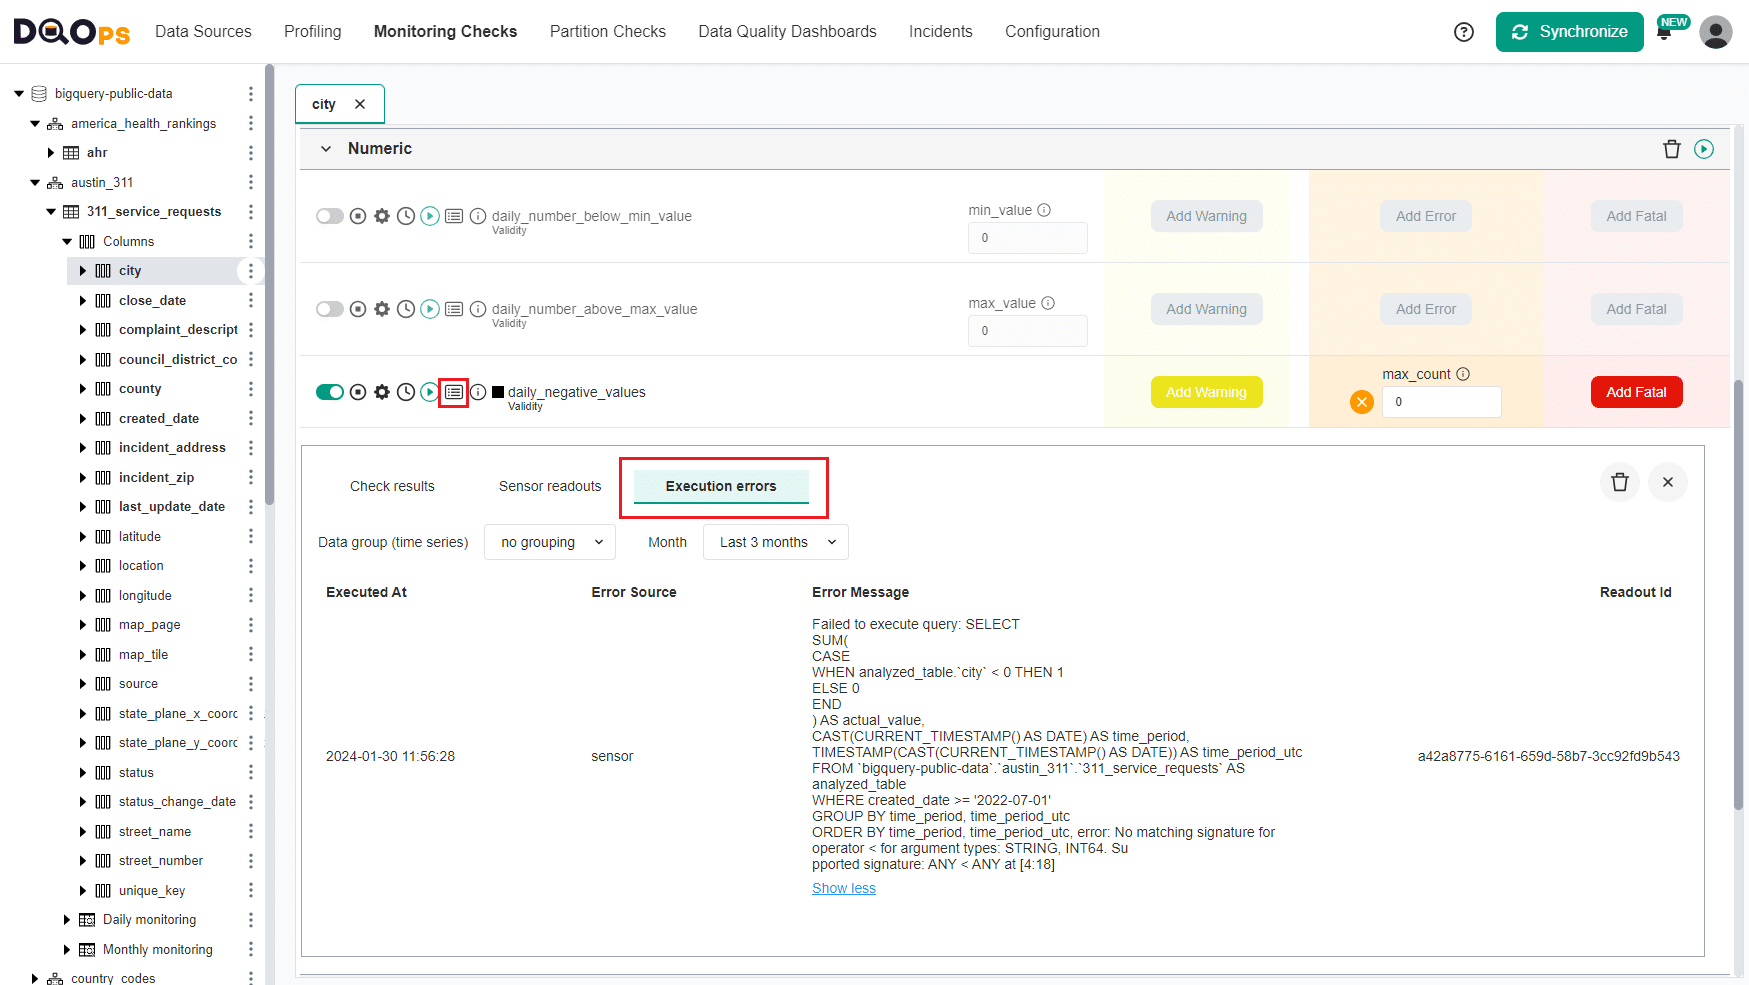
Review details of the execution error in the UI
If an execution error occurs while running data quality checks in the check editor, you will see a black square next to the check name.

To review the error details, click on the Results icon and select the Execution errors tab. The list of errors will display the date, source (sensor or rule), unique readout ID, and a detailed error message. You can filter the list by data group and month.
For example, when we execute a numeric check on the string column we get a sensor error as the one shown below.
Delete the execution error
To delete check execution errors, go to the Error details screen and click on the delete icon in the upper right corner.

Then on the dialog box, you can select only the Execution errors using the checkbox and specify the time range.

For more information about deleting results, please follow the link.
Reviewing check execution errors on dashboards
You can review the summary list and details of all the execution errors on the dashboards.
To view the execution errors dashboards, simply go to the Data Quality Dashboard section. On the tree view on the left open the DQOPs usage, and then the Execution errors folder.

DQOps has two built-in dashboards for reviewing Execution errors: History of execution errors and Details of execution errors described below.
The Details of execution errors dashboard displays a summary of errors per connection, schema, table, column, dimension, check type, check category, or check name. It also displays the daily distribution of errors, time when the error occurred, and detailed error messages. It also displays the daily distribution of errors and full error details including the error message.

The History of execution errors dashboard displays the summary of errors per connection, schema, table, column, dimension, check type, check category, or check name for the current or previous month. It also shows the distribution of errors per day of the month.

You can modify the built-in dashboards. Follow the link for more information about creating custom data quality dashboards.
Running checks from the DQOps Shell in the debug mode
When running checks from the DQOPs Shell and an error occurs, you can examine its details by executing the check in the debug mode.
Simply add the --mode=debug parameter to the check run command
check run --mode=debug
Follow the link, for more information about working with DQOps Shell.
Reporting errors directly to the console when starting dqops/dqo docker image
If you want to report errors directly to the console when starting dqops/dqo docker image use, the following parameters for docker run:
-e DQO_LOGGING_CONSOLE=JSON \
-e DQO_LOGGING_CONSOLE_IMMEDIATE_FLUSH=true \
-e DQO_LOGGING_LOG_ERRORS_TO_STDERR=false \
-e LOGGING_LEVEL_COM_DQOPS=error \
A full description of starting DQOps as a Docker container can be found here
What's next
- Check the detailed manual of how to run data quality checks using the check editor.
- Learn how to review the data quality results on dashboards to identify all tables and columns affected by issues.