Last updated: November 13, 2024
Incidents and notifications overview
Read this guide to learn how the data quality incident workflow works in DQOps, and how to use all incident management screens to manage data quality incidents.
Overview
With the help of DQOps, you can conveniently keep track of the issues that arise during data quality monitoring. The Incidents section aggregates these issues into incident and allows you to view and filter them, as well as manage their status.
Issues can be grouped into incidents based on the following categories:
- Table
- Table and quality dimension
- Table, quality dimension and check category
- Table, quality dimension, check category and check type
- Table, quality dimension, check category and check name
You can also adjust the grouping level for data quality incidents at the table level in the Incident configuration tab. By default, table grouping will use the same configuration which is set at the connection. level.
Incident workflow
The data quality incident management workflow is shown on the following diagram.

The following statuses are used for data quality incidents.
- Open for a new incident that was just detected because a new data quality issue (failed data quality check) was identified and it did not match any other open, acknowledged or muted incident. These issues should be managed by the 2nd level support team or the data quality team. The issues must be first reviewed and assessed.
- Acknowledged is the next status that is assigned by the 2nd level support when the data quality issue is confirmed and is assigned to the 3rd level support team to be resolved.
- Resolved is the status assigned by the 3rd level support team when the issue is solved. The data quality team may subscribe to notifications when the acknowledged issues are assigned
- Muted is the status assigned to false-positive issues, issues that have low impact, or issues that cannot be solved, and it was conditionally accepted. DQOps will keep detecting data quality issues matching this incident. New incidents will be assigned to the muted incident for the next 60 days. The incident mute time window is configurable on a table level.
Configure incidents
Incidents are the default function of DQOps and automatically groups issues.
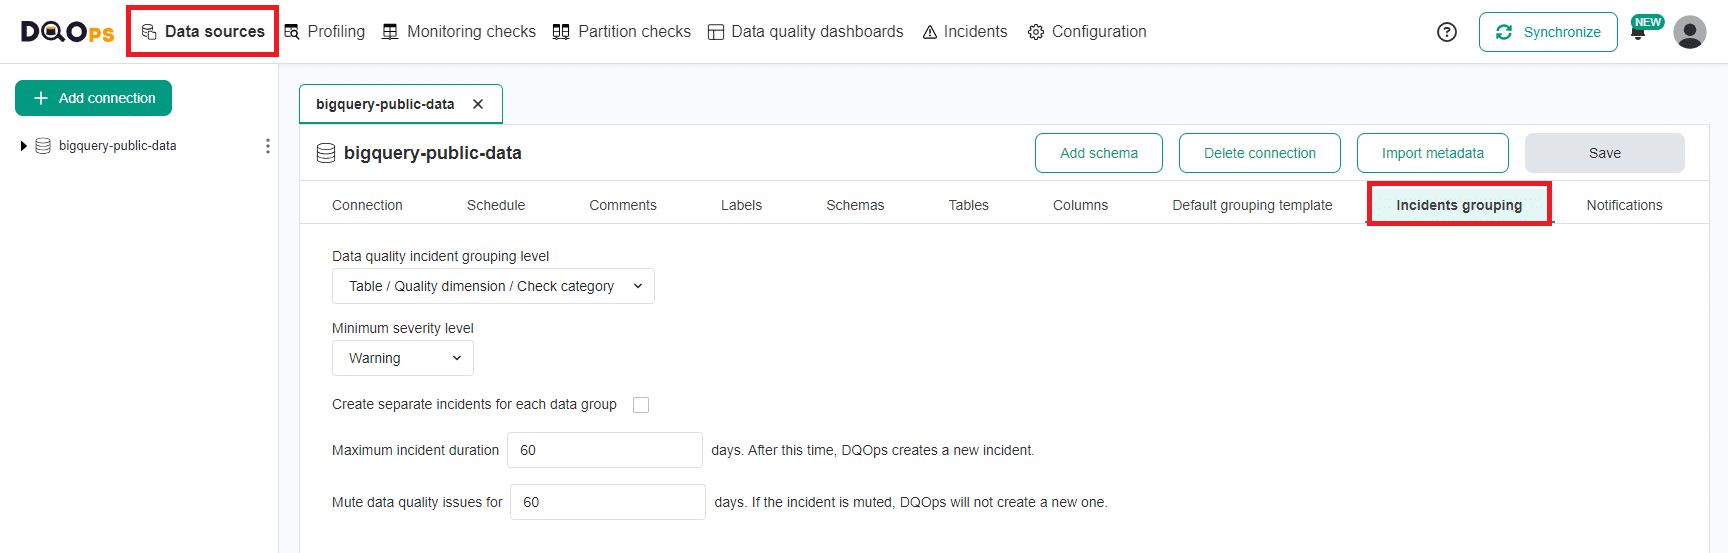
To modify the settings of the Incidents, follow these steps:
-
Go to the Data Sources section.
-
Select the relevant data source from the tree view on the left.
-
Select the Incident grouping tab.
-
Update the settings and click the Save button
On the Incidents and Notifications tab, you can customize:
- The level of grouping for data quality incidents.
- The minimum severity level required for generating an incident.
- Whether incidents should be created for the entire data source or for each group of rows separately, using data grouping.
- The maximum duration of an incident in days. After this time, DQOps creates a new incident.
- The time duration for muted incidents. If the incident is muted, DQOps will not create a new one.
View incidents summary
DQOps allows you for a quick overview of all incidents within your environment. To access the Incidents summary, click on the DQOps logo in the top left corner and select the Incidents summary tab.
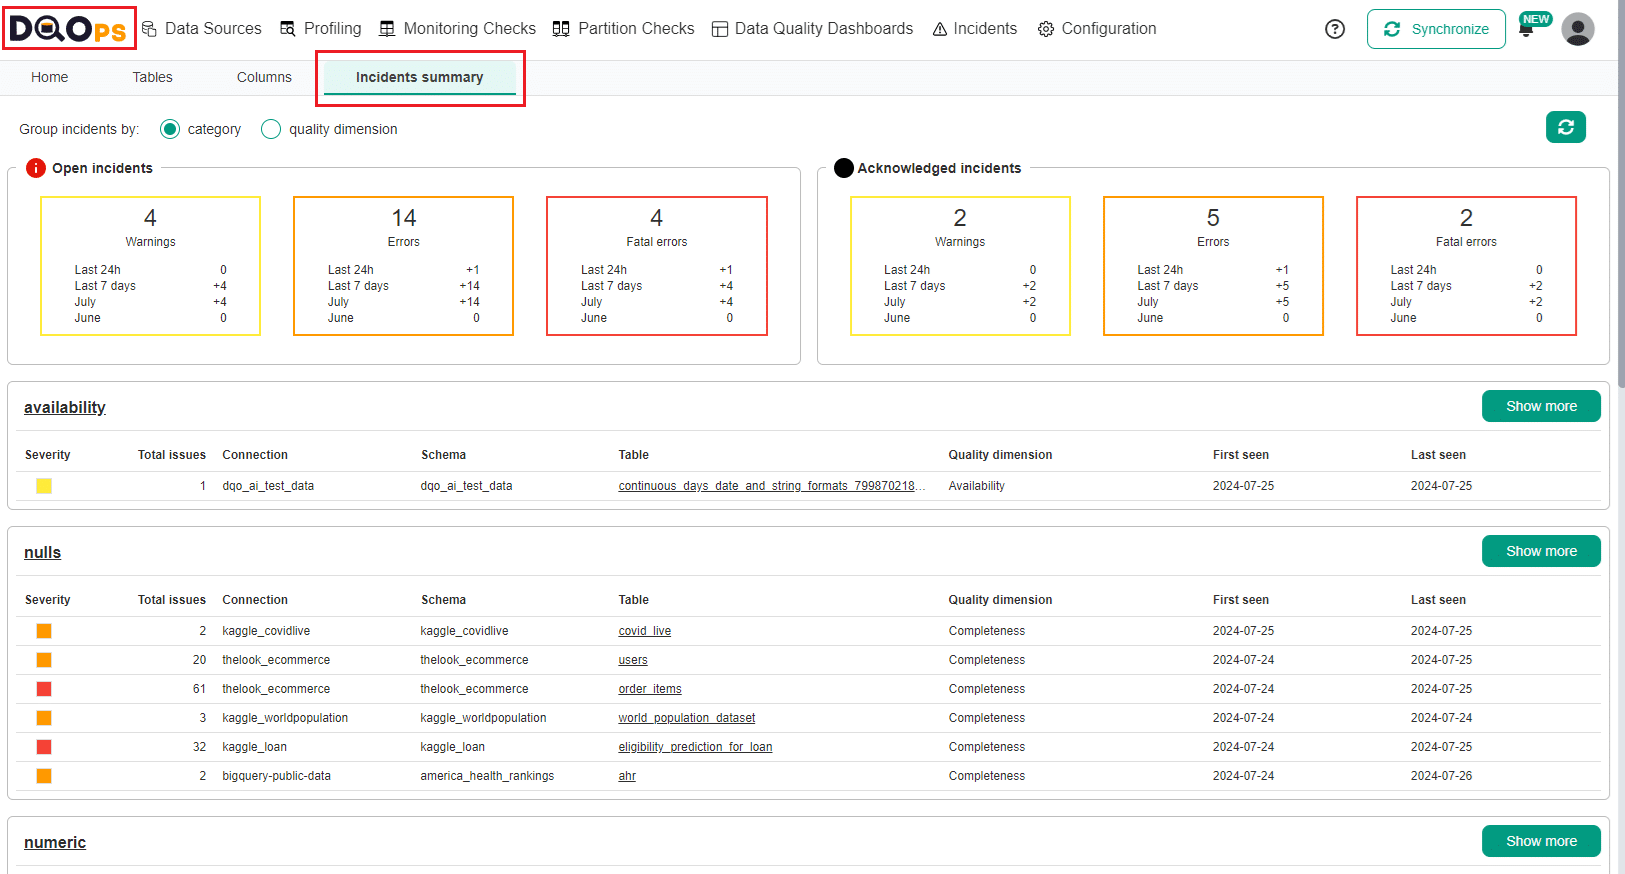
The Incidents summary screen provides an overview of data quality incidents categorized by either check category or data quality dimension. You can easily switch between these groupings using the provided radio buttons. The Refresh button located at the top right of the screen, allows you to refresh the displayed incident data.
At the top of The Incidents summary screen, there are two sections displaying the summaries of Open and Acknowledged incidents. Each section is divided into three blocks based on severity level: Warnings, Errors and Fatal errors. In each block, there is a summary of new incidents from the last 2 months along with detailed data showing the number of incidents detected in the last 24h, last 7 days, current month and previous month.
Below the Open and Acknowledged incidents summaries, there is a table that list incidents grouped by the selected check category or the quality dimension, depending on your grouping selection. The table includes the following columns:
- Severity - Indicates the severity of the incident with colored squares (yellow for warning, orange for error and red for fatal error)
- Total issues - Displays the total number of times the data quality issue has occurred in the incident.
- Connection - The name of the connection where the incident was detected.
- Schema - The schema name within the connection where the incident occurred.
- Table - The name of the table where the incident was detected.
- Quality dimension or Check category (depending on chosen grouping) - This column will display either the data quality dimension associated with the incident (e.g., Completeness, Validity, Consistency) or the check category that triggered the incident (e.g., anomaly, datetime, nulls, uniqueness).
- First seen - Shows the date the incident was first detected.
- Last seen - Displays the date the incident was last detected.
Each table has a Show more button. Clicking this button will navigate you to the dedicated Incidents screen for a more detailed view.
View and manage Incidents
To view and manage incidents that occur during data quality monitoring, navigate to the Incidents section.
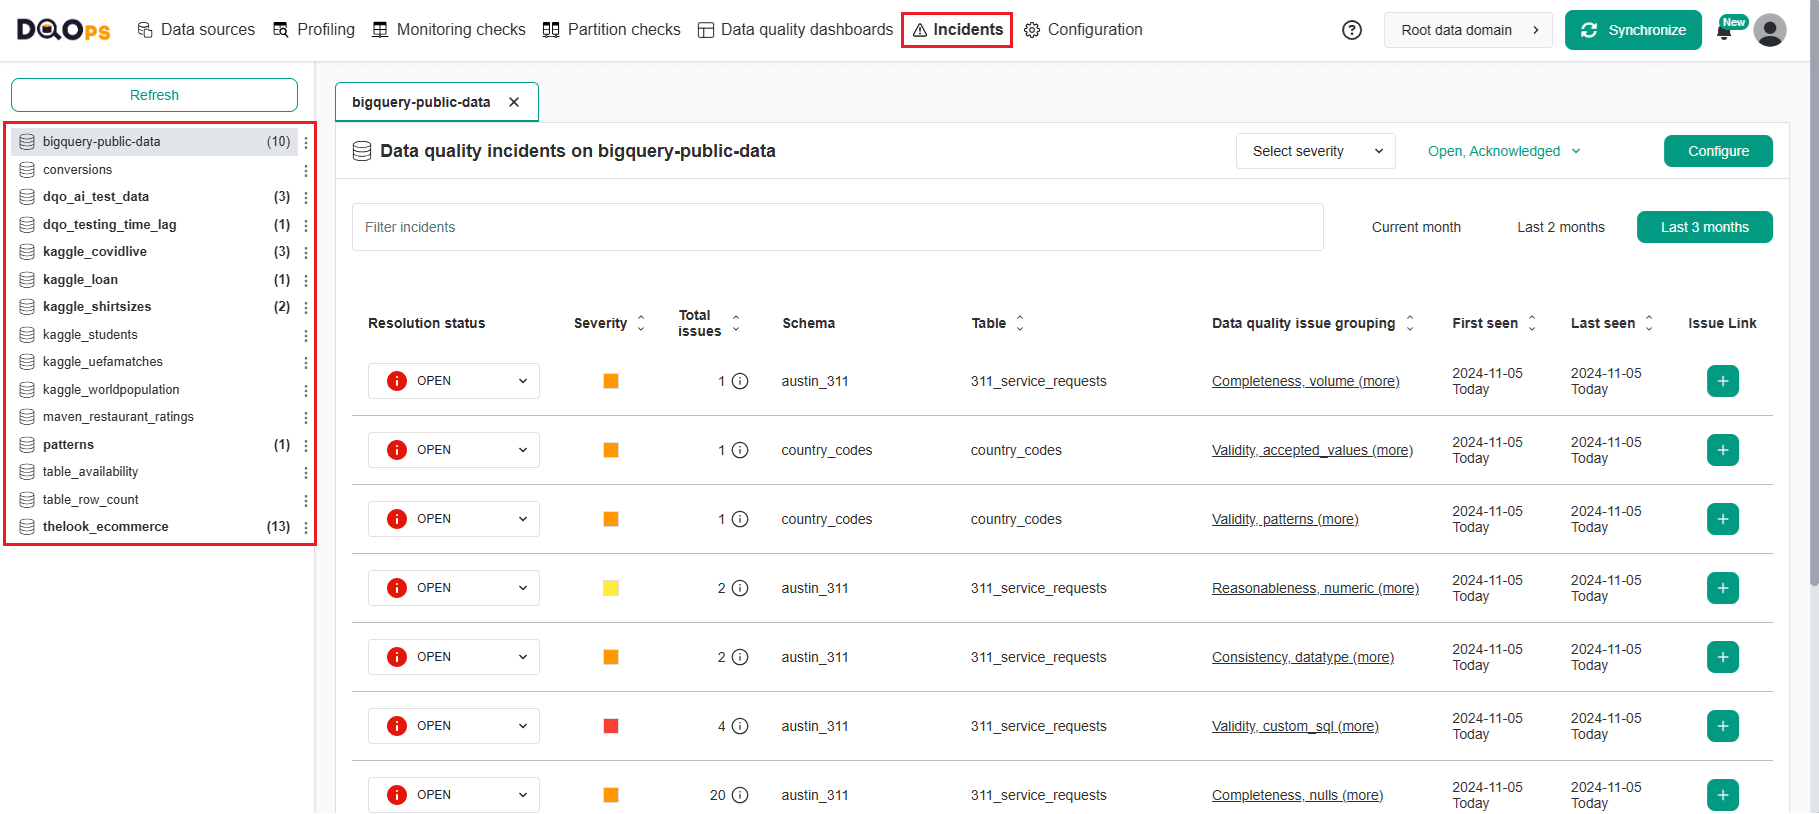
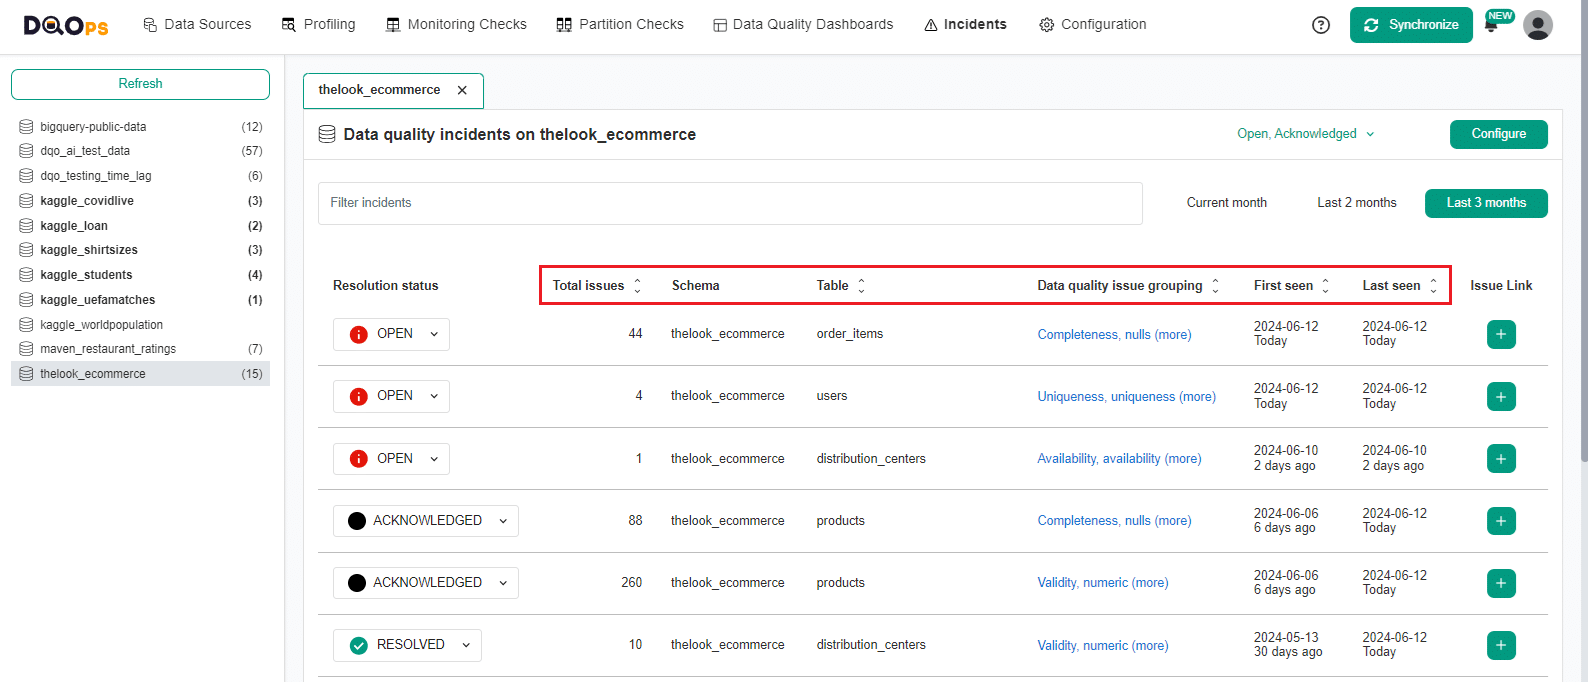
On the left side of this screen, there is a list displaying the connections and the number of incidents that have occurred for each one. On the right panel, you can view incidents for the connections you have selected, and you can filter, sort, and view detailed information about the incidents.
For each incident the following information is provided:
- Resolution status: A status assigned to the incident (Open, Acknowledged, Resolved or Muted)
- Severity: A colored square indicating the severity level, yellow for warning, orange for error and red for fata error.
- Total issues: The number of times the data quality issue has occurred in the selected time range
- Schema: Name of the schema in which data quality issues were detected
- Table: Name of the table in which data quality issues were detected
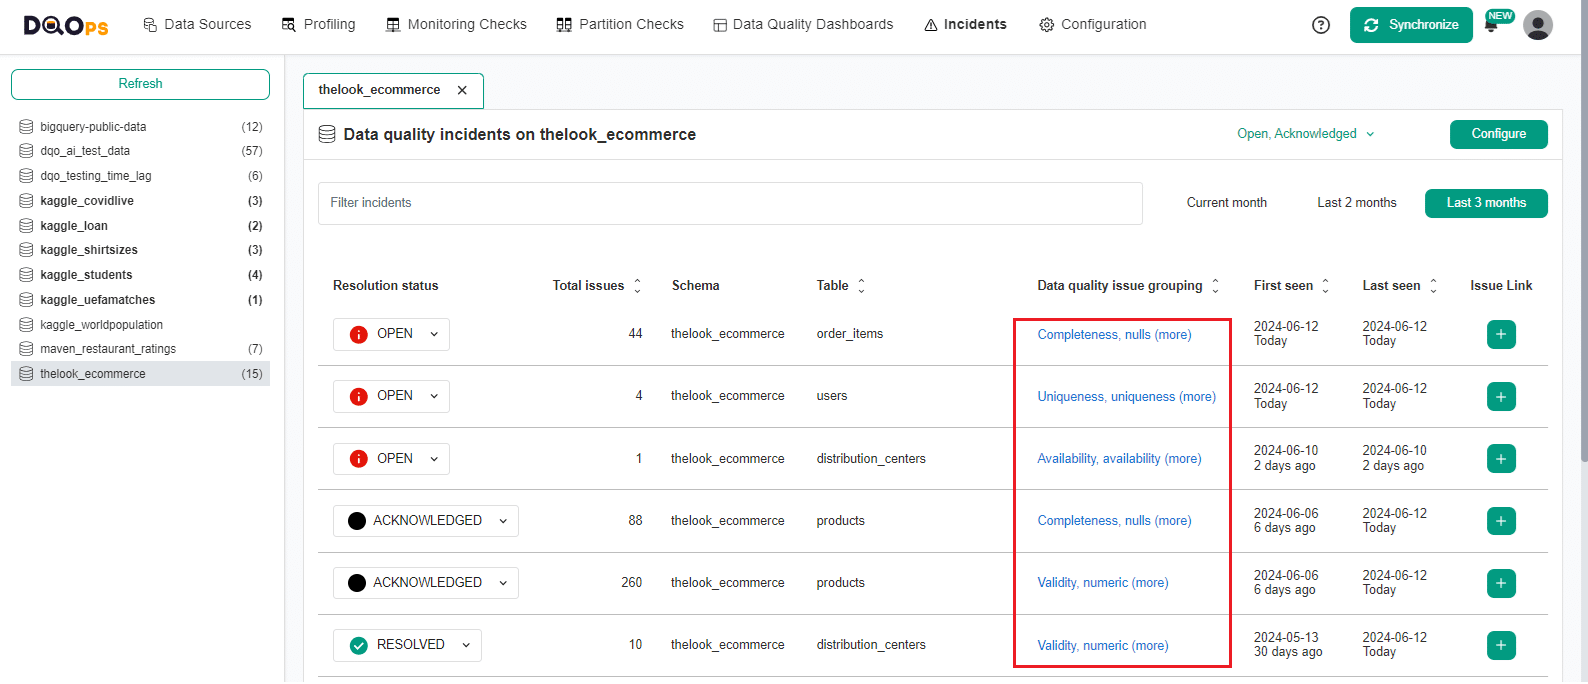
- Data quality issue grouping: Name of the failed data quality check or a group of checks. Click this link to view details of the incident.
- First seen: The time at which this issue first appeared.
- Last seen: The time at which this issue last occurred.
- Issue link: A link to the issue tracker
By default, incidents are grouped by table name, data quality dimension and check category. To change the grouping method click the Configure button in the upper right which will link you to the Incidents and Notifications tab in the Data Source section. Change the level of grouping for data quality incidents and click the Save button.
Delete incidents
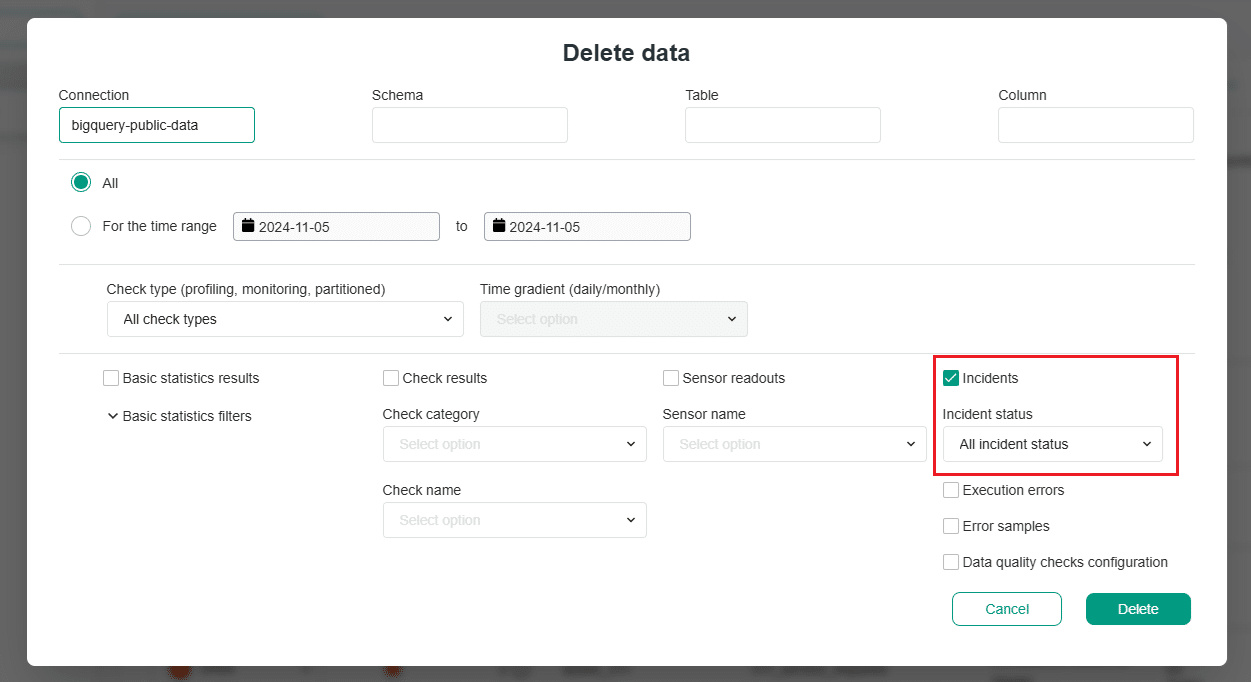
To delete incidents for the whole connection, click on the three-dot icon located to the right of the connection name.
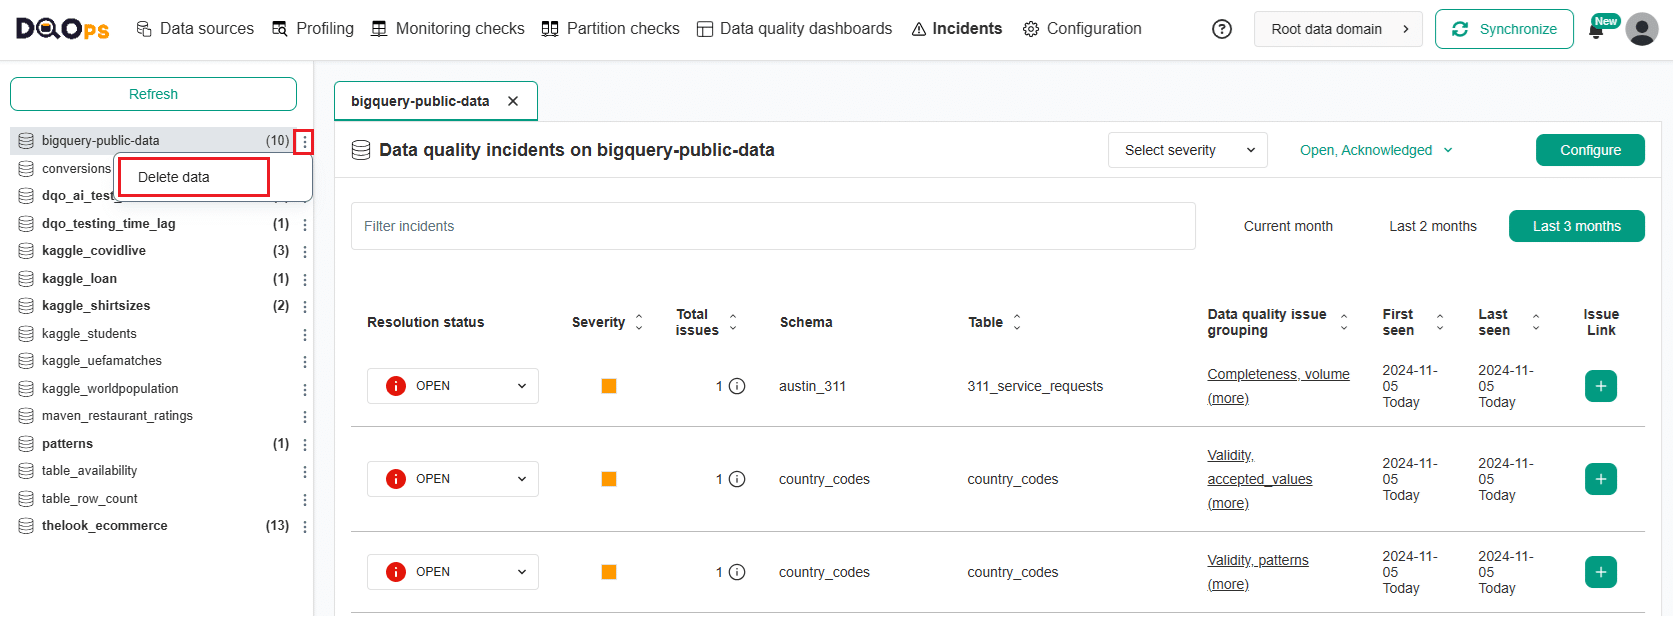
This will open a Delete data popup window with the Incidents checkbox preselected. In this window, you can refine your delete options by selecting a specific column, schema, or table, as well as specifying a time range or choosing a particular incident status.
Filter incidents
Use filtering to restrict the types of issue groups that appear in the list.
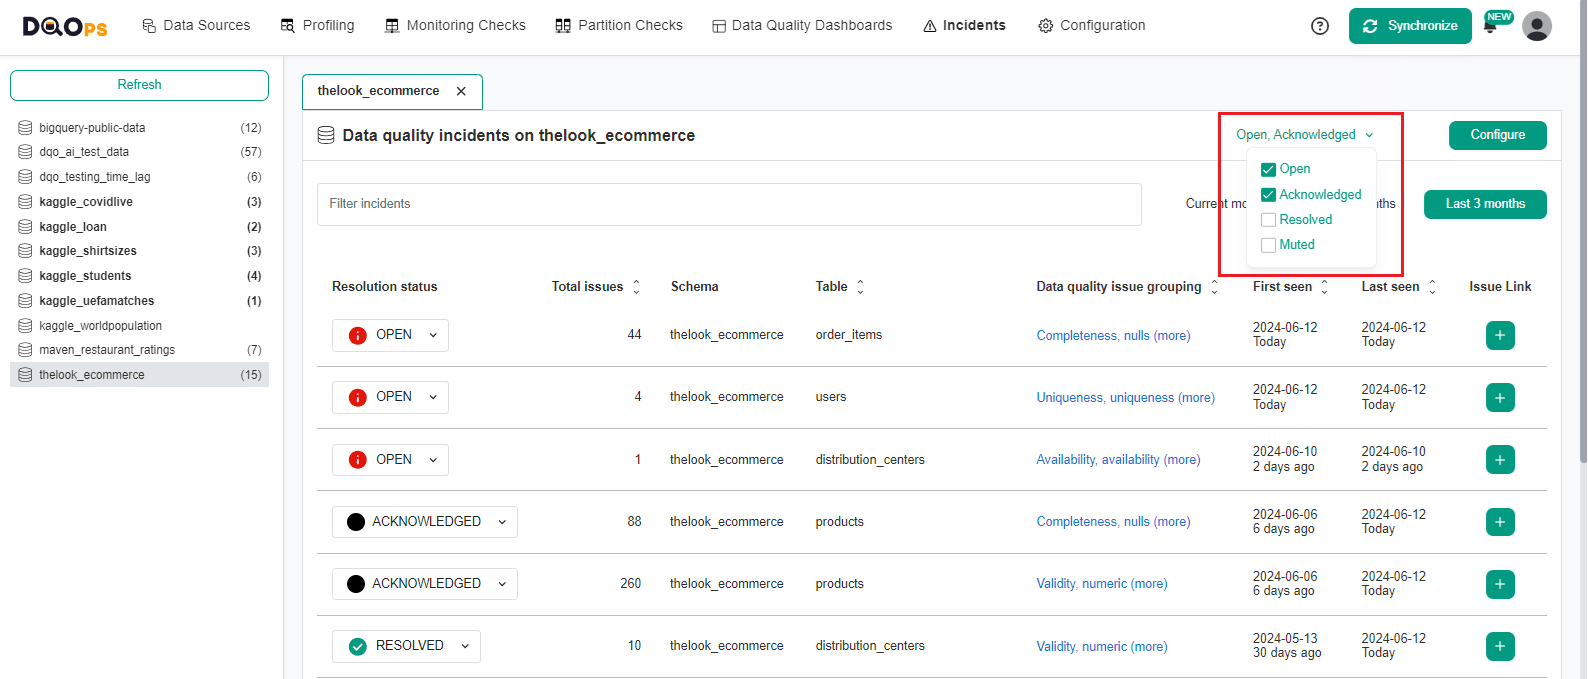
You can filter the list of incidents by the resolution status by selecting or deselecting status type in the resolution status filter.
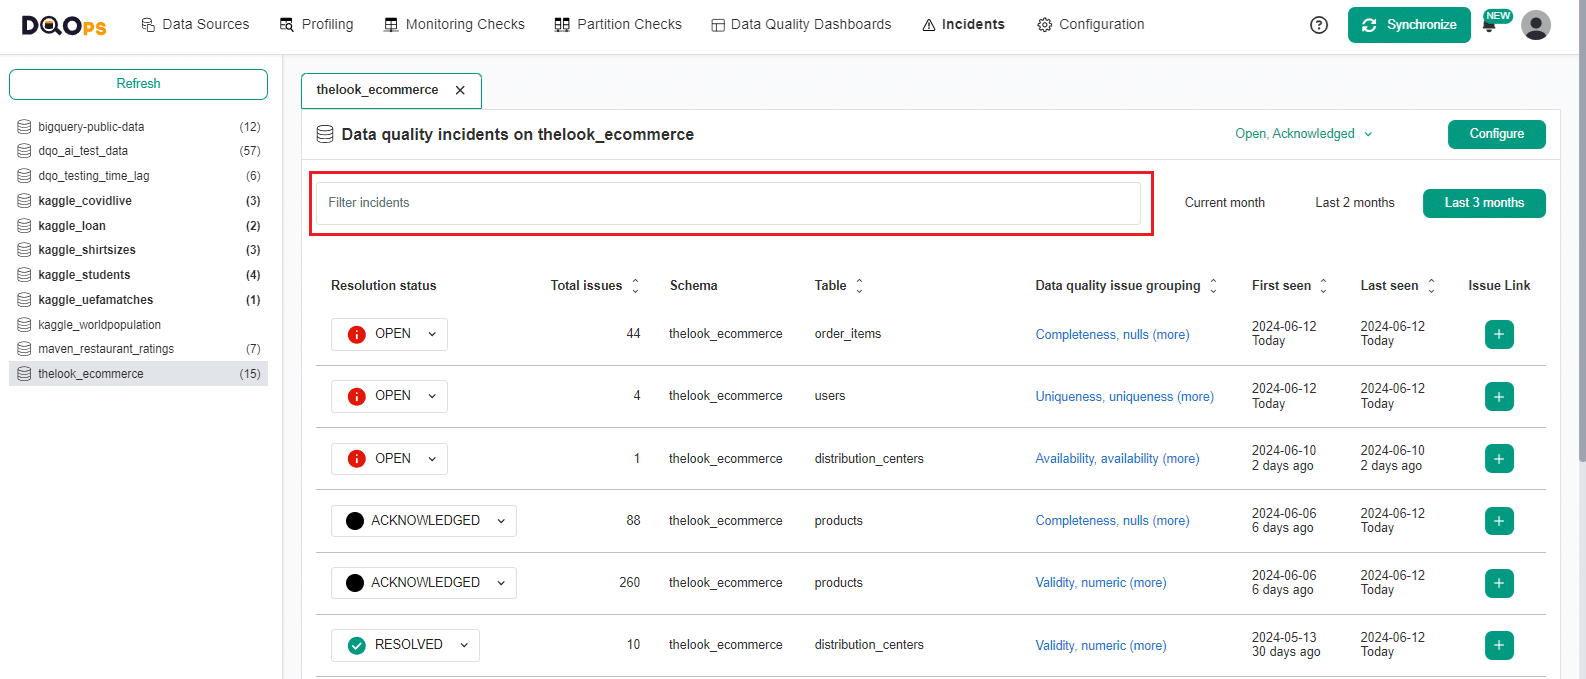
You can filter the list of incidents by the keyword, such as schema, table or check name, by typing it in the input box.
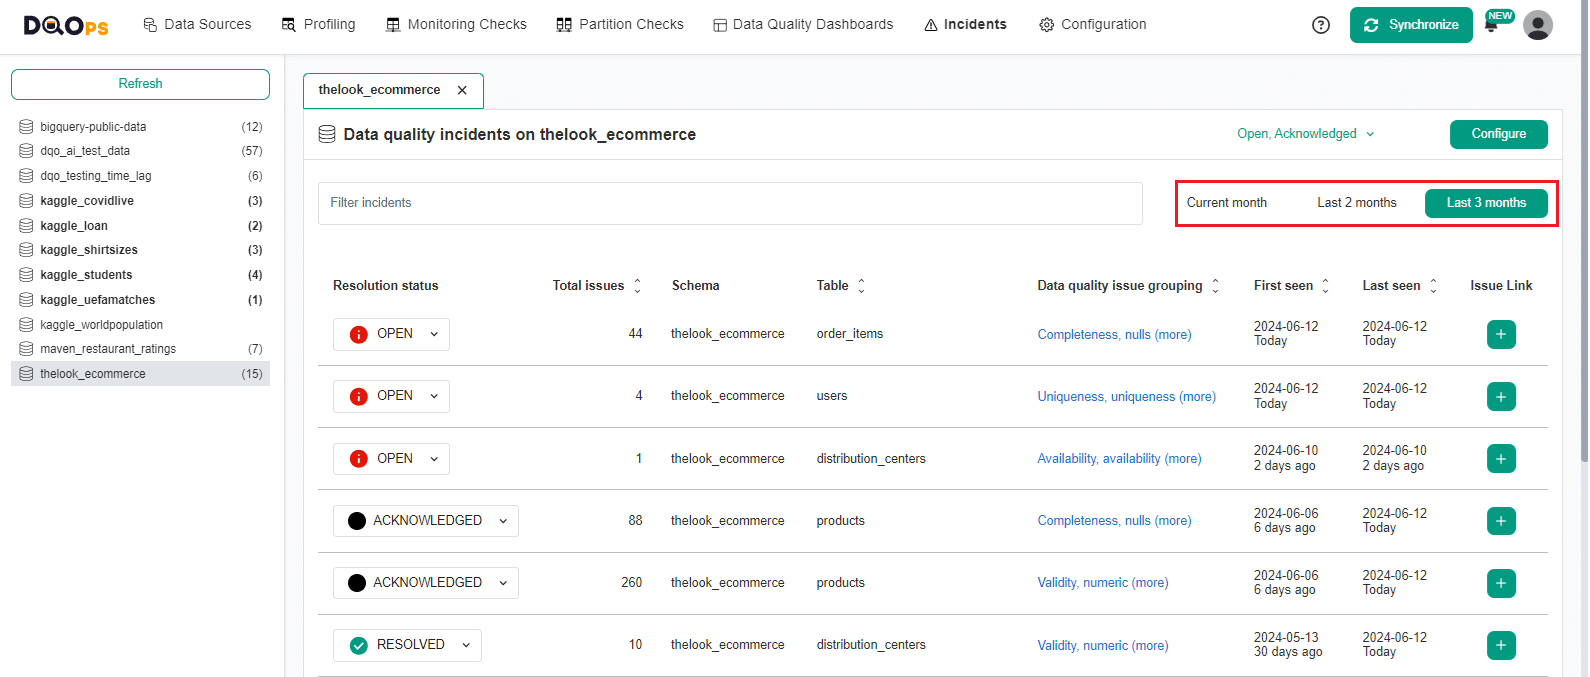
You can restrict the incidents that appear in the list to a specific time range: current month, last 2 months, or last 3 months using the time range filter buttons.
Sort incidents
You can sort the incidents table. Simply click on the sorting icon next to a column header to sort the incidents table by that column.
Change the resolution status
To help you manage the incidents, each of them can have the following resolution status values:
- Open: The default initial state of all incidents. The other states are set manually. You can revert an incident's status back to Open at any time.
- Acknowledged: A state indicating that the incident was acknowledged.
- Resolved: A state indicating that an incident is fixed.
- Muted: A state for hiding the incident from your list. By default, any data quality issues associated with that incident will be muted for 60 days. If an incident is muted, DQOps will not create a new one. To change the time duration for muted incidents click the Configure button.
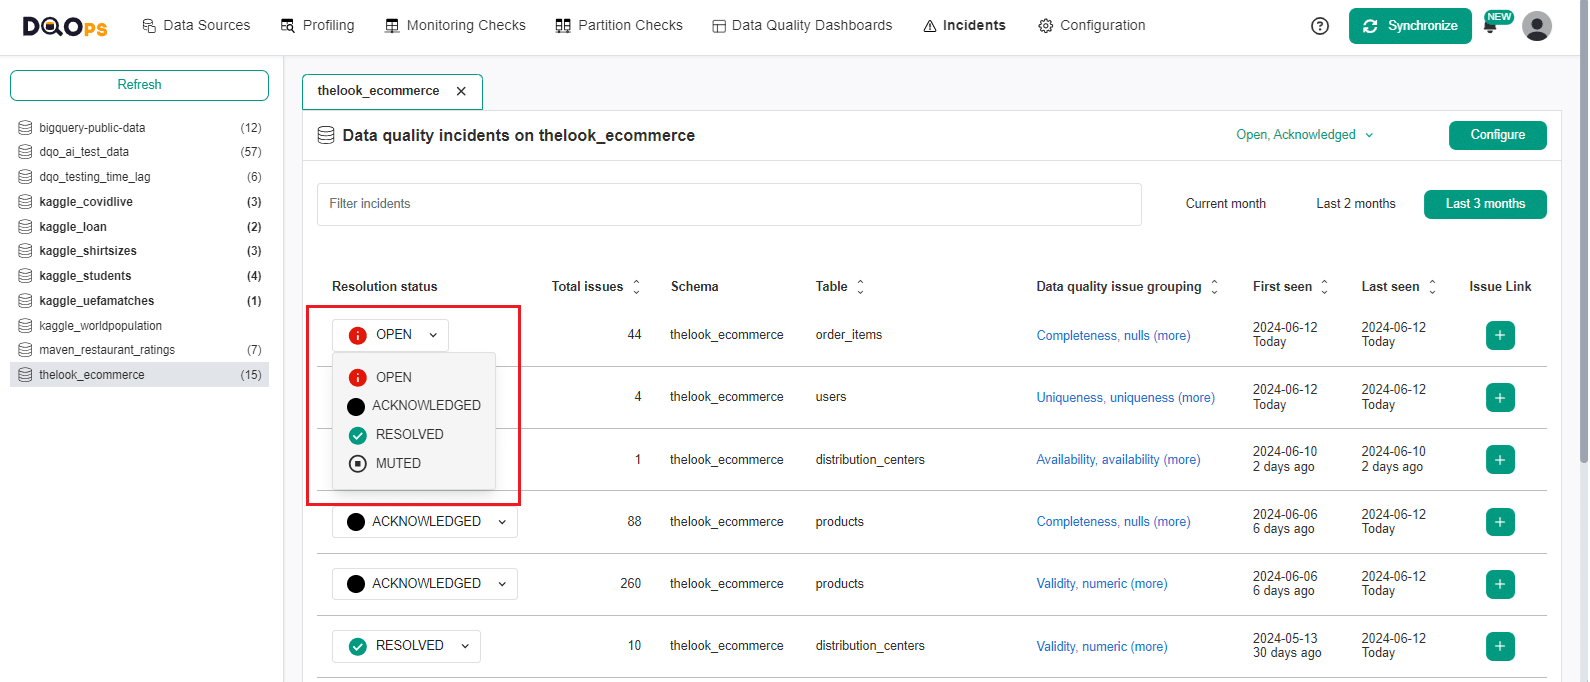
To change the resolution status, simply chose the status from the dropdown menu.
Add Issue link
You can add an issue tracker link to an incident by clicking the "+" button in the Issue Link column.
![]()
View details of the incident
To view details of the data quality incident, click the link in the Data quality issue grouping column. The detailed data quality incident screen will open as a new tab.
The detailed data quality incident screen shows a list of data quality issues which are grouped in the incident and allows you to filter and sort them.
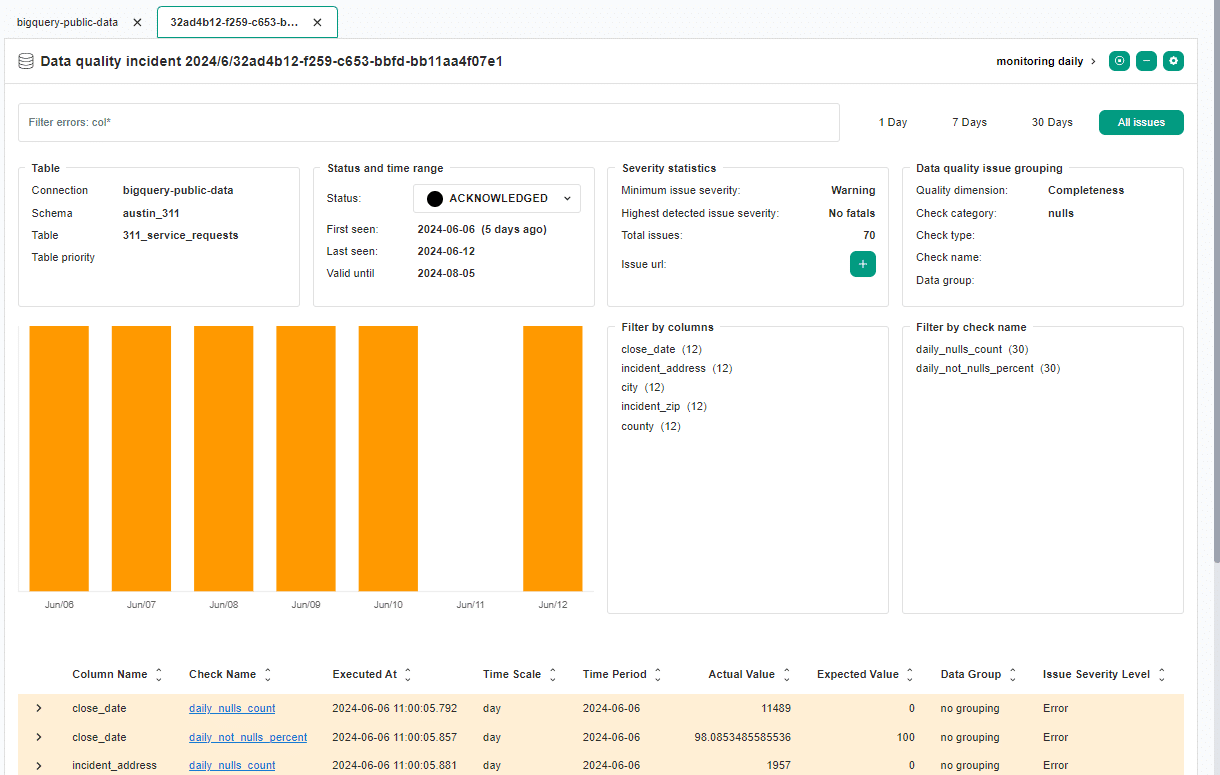
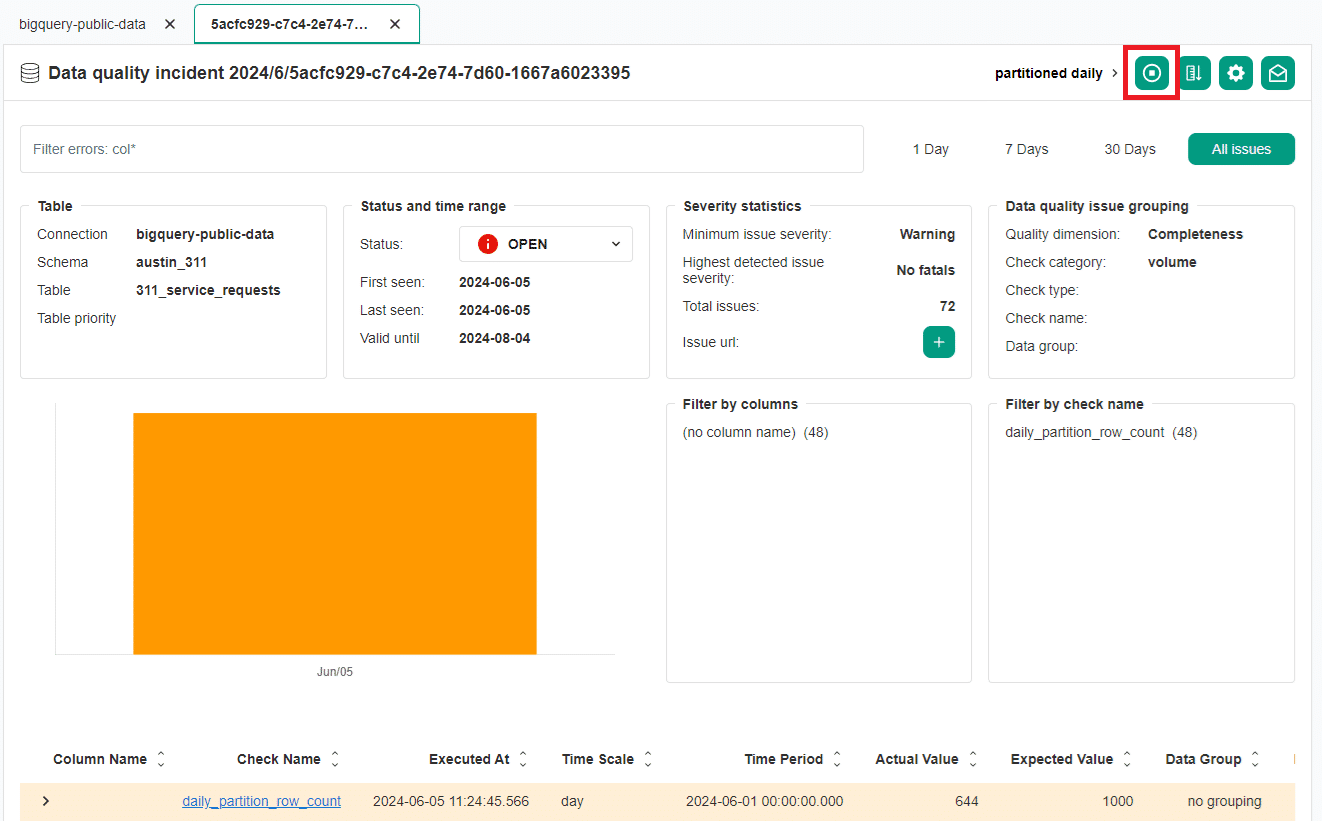
The upper right corner of the Incident details screen provides access to several helpful actions:
- Disable checks for the incident: This button allows you to temporarily disable the check responsible for the incident. Disabling a check can be useful when you are actively working to resolve the underlying issue.
- Reconfigure rule thresholds: Clicking on this button will decrease the rule threshold for the data quality check that caused the incident by 30% to reduce the number of data quality issues.
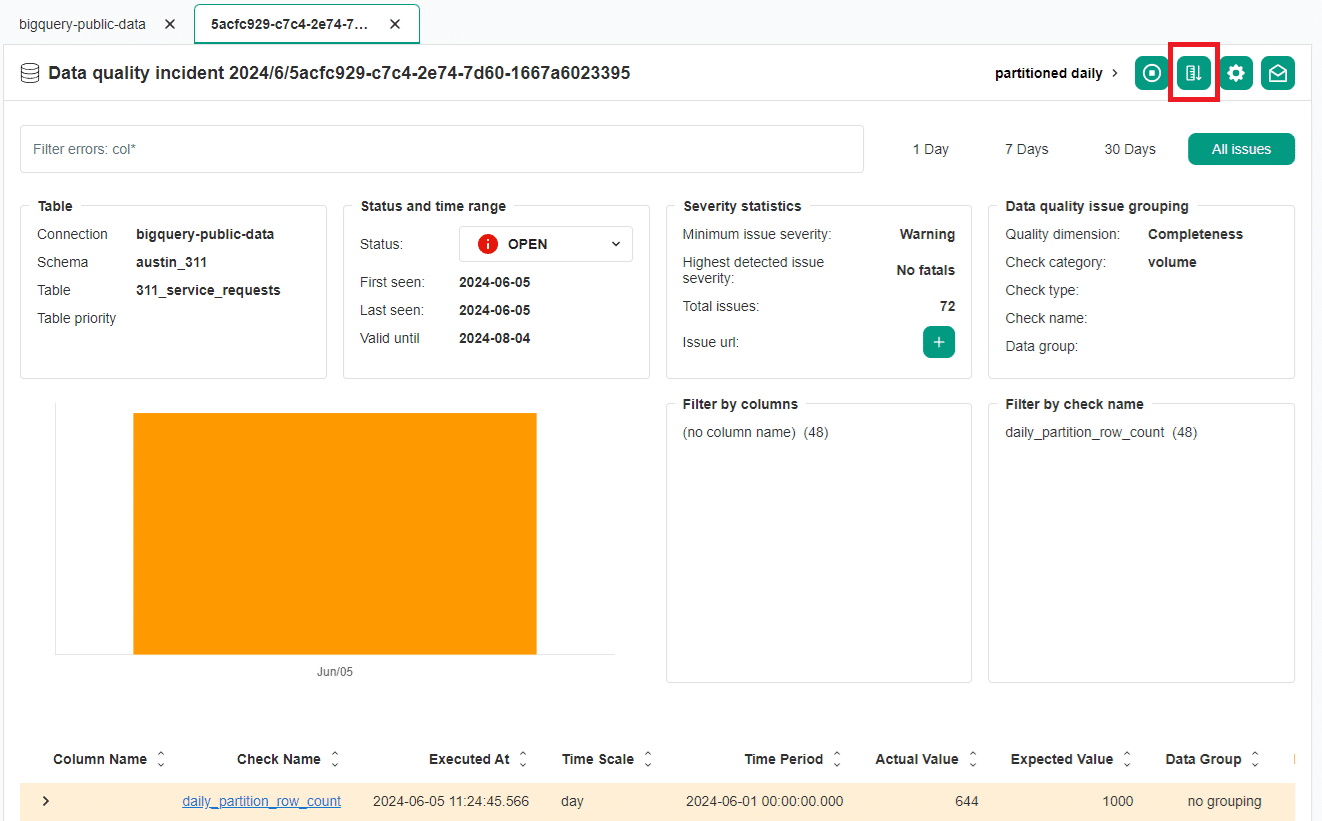
- Change incident configuration: This button opens the Incident configuration screen for the table where the incident originated. This allows you to manage incident settings, such as grouping and severity levels.
- Configure notification for this incident: This button allows you to create new or modify existing notification for this incident.
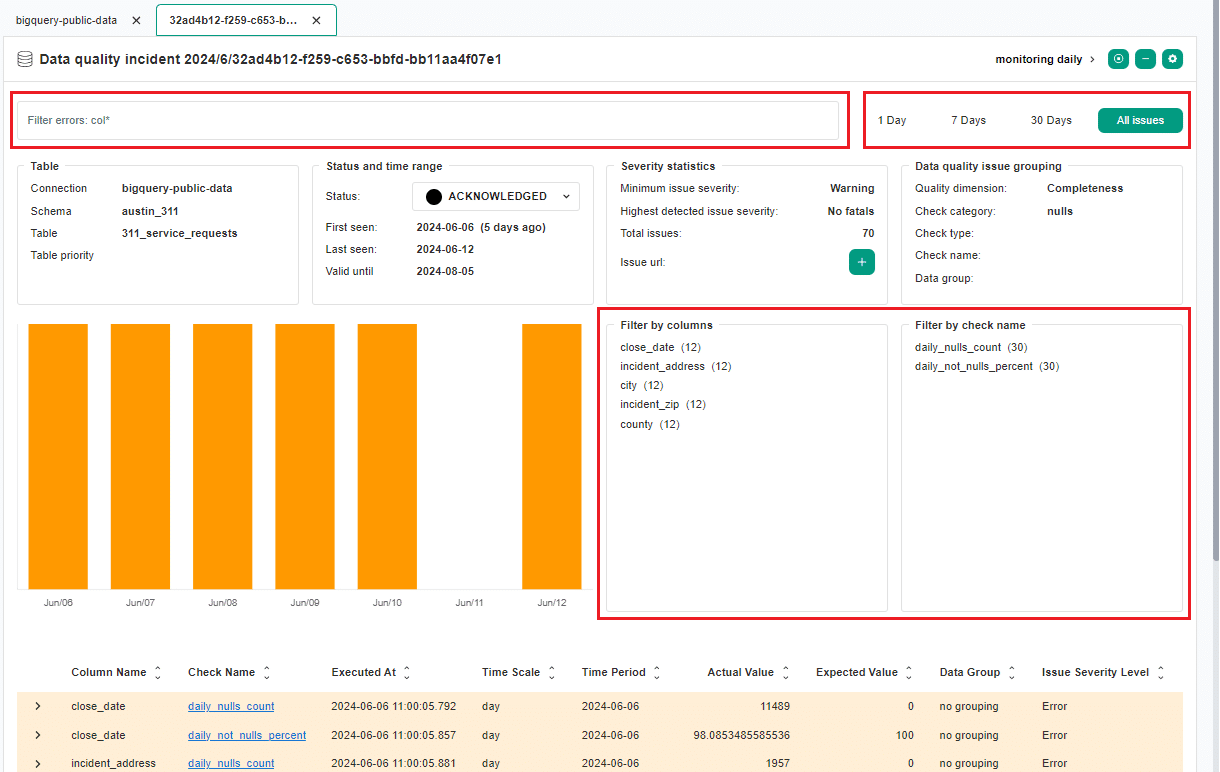
Filter data quality check results
Use filtering to restrict the types of data quality issues that appear in the list and on the bar chart.
You can filter the list of issues at the bottom of the screen by the keyword by typing it in the input box. You can use time range filter buttons in the top right to show only the data quality issues from the last day, 7 days, 30 days, or view all issues. Finally, you can filter the list of issues by column or check names by clicking on the name of the column or the check name in the appropriate boxes.
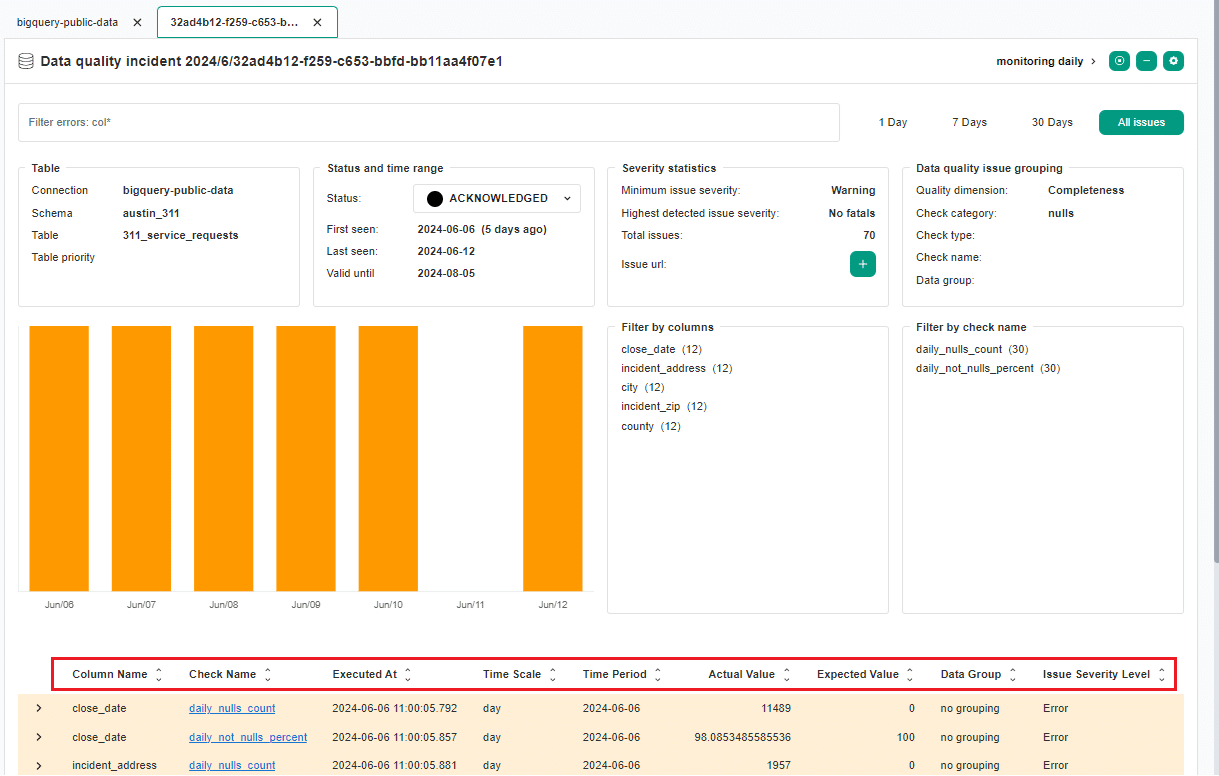
Sort issues
To sort the issue table, simply click on the sorting icon next to any column header.
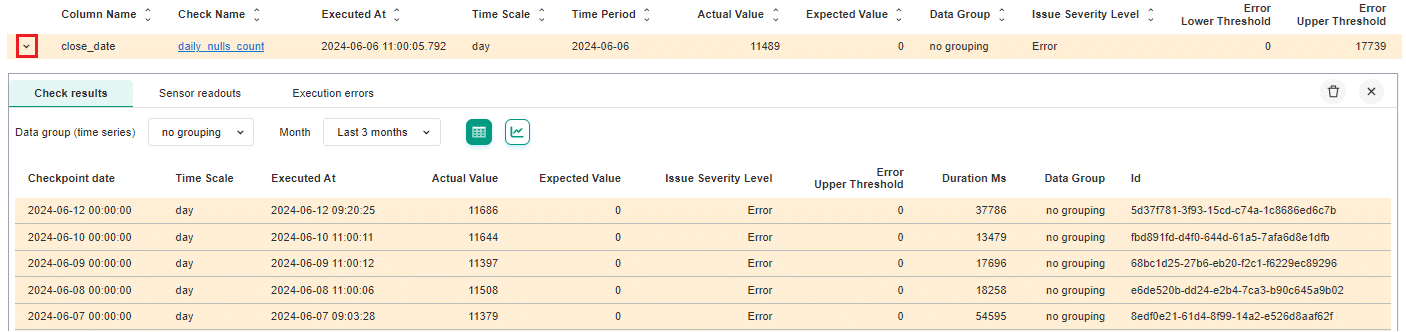
View detailed check results
To view detailed check results, simply click the down arrow next to an issue in the detailed table. This will expand a section displaying the historical record of the check's execution that raised the issue.
This allows you to see how the Check results changed over time, giving you insight into the specific details that triggered the issue. If the check encountered any errors during execution, they will be displayed in the Execution error tab section. This can help identify technical problems with the check itself.
Disable check for the incident
To manage incidents, you have the option to disable the check responsible for the incident. Disabling a check can be useful when you are actively working to resolve the underlying issue.
To disable a check, click on the "Disable check" button in the top right corner of the Incident details screen. Once confirmed, the check will be temporarily stopped from executing.
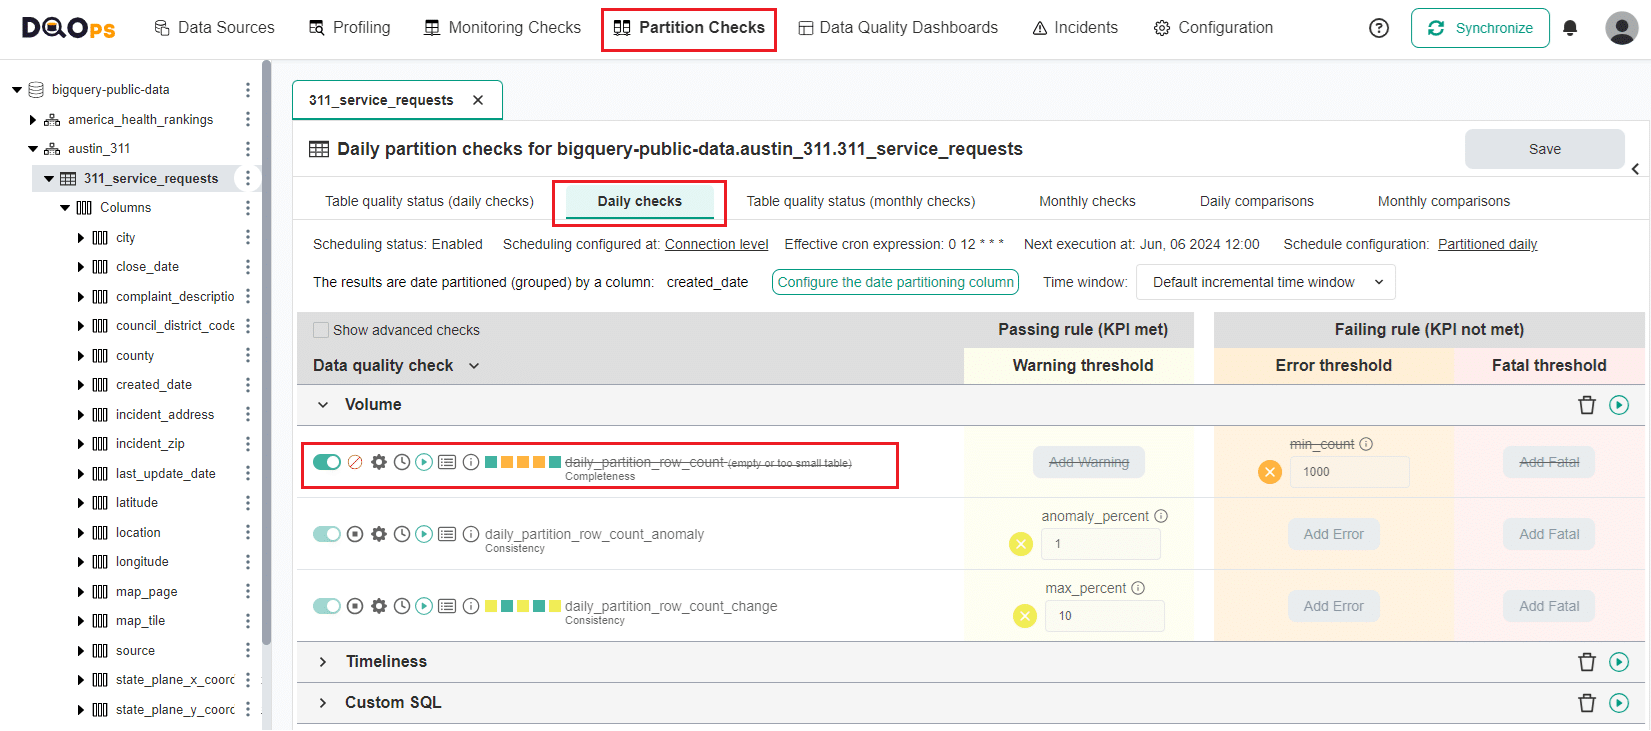
You can verify that the check has been disabled by navigating to the check editor screen.
Recalibrate check for the incident
DQOps offers a one-click option to automatically reduce the number of data quality issues identified by a check. This can be helpful in situations where the check might be overly sensitive.
Clicking the Reconfigure button will decrease the rule threshold for the data quality check that caused the incident by 30%. For more significant adjustments, you can click the Recalibrate button multiple times. Each click will further reduce the check's thresholds by an additional 30%.
The following example YAML files illustrate the daily_partition_row_count check configuration before and after reconfiguration.
Notice that the min_count rule has been reduced from 1000, to 700.
Configure notification for an incident
To receive notifications for specific data quality incidents, you can create or edit notification filters. To do this, click on the envelope icon located in the top right corner of the incident details screen.
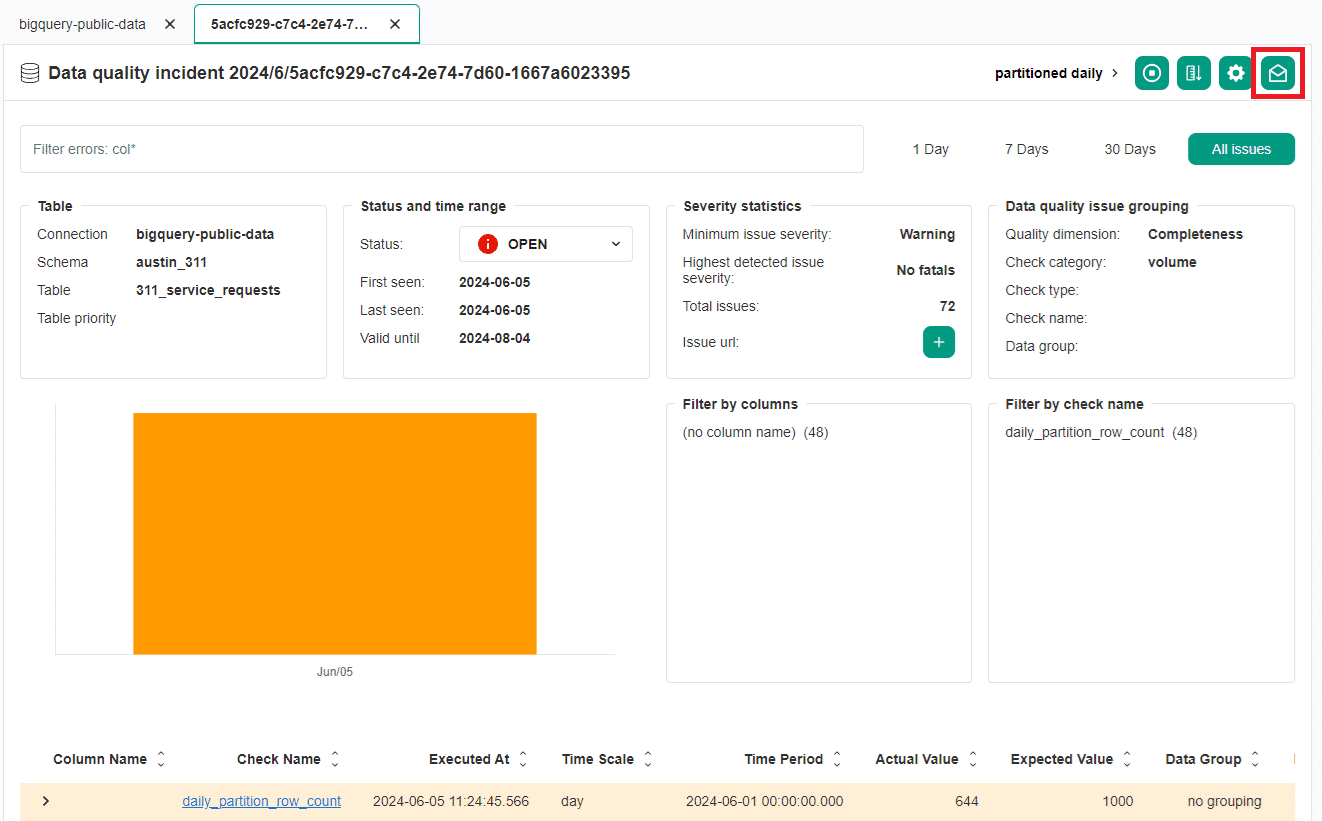
The action after clicking on the envelope icon will depend on whether the incident matches any existing incident notification filters.
Adding a new notification filter.
If no notification has ever been configured for the incident, you will see a popup message informing you to create a new notification configuration.
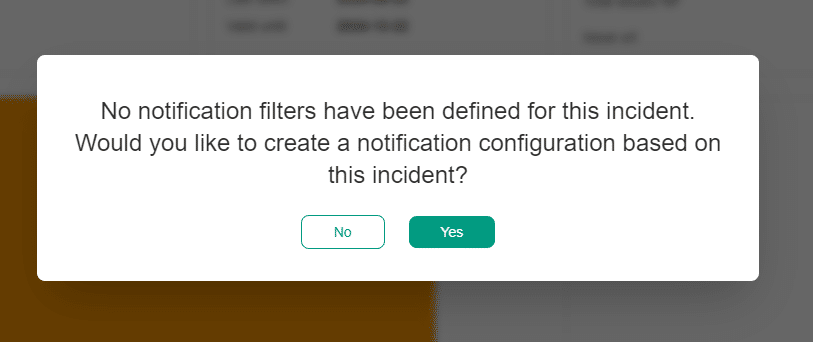
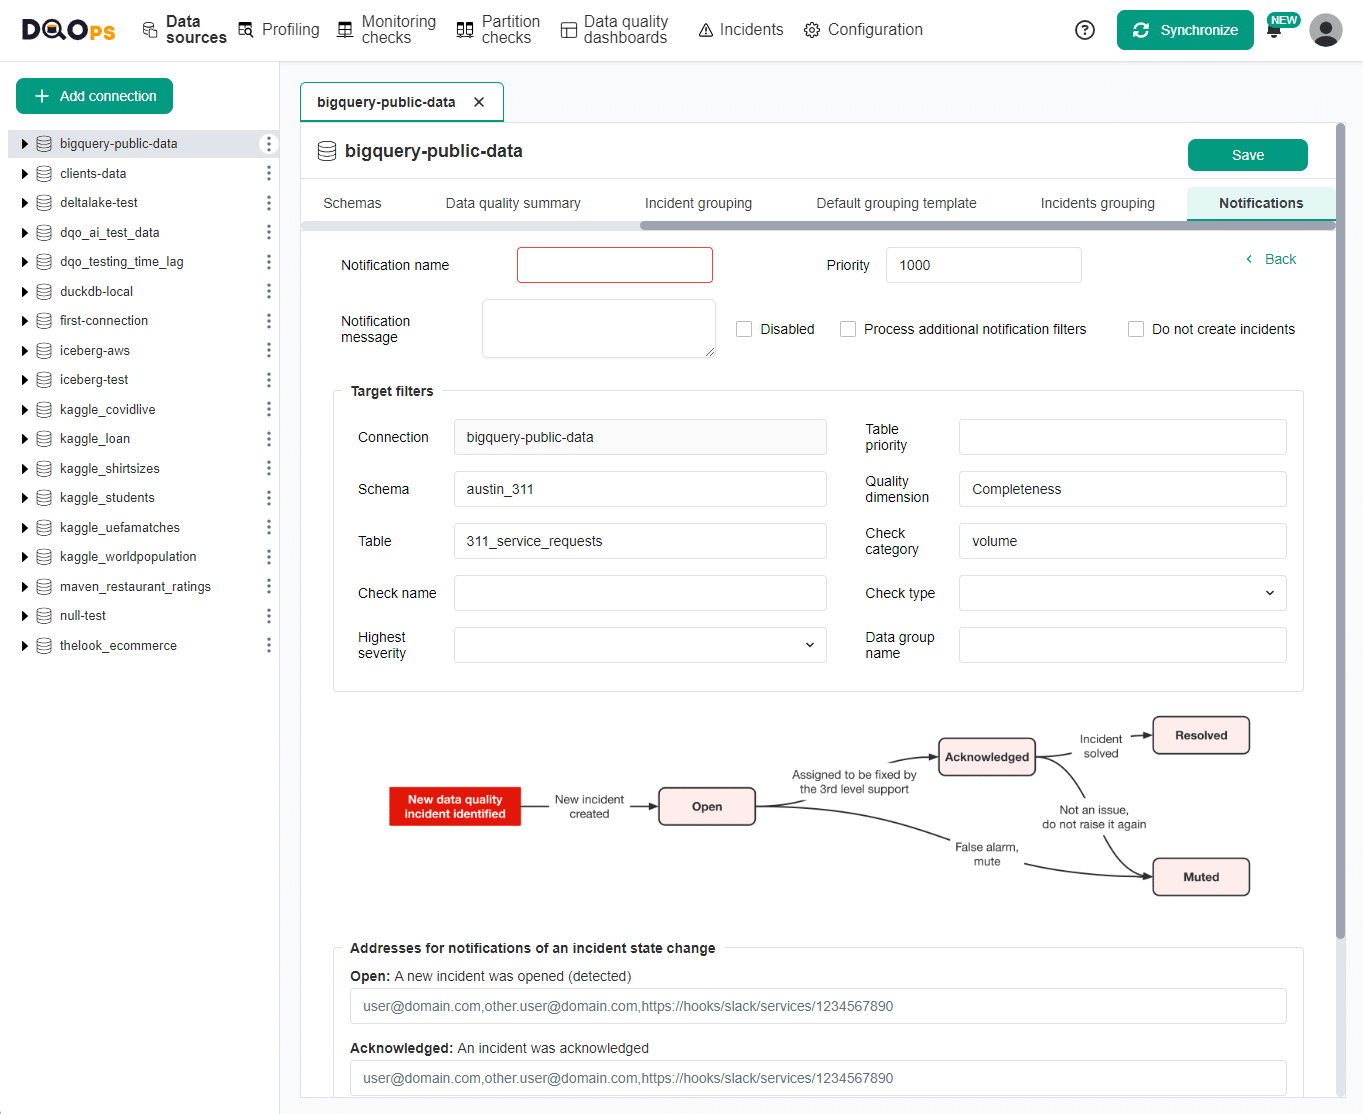
Once approved, you will be redirected to the page to create the new incident notification filter. The configuration form will be partially filled based on the incident's data. The details of the filter configuration can be found in the section Notification filters below.
Editing an existing notification filter
If the notification matches an existing filter, a screen with this filter will open, and you can edit the filter's settings.
Learn more about configuration of the notification filtering in the Concept section
What's next
- Learn more about incident notifications and how to get notified about new data quality incidents on Slack or by publishing messages using webhooks.
- Read the concept of grouping data quality issues to incidents to understand how DQOps groups similar data quality issues (failed quality checks) into incidents.