Last updated: September 26, 2024
Review results from data quality assessment and automatically configure data quality checks
This guide will show you how to review results from data quality assessment and automatically configure data quality checks to detect the most common data quality issues. We will run those check, review the first results and create an incident notification for data quality issues.
Overview
After adding your first connection, and starting data assessment, we describe how to review the initial results from the basic statistics and profiling checks. Then, by using the DQOps rule mining engine, we will automatically configure (mine) data quality checks to find the most common data quality issues. Next, we will run monitoring checks, review results and create an incident notification for data quality issues.
Review basic statistics results
Basic statistics provides you with summary information about your tables and columns. This information is valuable in deciding which data quality checks and threshold levels should be set to monitor data quality.
The information from basic statistics is also used by rule miner to propose a reasonable configuration of data quality checks.
In the previous step we have collected basic statistics for imported tables and columns.
To review the results:
- Go to the Profiling section.
- Select the orders.csv table on the tree view on the left.
-
The results are displayed under the Basic data statistics tab.
You can filter the columns by simply clicking on the sorting icon next to any column header.
For detailed description of each column go to the Basics statistics section.
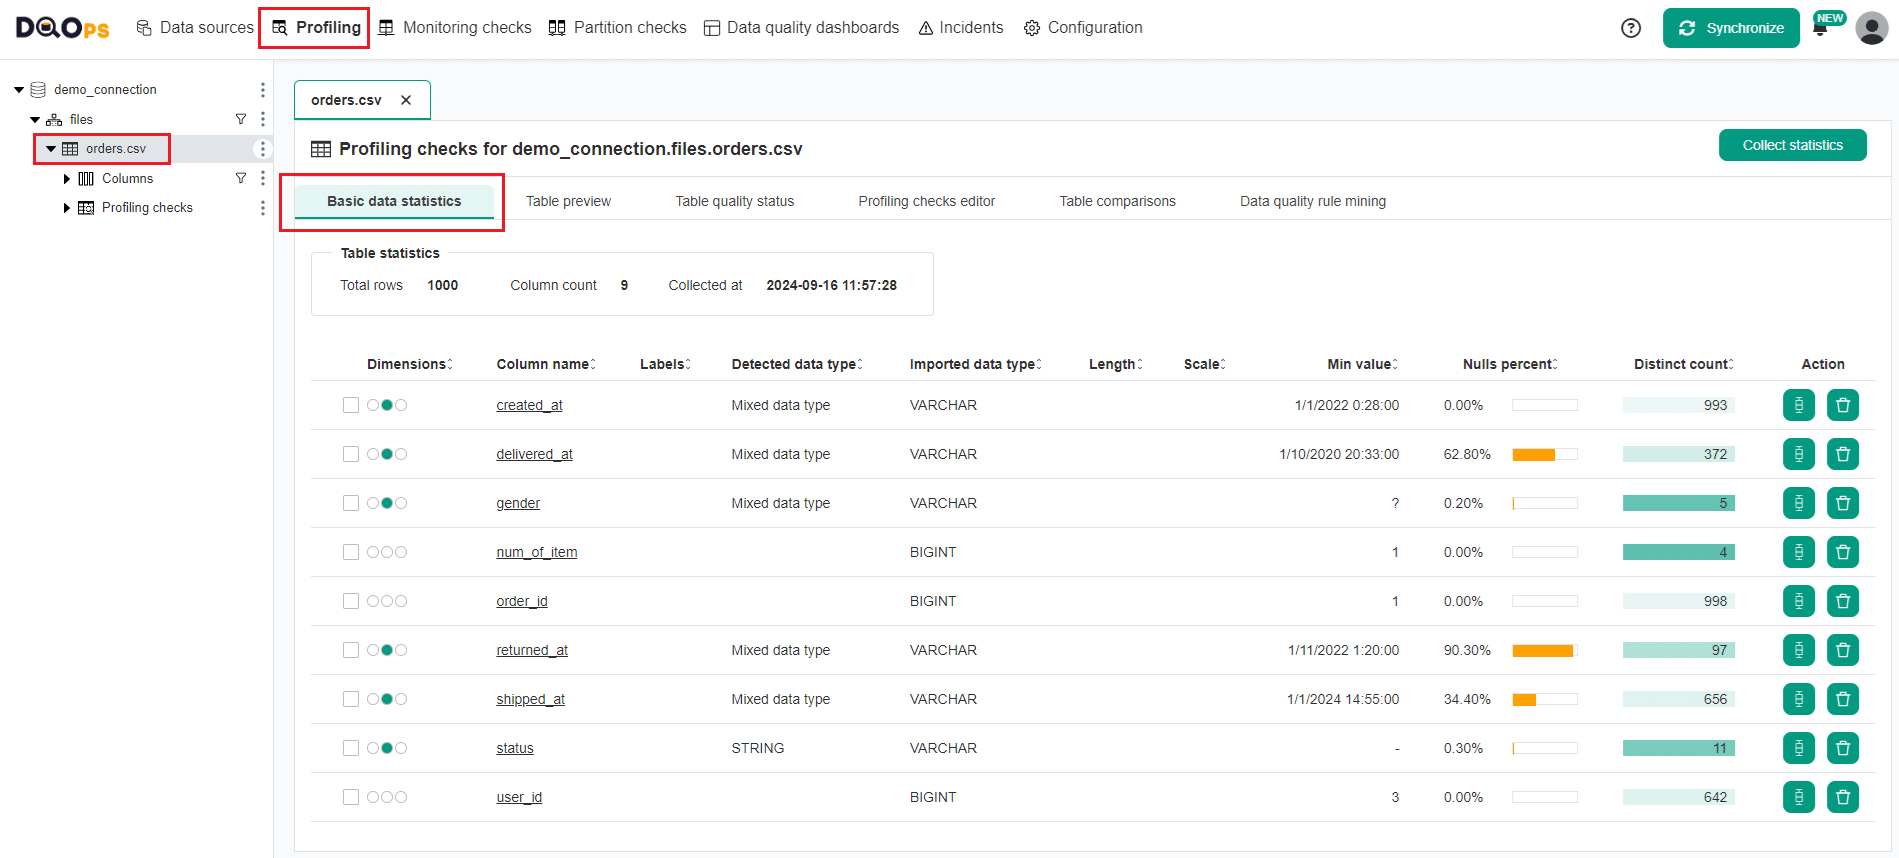
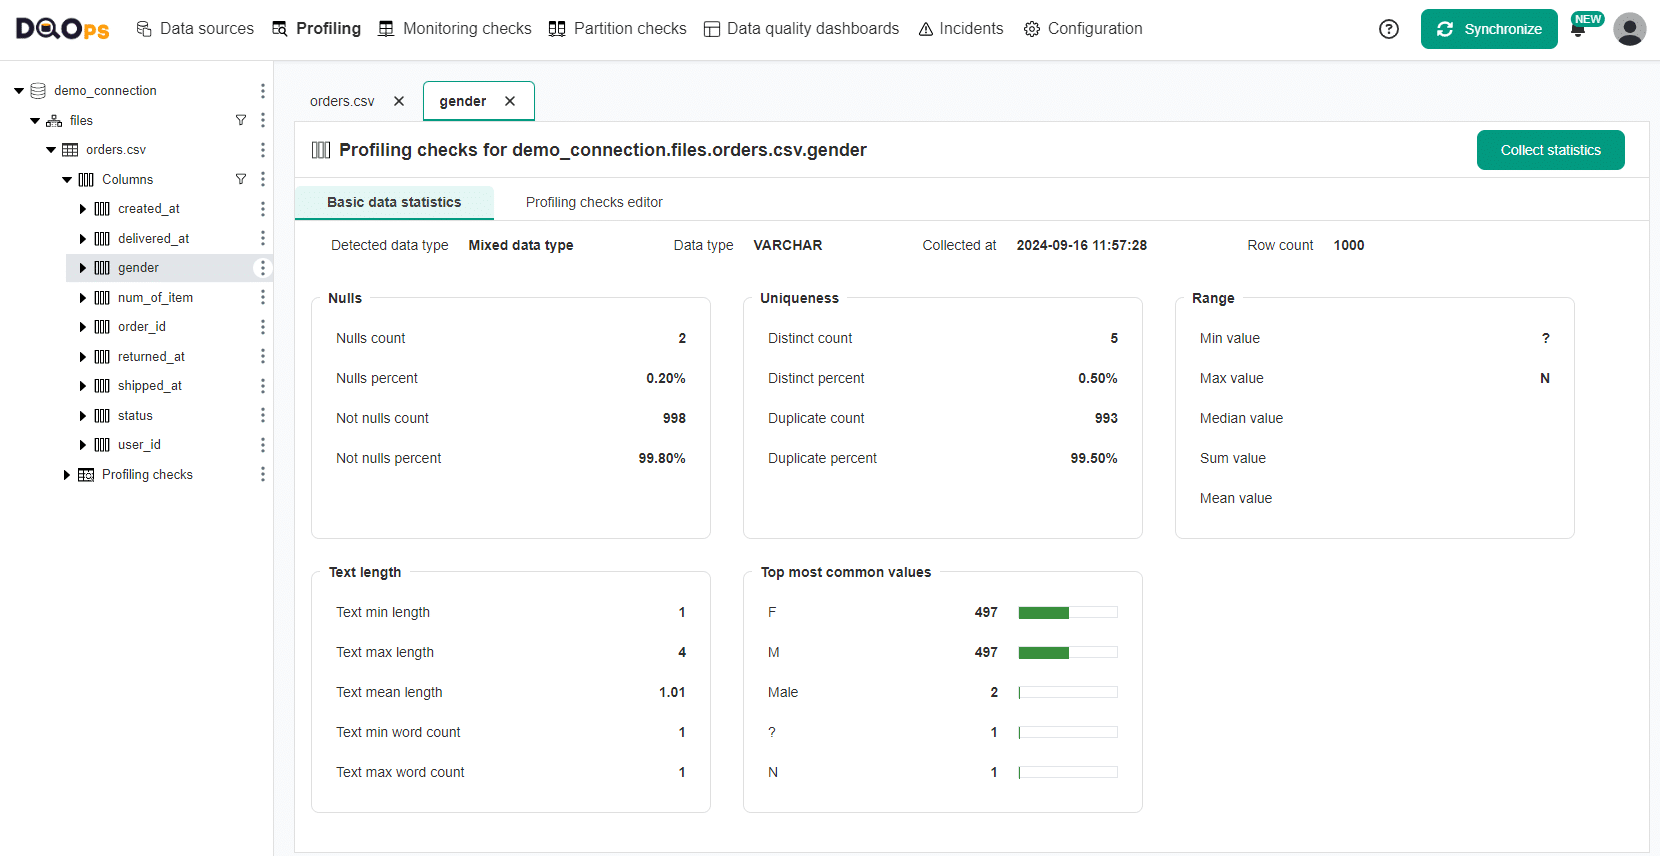
To view detailed statistics for column, click on the name of the column or navigate to the single column on the tree view.
Propose a configuration of data quality checks using rule mining
Setting up data quality rules and thresholds manually can be time-consuming, especially since most checks will show that everything is okay. DQOps automates this process with its data quality rule mining engine. The engine analyzes data collected from basic statistics, sample values and results from profiling checks to propose check configurations for detecting common data quality issues. It also suggests checks that will pass for the current data and serve as a baseline for detecting changes in data distribution over time.
You can find more information about the data quality rule mining in the concept section.
Navigating to the rule miner
To navigate to the data quality rule miner.
- Select the Profiling section
- Select the table of interest on the tree view on the left.
- Click on the Data quality rule mining tab
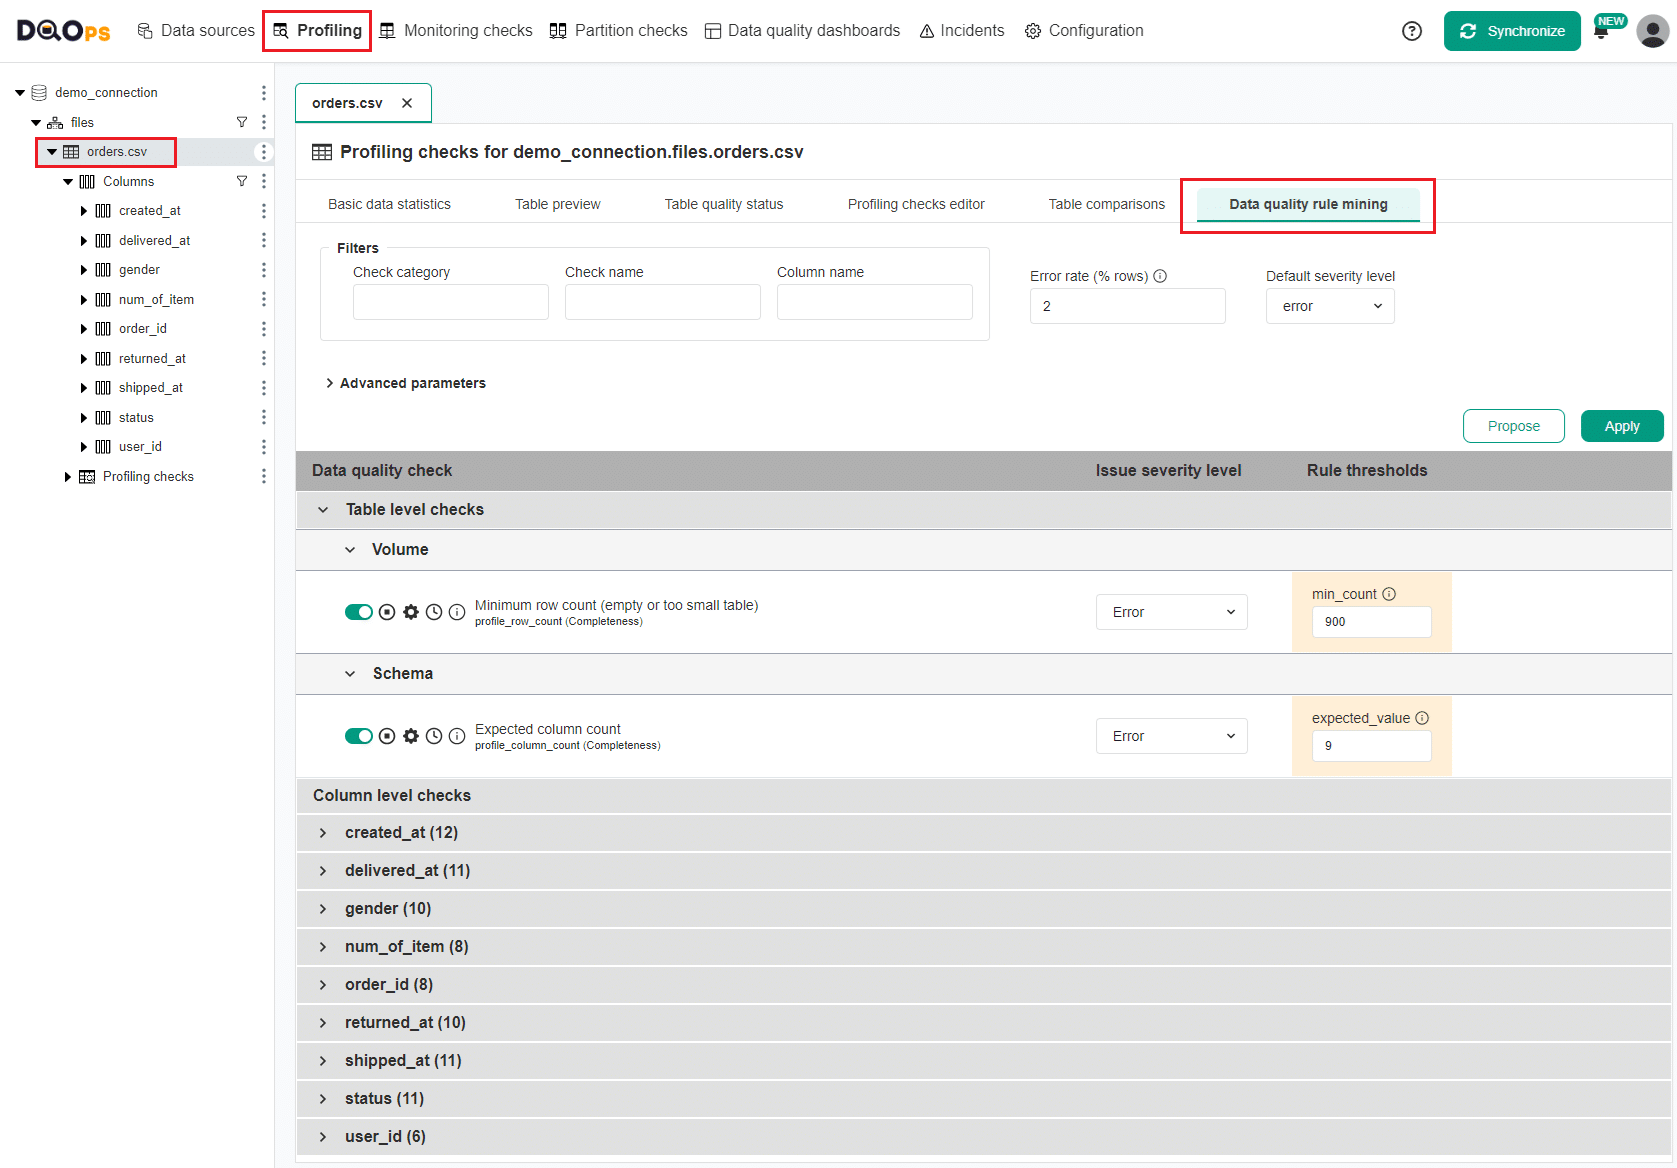
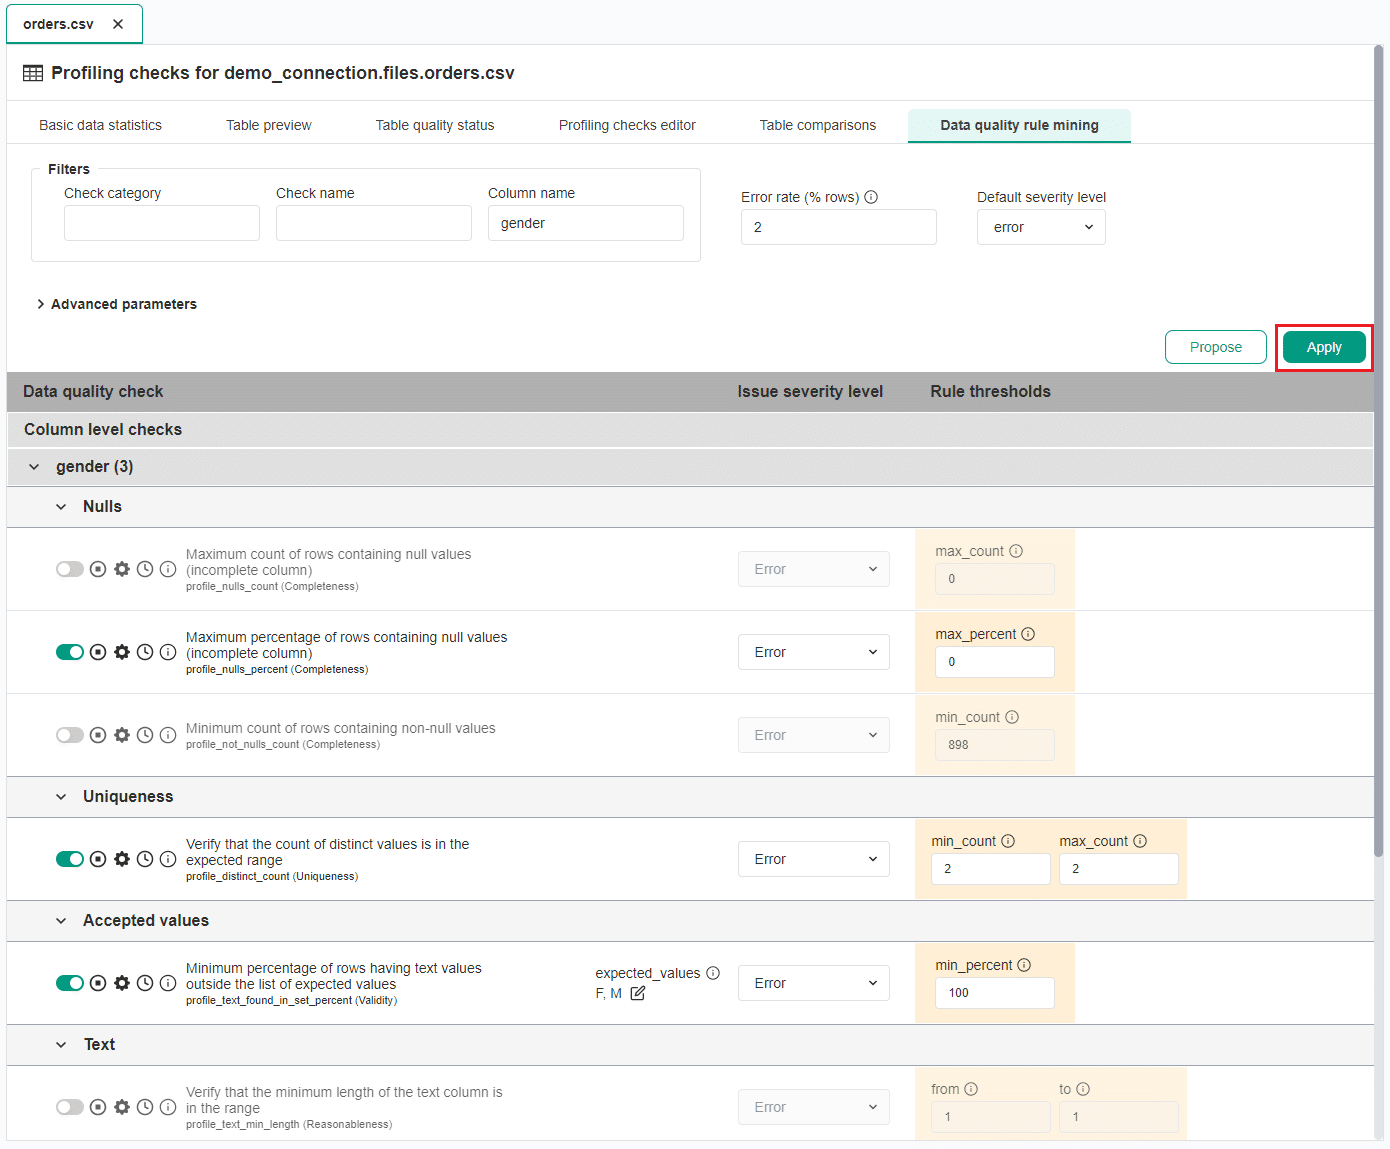
The rule mining screen allows you to view and select the automatically proposed configuration of data quality checks. DQOps proposes a list of data quality checks instantly upon entering the rule mining screen. If any parameter configuration is changed, clicking the Propose button will generate a new proposal. Use the Apply button to save (apply) the proposed check configuration.
The rule miner shows proposed configurations as a list of checks divided by table, columns and check types. The column names can be expanded to view the proposed checks. You can change the proposed data quality check parameters and data quality rule thresholds before applying the proposed configuration.
You can also customize the rule miner proposals with the following options:
- Filtering by check category, check name and column name: You can use these filtering options to narrow down the list of proposals by specifying check category, check name, or column name.
- Error rate (% of rows): The most critical configuration parameter of the rule miner to control its sensitivity. It represents the percentage of errors that can contain invalid values. By default, it is set to 2%, but you can change this value. DQOps will attempt to configure data quality checks to detect data quality issues in 2% of records containing the most outstanding values.
- Default severity level: This is used to set the initial severity level for proposed checks, which can be later modified individually.
- Advanced parameters: These parameters contains checkboxes that allows control how the rule mining engine handles already configured data quality checks and select data quality check categories that you want to include in the proposal. More information about Rule mining parameters.
Automated data quality check configuration using rule miner
As an example, let's filter the initial proposition with the column name gender.
Click on the Propose button to get the filtered proposition.
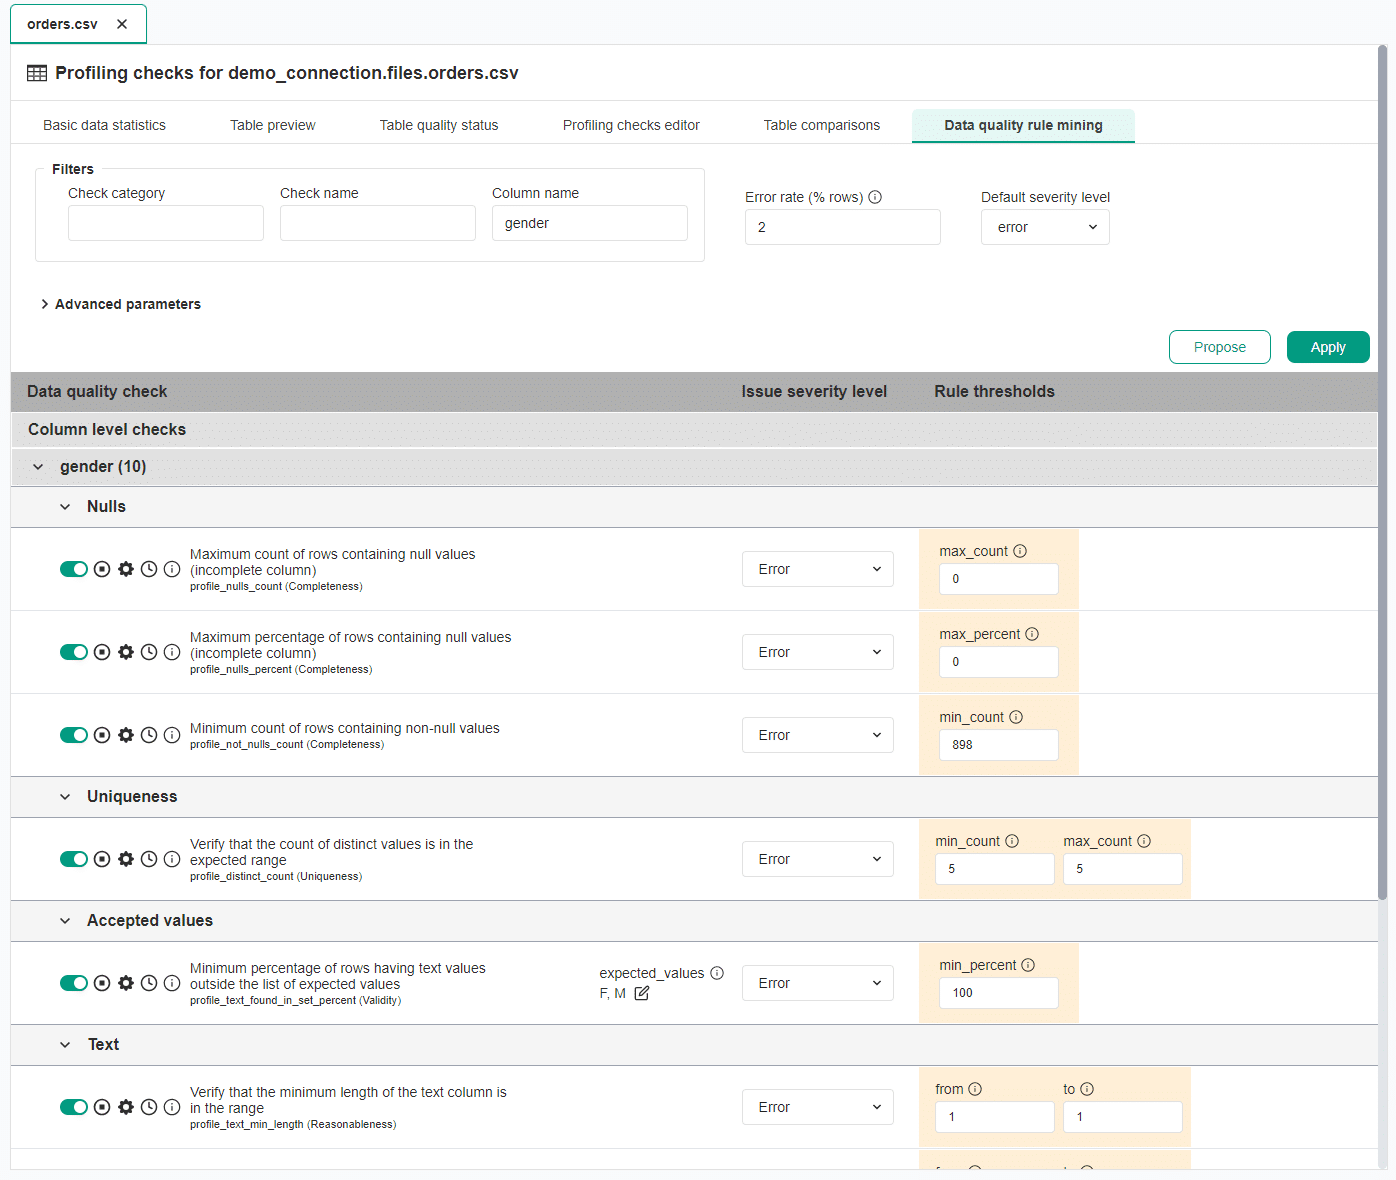
From the list of propositions, we will make the following modifications:
- In the Nulls category, keep only the profile_null_percent check with suggested max_percent parameter to value of 0.
- In the Uniqueness category, adjust the profile_distinct_count check to have a range value of 2 to ensure 2 distinct values (M and F) are present.
- In the Accepted Values category, keep the profile_text_found_in_set_percent check with the suggested values M and F.
- In the Text and PII categories, deactivate all checks using the green toggle button.
Click on the Apply button to apply the proposed check configuration.
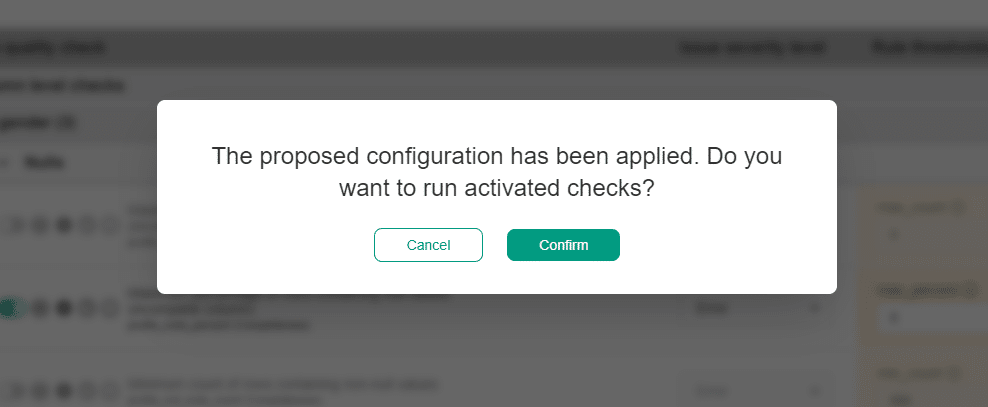
A popup window will appear, notifying you that the checks have been activated, and that you can run activated check by clicking on the Confirm button.
A notification will appear indicating that the job has begun, and the Table quality status tab will start flashing.
If desired, you can use the rule miner to activate more checks for table or other columns.
Review profiling checks results
Profiling checks enable you to run more advanced data analyses than Basic data statistics. Profiling checks are also useful for exploring and experimenting with various types of checks and determining the most suitable ones for regular data quality monitoring.
In the previous step we have run several profiling checks suggested by the rule mining. Now, let's review the results.
Review Profiling Table quality status
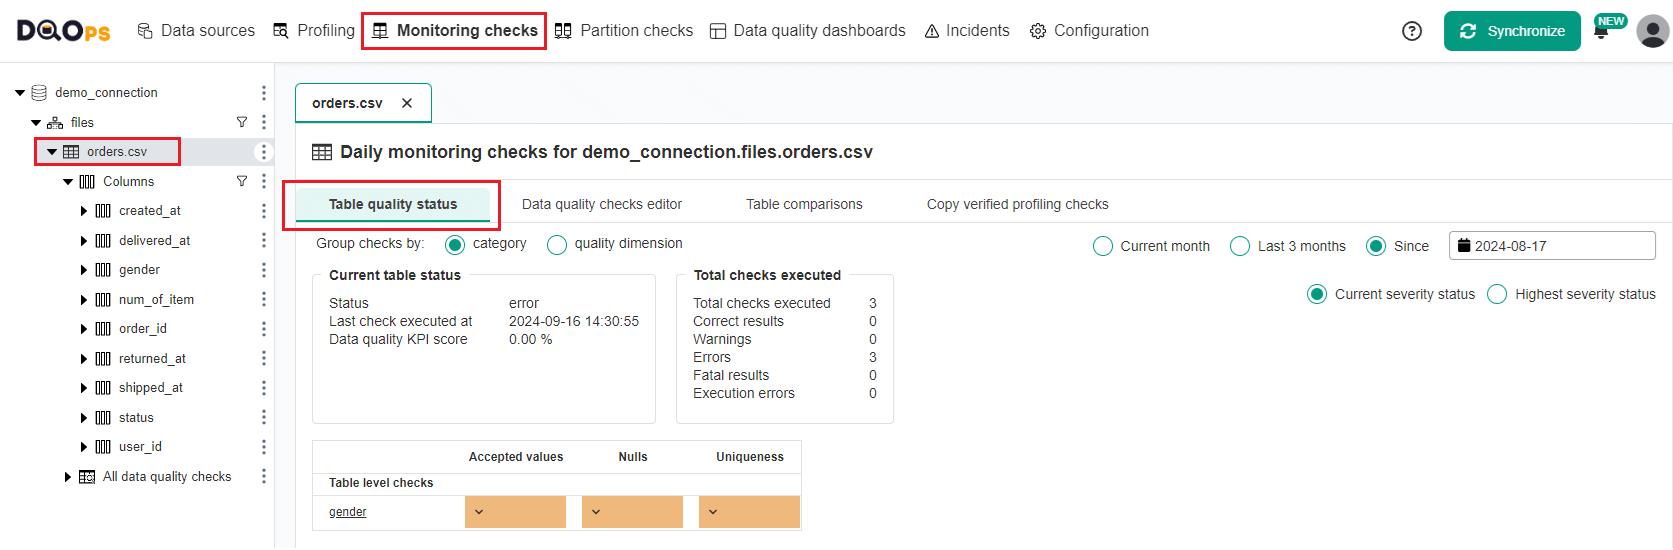
Table quality status allows you to quickly evaluate the data quality status of your table.
To navigate to the Table quality status:
- Click on the Profiling section
- Select the orders.csv table on the tree view on the left.
- Click on the Table quality status tab.
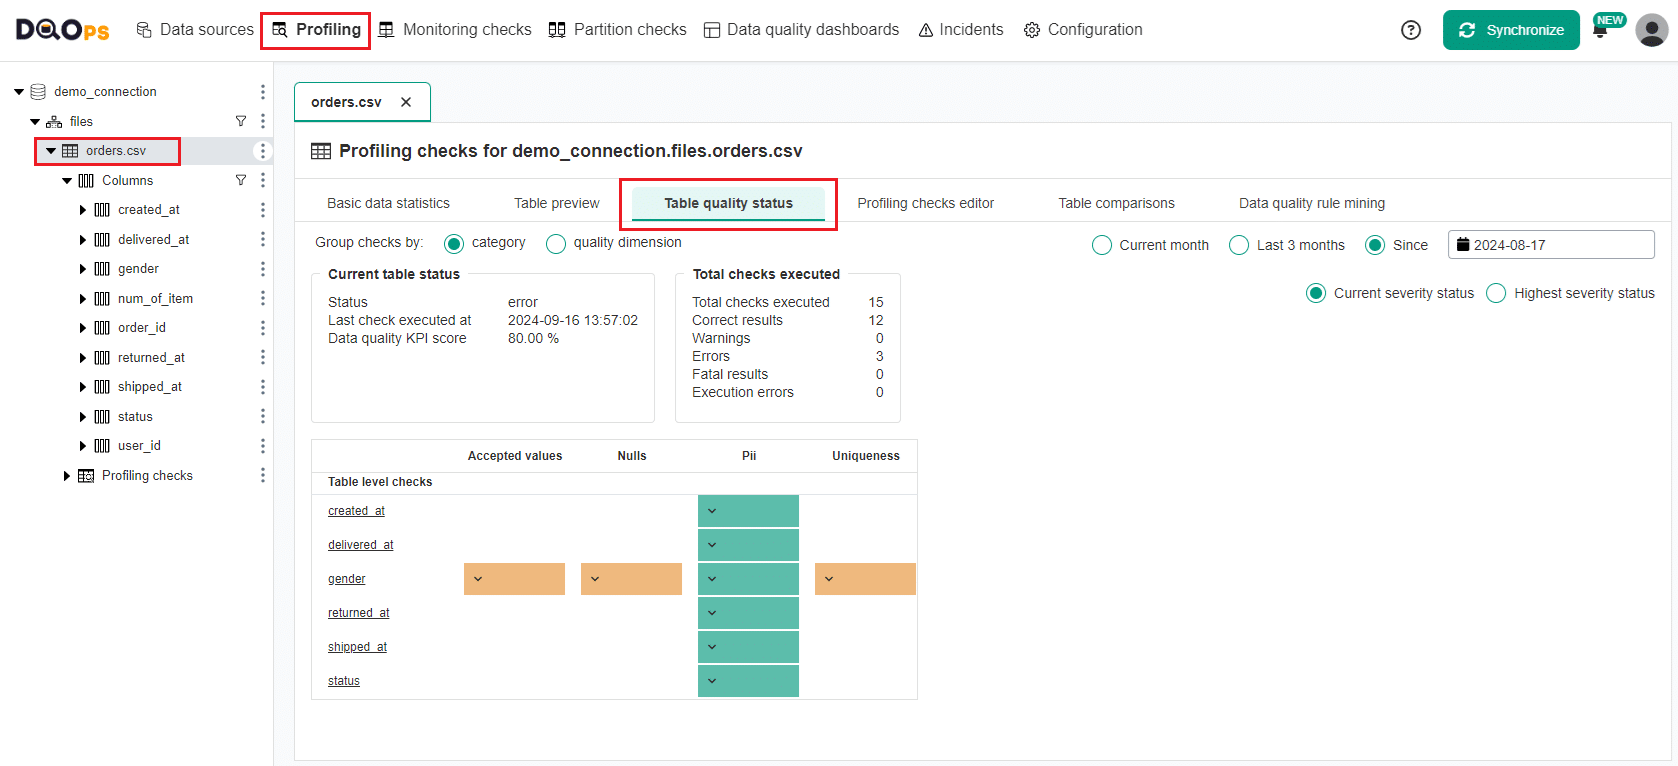
This tab provides an overview of the current data quality status of your table. It includes the number of executed checks and detailed results per table and columns grouped by check categories.
At the bottom of the screen, you will find a table that displays the check results per category, table, and column.
The colored boxes indicate the current or the highest severity status: green for a correct result, yellow for a warning, orange for an error, red for a fatal error, and grey stripes for an execution error.
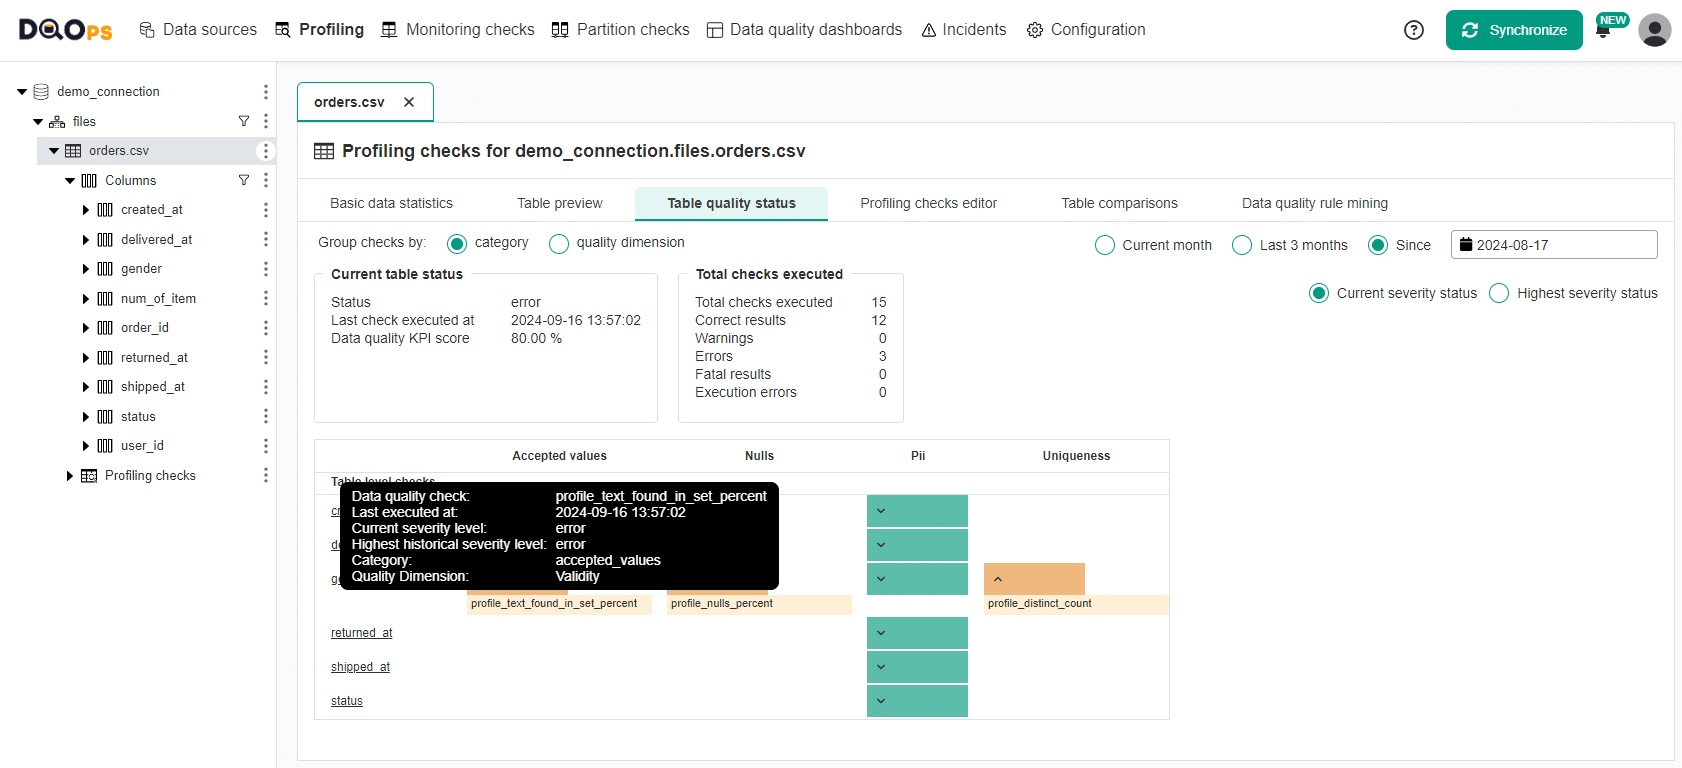
You can click on the colored box to view a list of checks that contribute to the result. Hovering over the check name will provide more details.
In our example, the "gender" column currently has an error severity status, which resulted from the failed checks in the Accepted values, Nulls, and Uniqueness categories.
You can group the results by data quality dimension using the radio button and filter the results by time frame and severity status.
Review check results on the Profiling check editor
We can also review more detailed check results and error samples on the Profiling check editor.
To navigate to the Profiling checks editor, click on the gender column on the tree view on the left and select the Profiling checks editor tab.
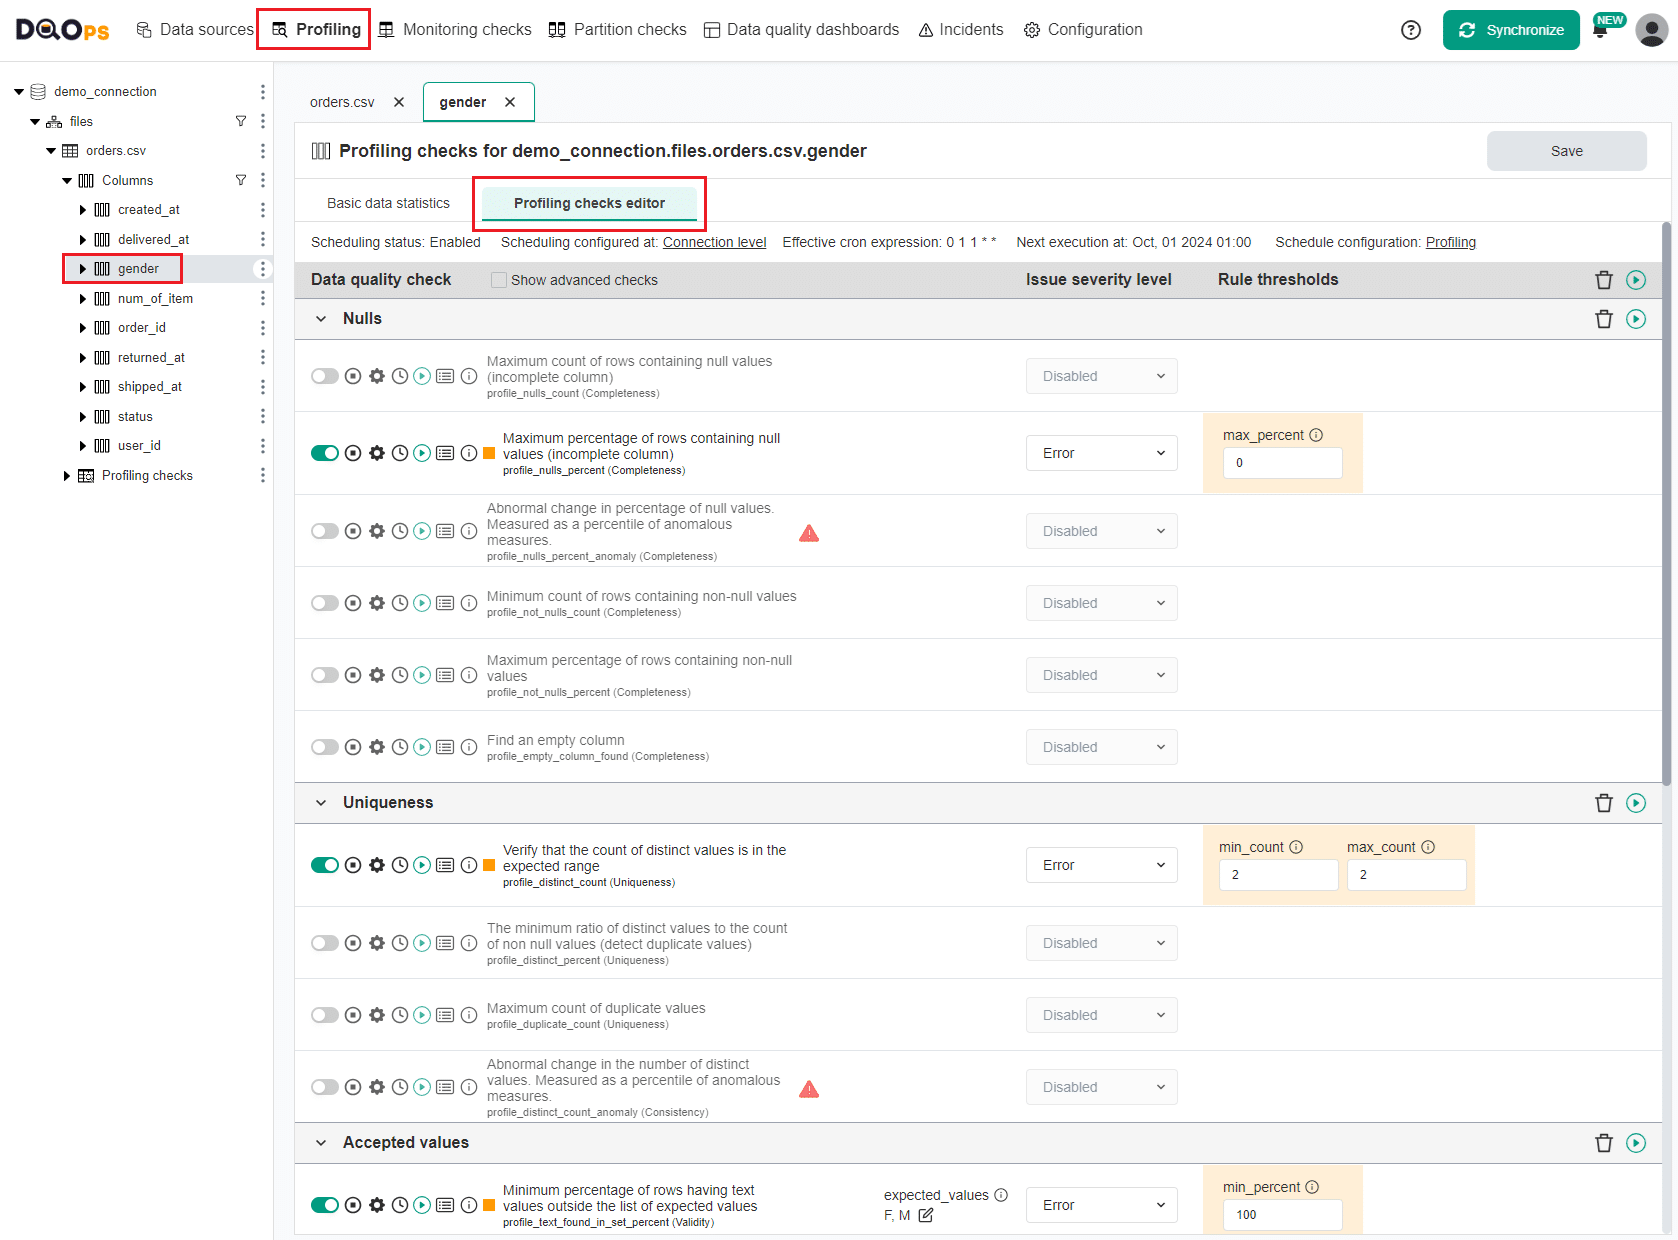
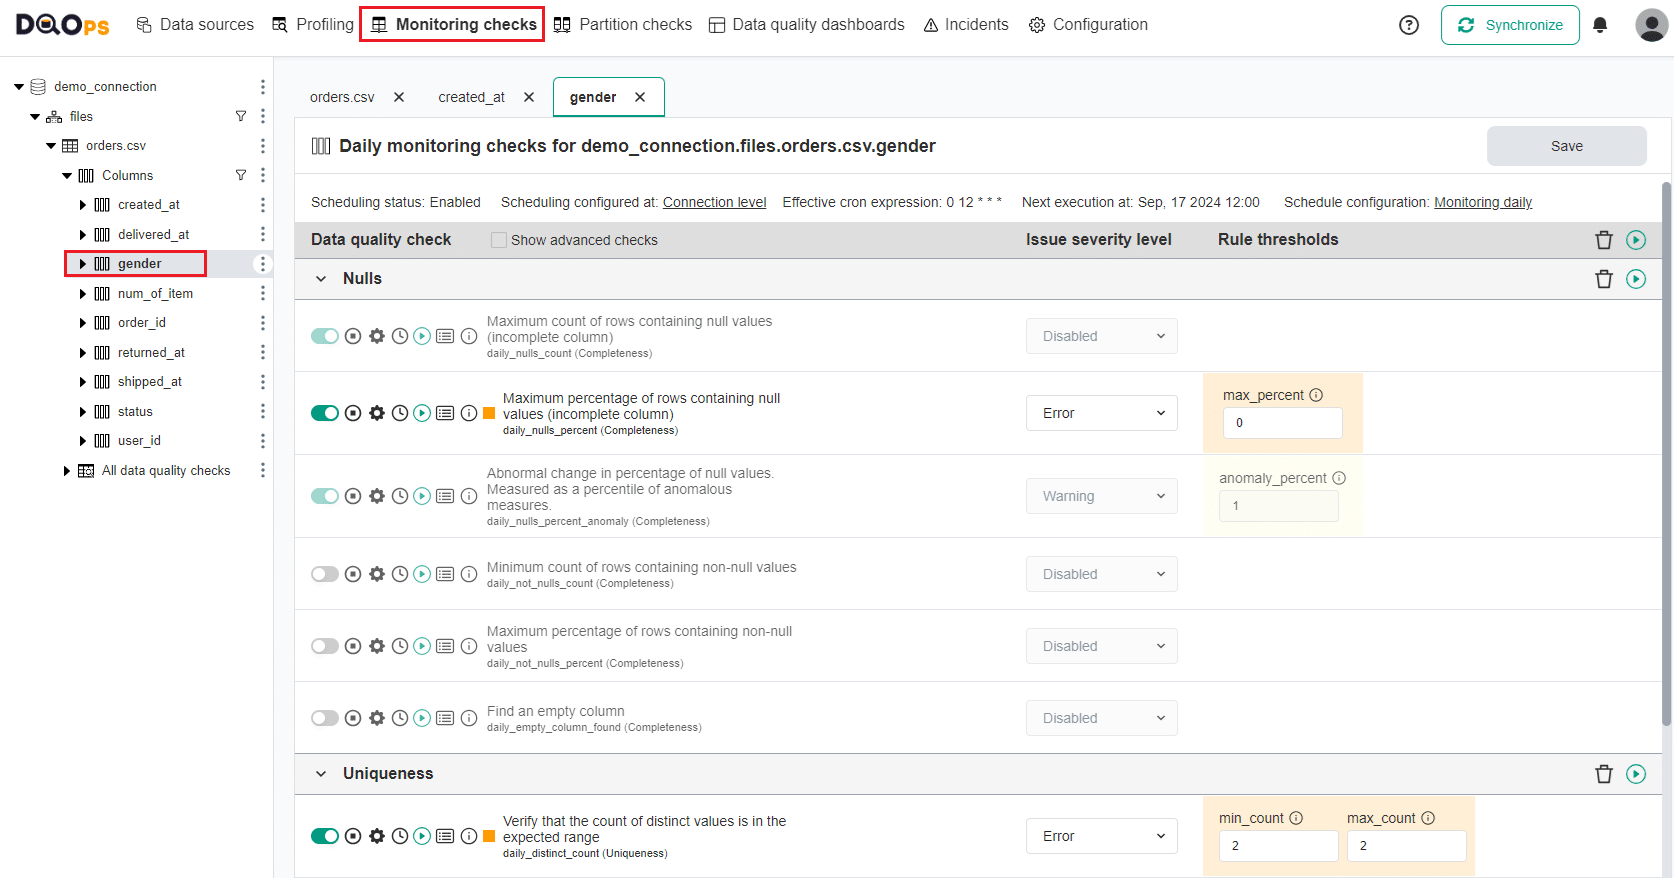
On the Profiling checks editor you can view the list of all table profiling checks. Notice that the toggle button next to the name of the default checks activated upon importing new tables has a light green color. If the check has been activated manually or through the rule miner, the toggle button will have a darker green color.
The icons located before the name of each check allow you to:
- Activate and deactivate it using the toggle button.
- Enable or disable check.
- Configure check settings.
- Get information if the check has activated scheduling.
- Run a check,
- Review results
- View the check description.
For activated checks, notice a square next to the name indicating the results of the check:
- Green for a correct result.
- Yellow for a warning.
- Orange for an error.
- Red for a fatal error.
- Black for execution error.
You can find more information about the check editor in the User interface overview section of the documentation.
To review the checks results, click the Results icon. Let's review the results for the profile_text_found_in_set_percent check in the Accepted values category.
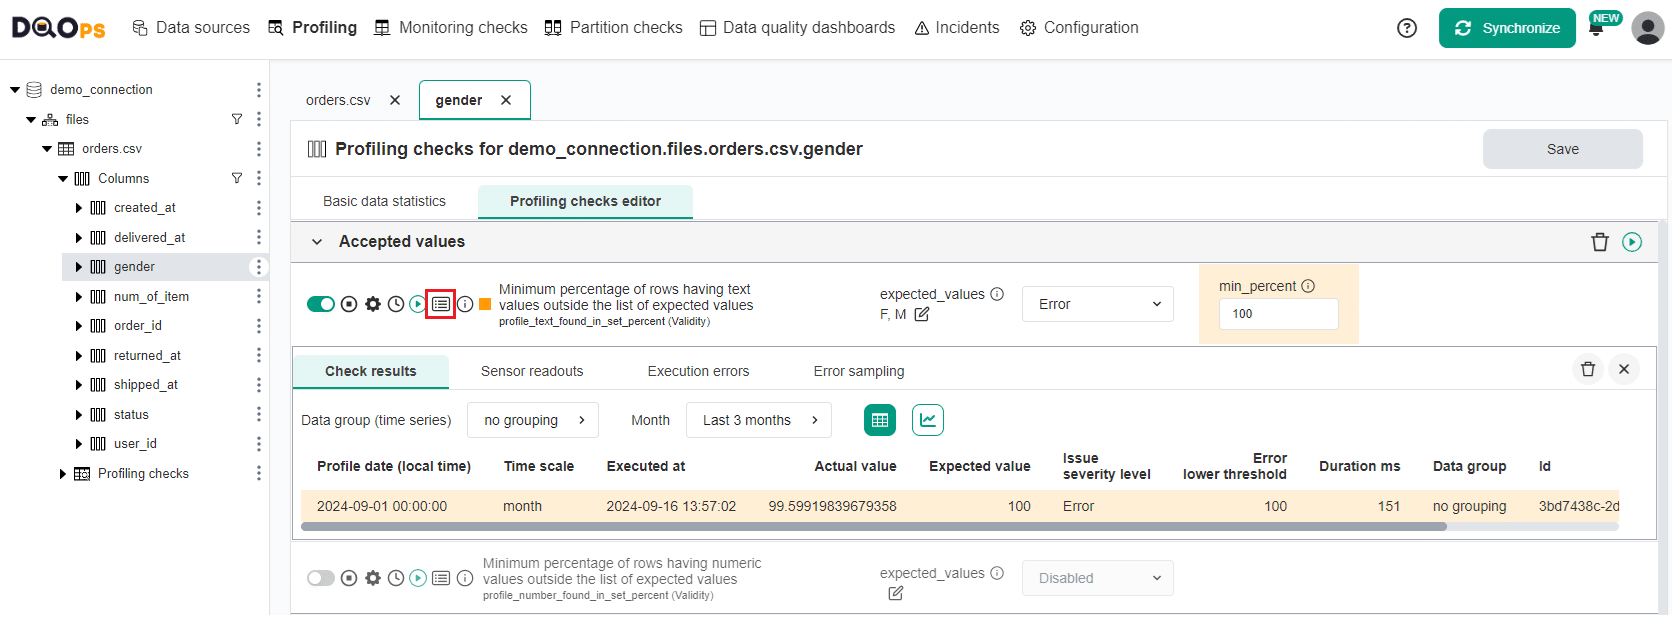
A table will appear with more details about the run check. The check displayed an Error result with the actual value of 99.599%, indicating that not all values in the table are in the expected_values set defined as a check parameter.
Review the profiling checks results error samples
To assist with identifying the root cause of errors and cleaning up the data, DQOps offers error sampling. You can view representative examples of data that do not meet the specified data quality criteria by clicking on the Error sampling tab in the results section.
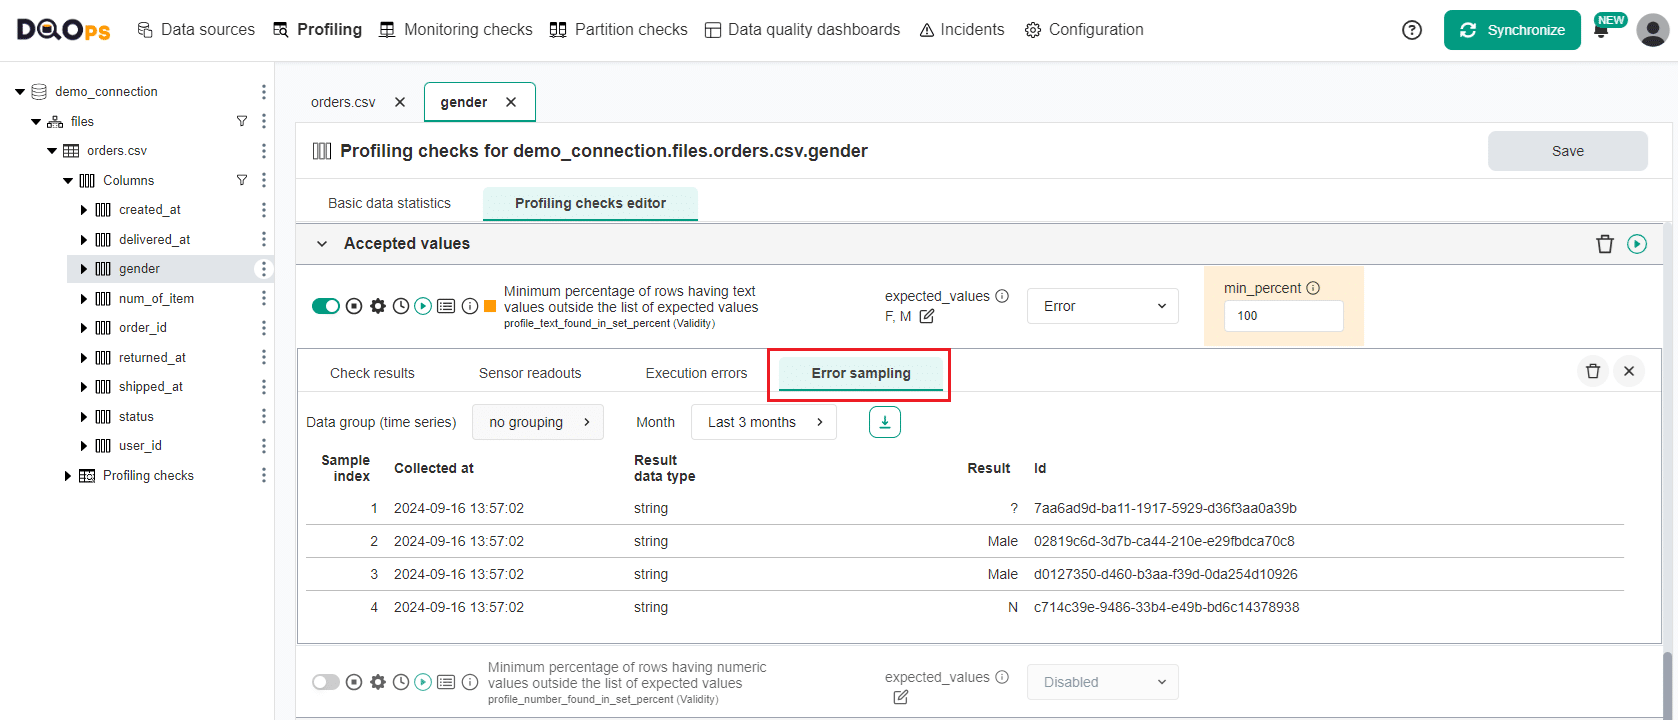
We can see that there are four values that do not match the set defined as a check parameter.
For additional information about error sampling, please refer to the Data Quality Error Sampling documentation. You can check there how to configure ID column that will help in identifying error sample or download error samples as a CSV file.
Copy the verified profiling check to monitoring checks
To start monitoring your data using checks configured in the Profiling sections we can copy the configuration to monitoring checks. Monitoring checks are standard checks that monitor the data quality of a table or column. These checks create a single data quality result for the entire table or column. When run multiple times per day, the daily checks store only the most recent result for each day.
To copy the configuration of checks activated in the Profiling section to Monitoring:
- Navigate to the Monitoring checks section.
- Select the orders.csv table from the tree view on the left.
-
Click on the Copy verified profiling checks tab.
Here you can see a proposition of checks based on checks that have been activated in the Profiling section. To increase the number of propositions, you can either activate more profiling checks manually or use the data quality rule miner in the Profiling section.
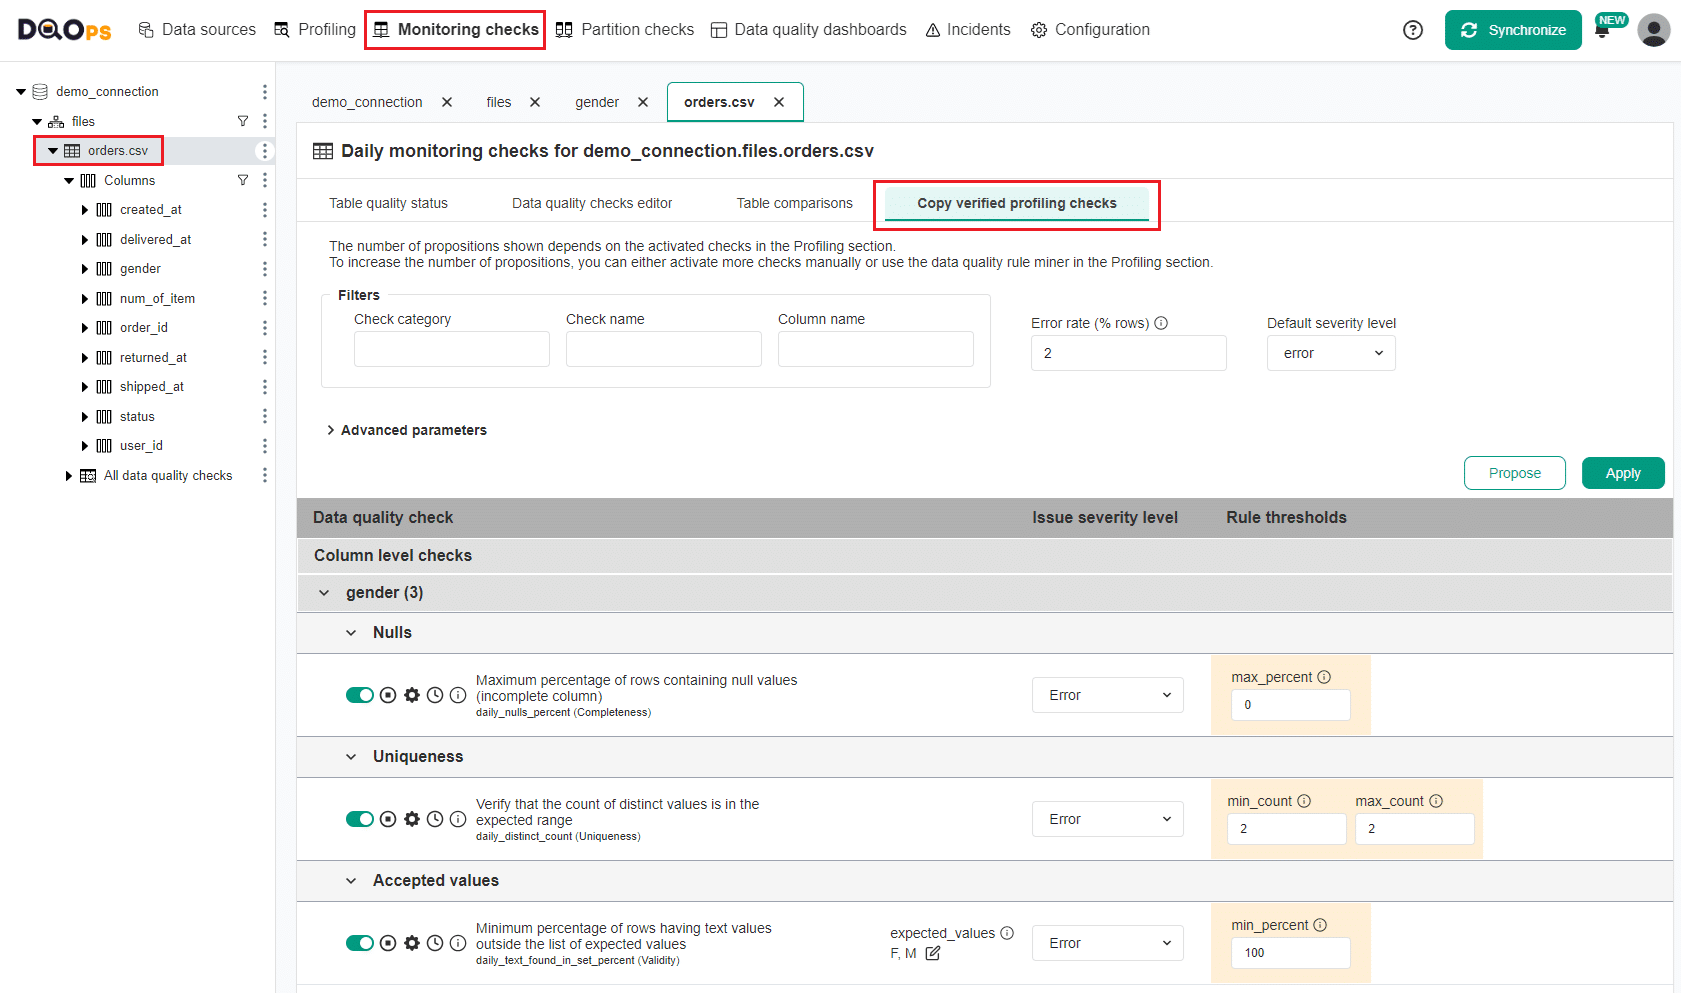
-
Click on the Apply button to activate the proposed monitoring checks.
- A popup window will appear, notifying you that the checks have been activated and that you can run the activated check by clicking on the Confirm button.
- A notification will appear indicating that the job has begun, and the Table quality status tab will start flashing.
Review Monitoring Table quality status
Table quality status allows you to quickly evaluate the data quality status of your table.
To navigate to the Table quality status of the Monitoring checks section:
- Click on Monitoring section
- Select the orders.csv table on the tree view on the left.
- Click on the Table quality status tab
We can see that the gender column currently has an error severity status, which resulted from the failed checks in the Accepted values, Nulls, and Uniqueness categories.
Run monitoring checks
Now let's run some more monitoring checks, which have been automatically activated upon importing the tables.
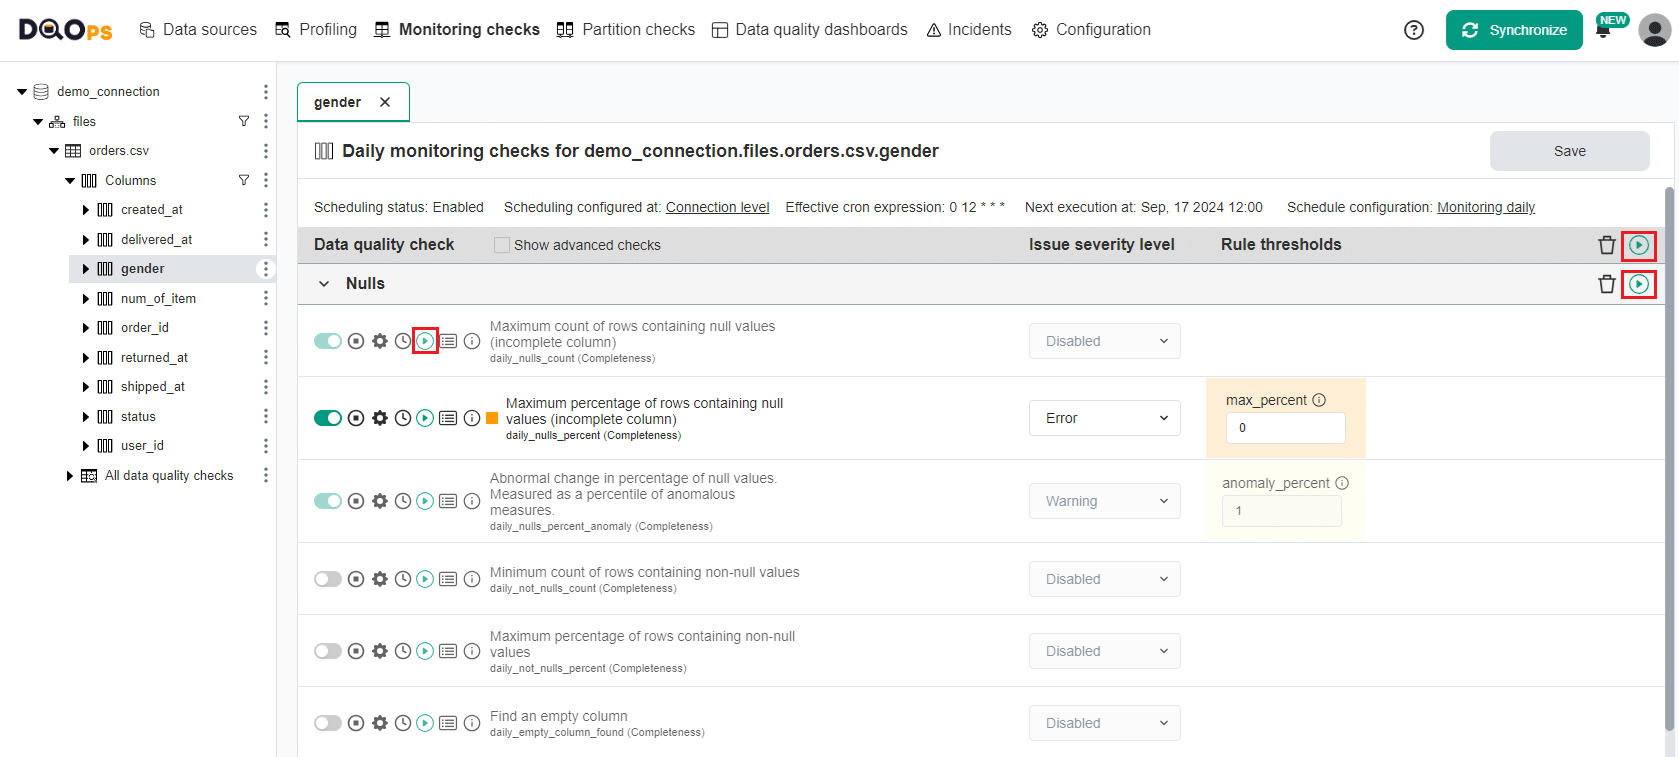
In the Monitoring checks section, select the gender column to open the Data quality check editor.
Notice that the toggle button next to the name of the default checks activated upon importing new tables has a light green color. If the check has been activated manually or through the rule miner, the toggle button will have a darker green color.
To run a single check, click the Run check icon next to its name. To run all activated checks in a category, click the icon on the category row. To run all activated checks in a table or column, click the icon in the top right corner of the Check Editor table.
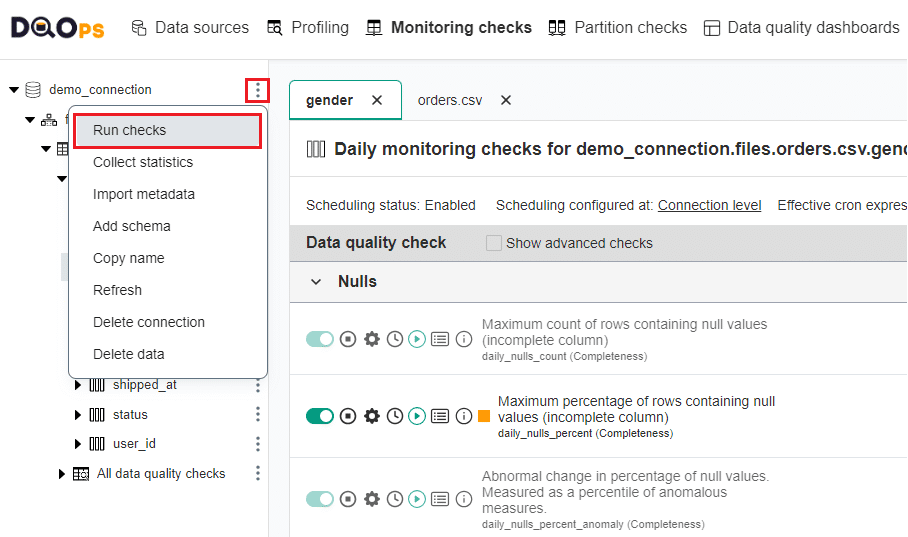
You can also run checks for your entire connection, schema, table, or column from the tree view on the left-hand side of the screen. To do so, click on the three-dot icon and select the Run check option. Check more information on how to Run checks from a tree view.
Let's execute all the monitoring checks activated in the demo_connection by clicking on the three-dot icon and selecting the Run check option. Click on Run checks in the popup.
Now you can check the Table status again or check the details results as before.
View Tables summary
To review the overall health summary of your data, you can use the Tables and Columns summaries. These summaries are based on previously executed monitoring and partition data quality checks, excluding the results from profiling checks.
To access the Tables summary, click on the DQOps logo in the top left corner and select the Data quality summary tab and Tables subtab.
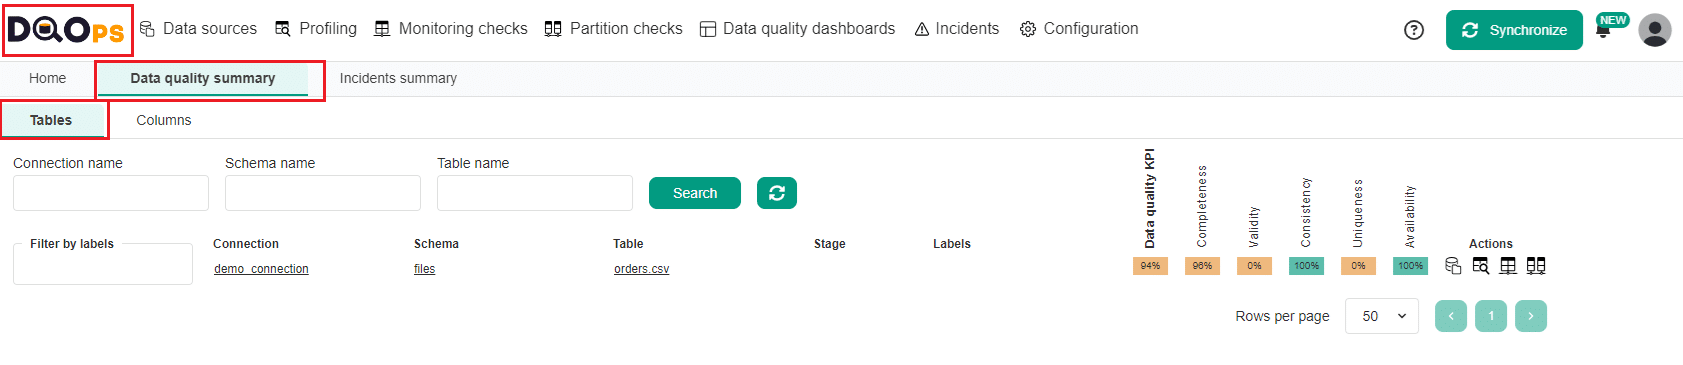
You can view a list of tables with measured total data quality KPI and a breakdown of KPIs calculated from executed checks categorized by specific dimensions (e.g., completeness, validity, consistency). Hovering over the KPIs value will display a tooltip containing more details.
The summary Data quality KPI calculated for the orders.csv table in our example is 94%. You can also check Column summaries by clicking on the Column subtab.
For a deeper dive into Tables and Columns summaries, see the DQOps concepts section.
Data quality incidents
The failure of the data quality check is a data quality issue. To prevent overwhelming the support team with numerous individual data quality issues, DQOps groups similar data quality issues that share the same properties into data quality incident. For more information on incidents, please refer to the Data quality incident management, grouping and notifications section.
View Incidents summary
The Incidents summary provides an overview of all incidents created in DQOps, which are groupings of similar data quality issues. To access the Incidents summary, click on the DQOps logo in the top left corner and select the Incidents summary tab.
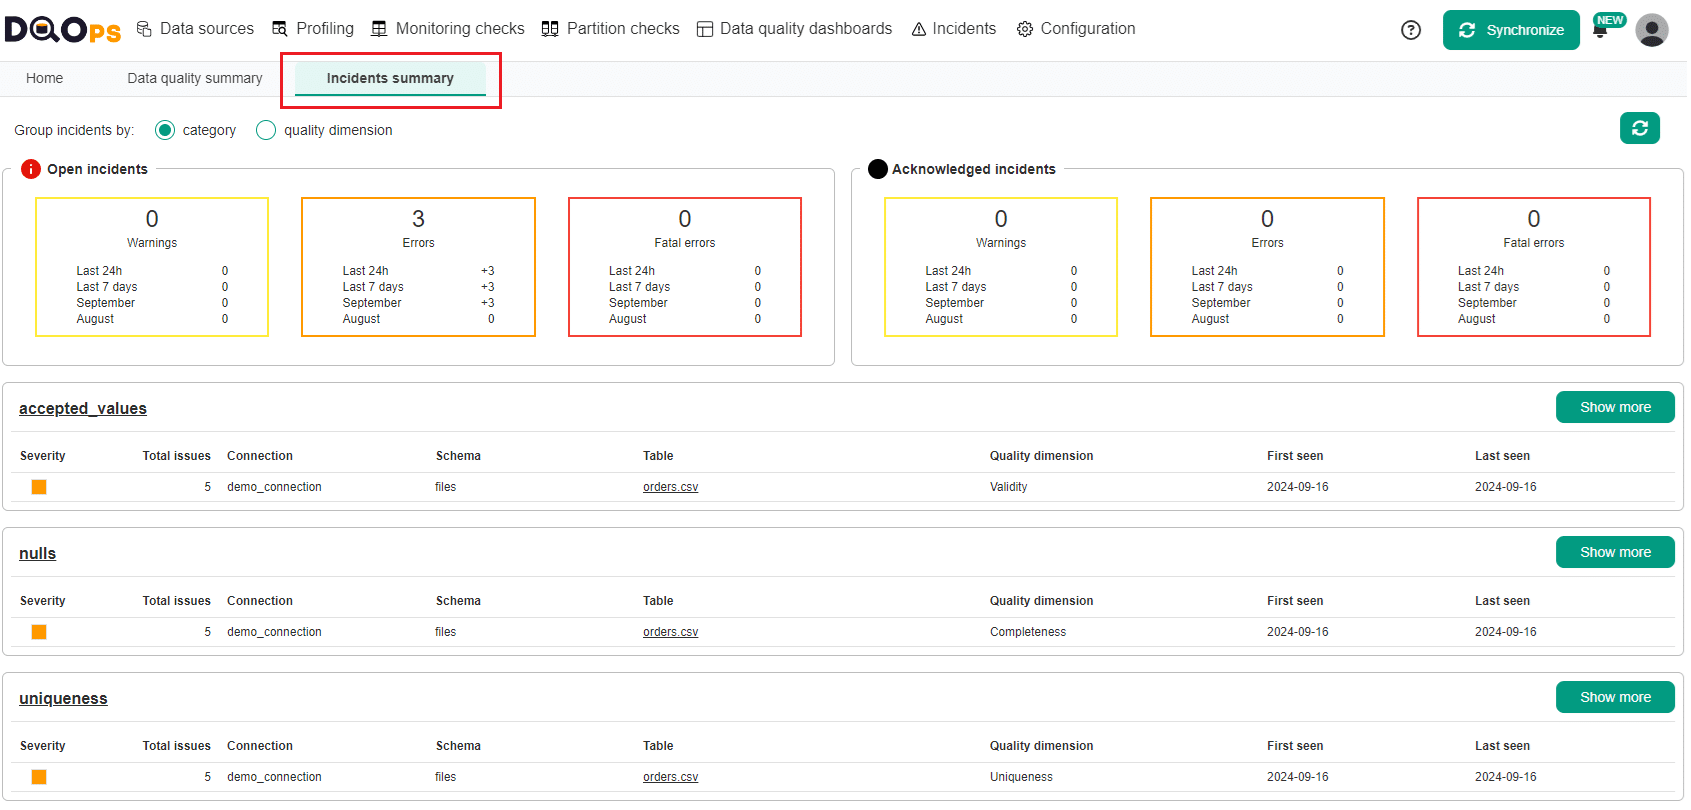
The Incidents summary screen gives an overview of data quality incidents categorized by either check category or data quality dimension. You can easily switch between these groupings using the provided radio buttons.
On the summary screen for Incidents, there are two sections displaying the summaries of Open and Acknowledged incidents. Each section is further divided into three blocks based on severity level: Warnings, Errors, and Fatal errors. Within each block, you will find a summary of new incidents from the last 2 months, along with detailed data showing the number of incidents detected in the last 24 hours, last 7 days, current month, and previous month.
Below the Open and Acknowledged incidents summaries, there is a table listing incidents grouped by the selected check category or the quality dimension, depending on your grouping selection.
The DQOps user interface overview section provides a more detailed description of the Incident summary screen.
View an incident details
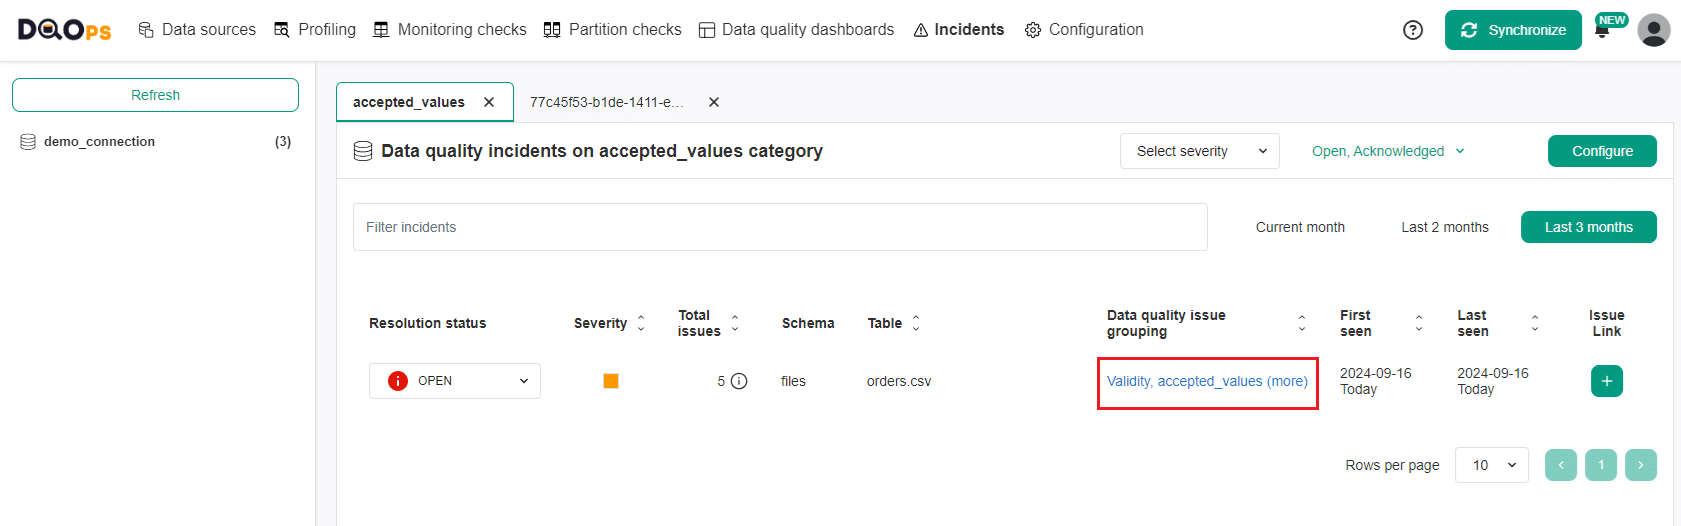
To view and manage incidents that occur during data quality monitoring, navigate to the Incidents section. You can also access the Incidents section by clicking on the check category link or table name on the Incidents summary screen.
Let's open the Incidents section displaying incidents in the Accepted values by clicking on the Accepted values lin.

On the left side of the Incidents section screen, there is a list displaying the connections and the number of incidents that have occurred for each one. On the right panel, you can view incidents for the connections you have selected, and you can filter, sort, and view detailed information about the incidents. You can find more information about managing incidents in the Working with DQOps section.
Click on the Data quality issue grouping column to view more details of the incident.
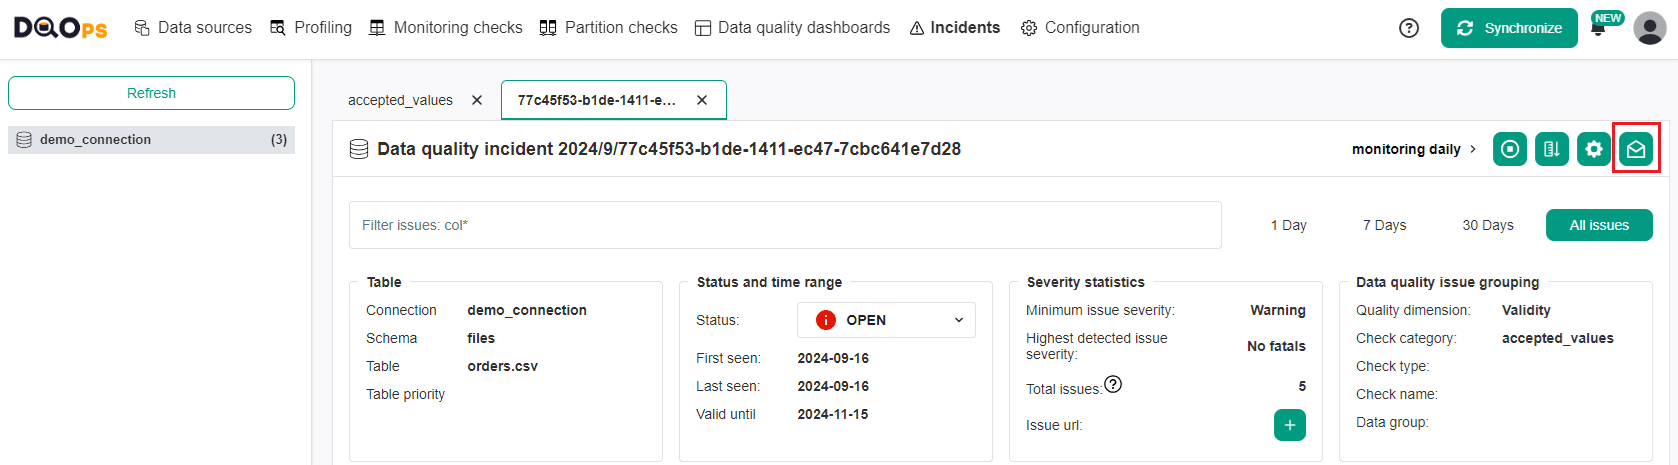
The detailed data quality incident screen shows a list of data quality issues that are grouped in the incident and allows you to filter and sort them.
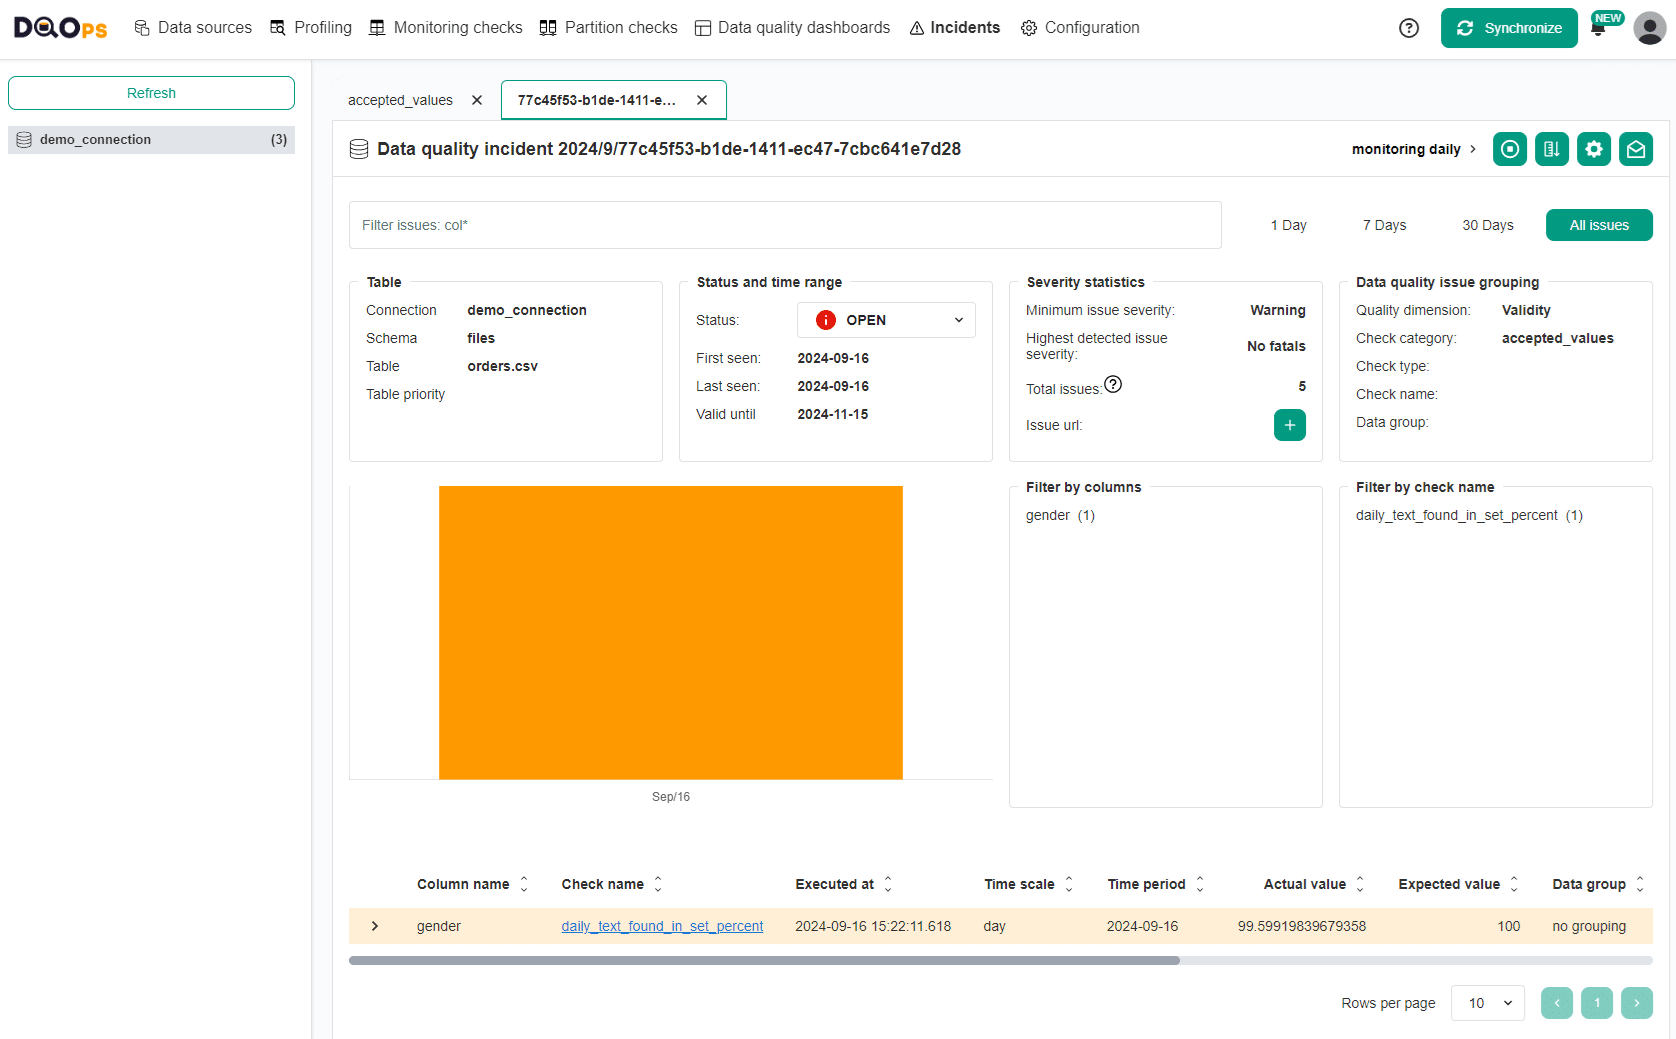
The upper right corner of the Incident details screen provides access to several helpful actions:
- Disable checks for the incident: This button allows you to temporarily disable the check responsible for the incident. Disabling a check can be helpful when you are actively working to resolve the underlying issue.
- Reconfigure rule thresholds: Clicking on this button will decrease the rule threshold for the data quality check that caused the incident by 30% to reduce the number of data quality issues.
- Change incident configuration: This button opens the Incident configuration screen for the table where the incident originated. This allows you to manage incident settings, such as grouping and severity levels.
- Configure notification for this incident: This button allows you to create a new or modify the existing notification filter for this incident.
Follow the link to learn more about the Incidents details screen
Create a notification for the incident
To receive notifications for specific data quality incidents, you can create or edit notification filters. To do this, click on the envelope icon located in the top right corner of the incident details screen.
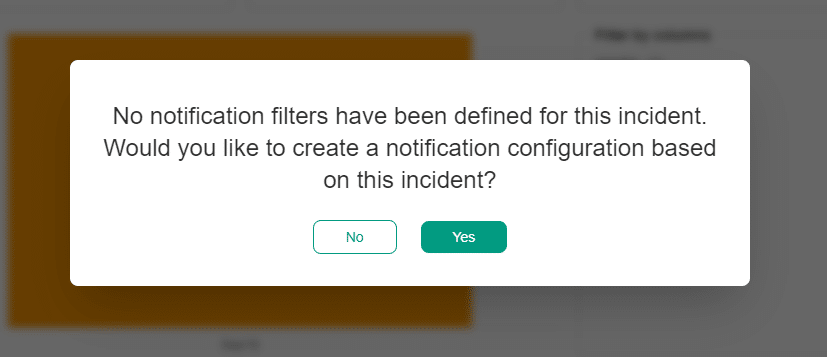
If no notification has ever been configured for the incident, you will see a popup message informing you to create a new notification configuration.
Once approved, you will be redirected to the page to create the new incident notification filter. The configuration form will be partially filled based on the incident's data. The details of the filter configuration can be found in the section Notification filters below.
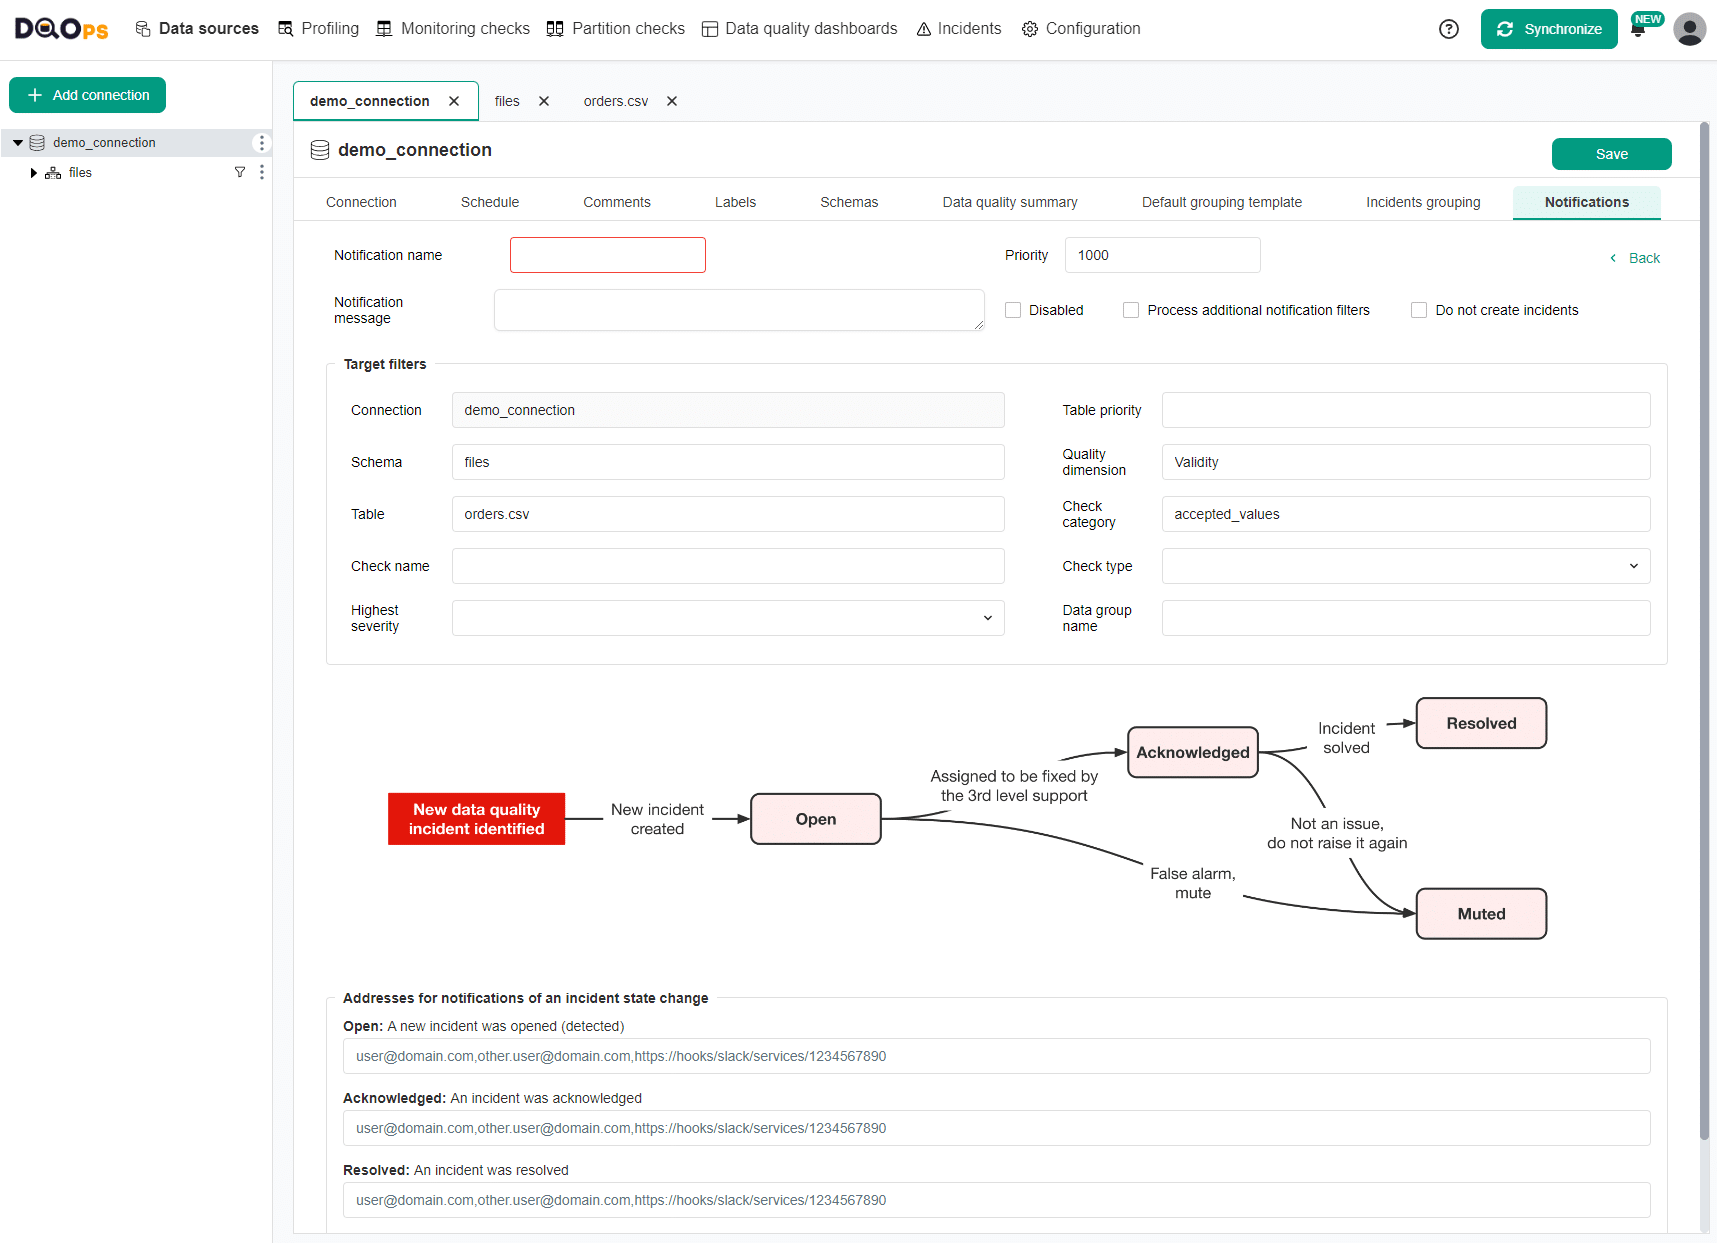
Add a name for the notification and optional message. Modify the target filters and fill in the email address or webhook URL for the appropriate status fields. You can also use multiple email addresses separated by the comma character (,). Mixing email addresses with webhook addresses is also allowed if you use commas between them.
After configuring the notification, click on the Save button to save the changes.
Learn more about the configuration of the notification filtering in the Concept section.
Next step
Now that you have reviewed the initial results from basic statistics, configured checks using rule miner, run monitoring checks, and created incident notification, you can review the results on the dashboards.