Last updated: November 13, 2024
Creating a connection to a data source and profiling data
This guide shows how to connect a data source to DQOps, import the metadata, and start data quality assessment.
Creating a connection to a data source
After installation and starting DQOps, we describe how to import locally stored CSV file using the user interface, initiate automatic monitoring and run basic statistics.
For a full description of how to add a data source connection to other providers or add connection using the DQOps Shell, see Working with DQOps section.
You can find more information about navigating the DQOps user interface here.
How to analyze other data sources
Instead of importing a CSV file, you can follow the manuals for connecting to other data sources and continue this getting started guide from the import metadata using the user interface step.
DQOps supports integration with relational databases, data lakes, cloud data warehouses, object storage services, data processing frameworks, query engines and flat files. You can find the full list of supported datasources here.
Links to some supported data sources are shown below.


Download the sample CSV file
In the example, we will use a sample CSV file named orders.csv. This file contains a fragment of the public dataset of a fictitious ecommerce clothing site TheLook, but feel free to use your own CSV file if you prefer.
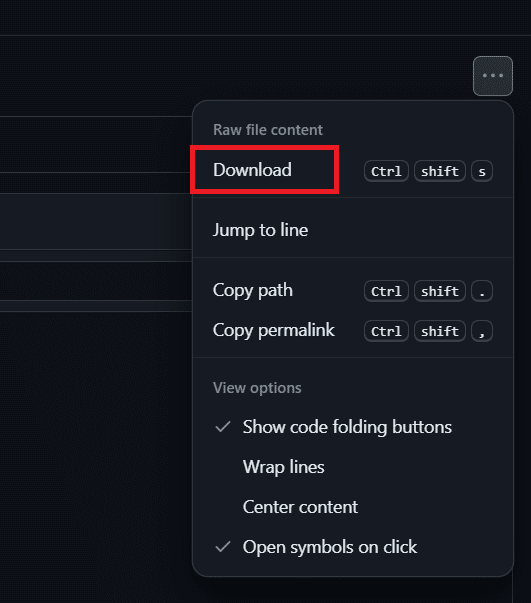
To download the sample CSV file, open the GitHub webpage, click on the three dots button in the upper right corner, and select the Download command.
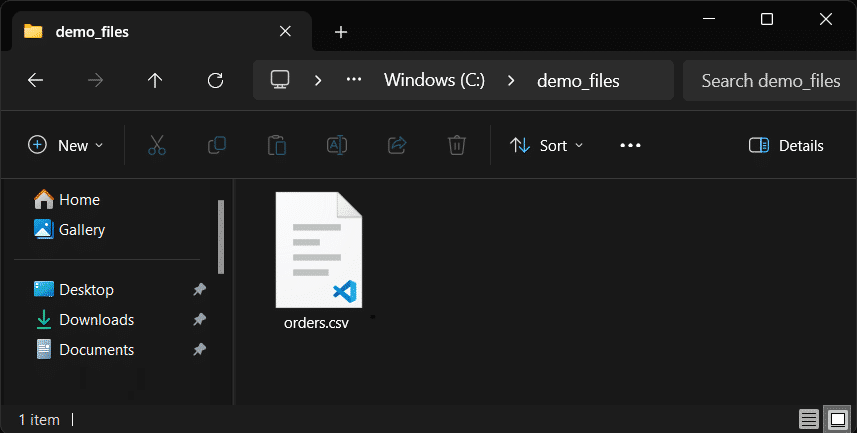
In our example, we have downloaded the file to a folder named demo_files. Remember the absolute path to the file, as we will need it when configuring the connection.
In our example, the path is C:\demo_files\orders.csv
Below is a table that shows a fragment of the data included in the sample CSV file.
| order_id | user_id | status | gender | created_at | returned_at | shipped_at | delivered_at | num_of_item |
|---|---|---|---|---|---|---|---|---|
| 1 | 3 | Shipped | F | 8/12/2019 15:15:00 | 8/15/2019 14:08:00 | 1 | ||
| 2 | 5 | Shipped | M | 1/20/2022 9:17:00 | 1/22/2022 2:25:00 | 1 | ||
| 3 | 6 | Processing | F | 7/23/2022 11:33:00 | 4 | |||
| 4 | 6 | Completed | F | 3/1/2020 11:33:00 | 3/2/2020 15:57:00 | 3/4/2020 16:32:00 | 3 | |
| ... | ... | ... | ... | ... | ... | ... | ... | ... |
Add a connection to a CSV file using the user interface
Navigate to the connection settings
To navigate to the CSV connection settings:
-
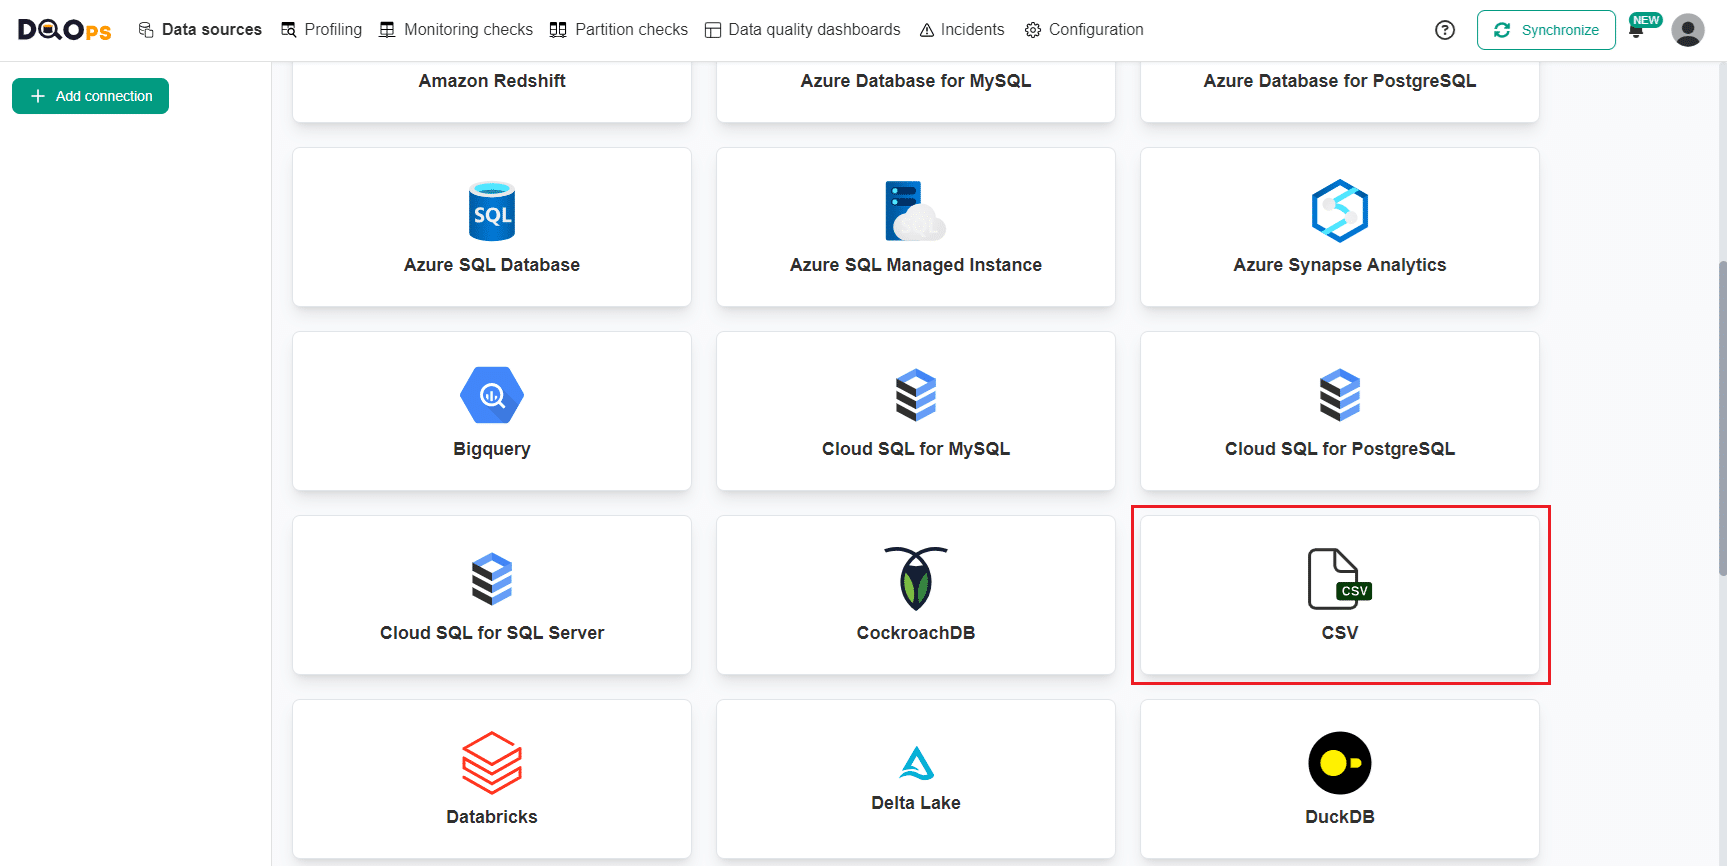
Go to the Data Sources section and click the + Add connection button in the upper left corner.

-
Select CSV connection type.
Fill in the connection settings
After opening the CSV connection settings, fill in the connection details.
If you are importing a CSV file stored locally, you only need to complete the settings described below. For information on other settings and how to import CSV files from AWS S3, refer to the CSV connection documentation."
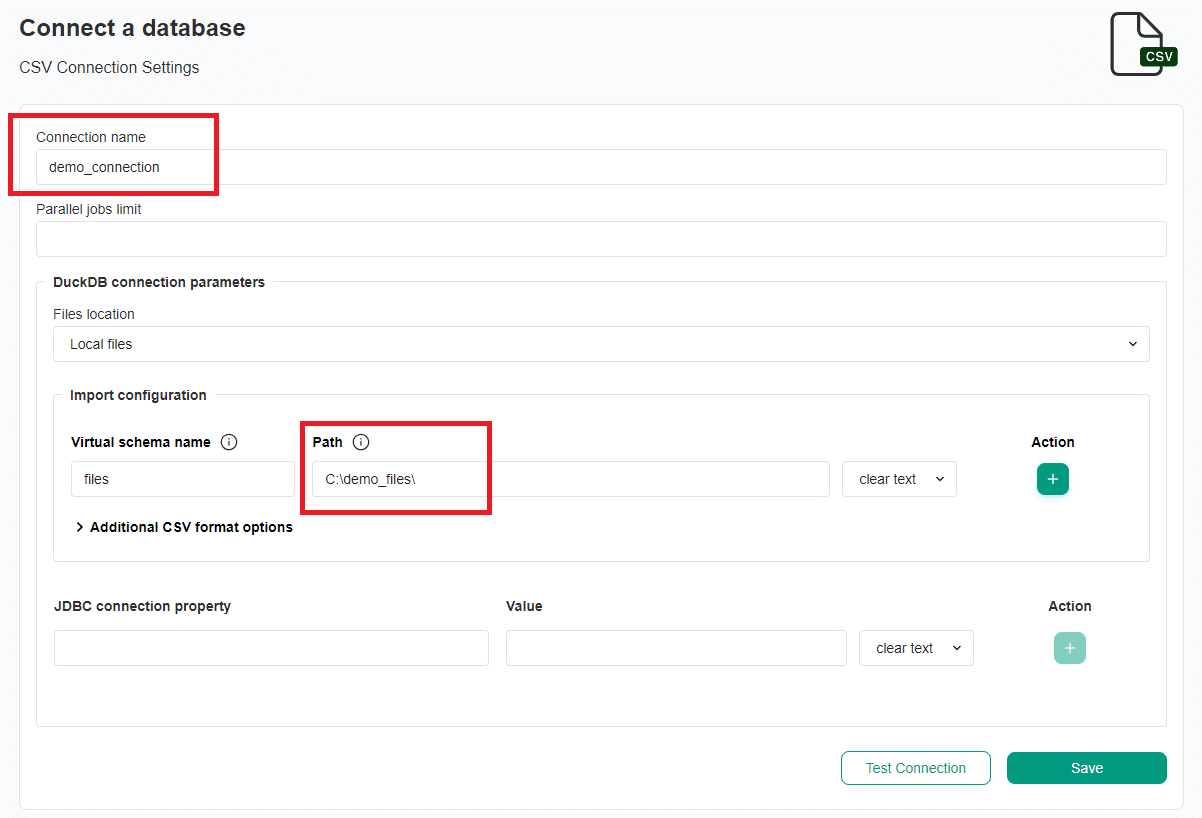
| CSV connection settings | Description |
|---|---|
| Connection name | The name of the connection that will be created in DQOps. This will also be the name of the folder where the connection configuration files are stored. The name of the connection must be unique and consist of alphanumeric characters. |
| Virtual schema name | An alias for the parent directory with data. We leave the default value "files". |
| Path | The path prefix to the parent directory with data. The path must be absolute. |
After entering the connection settings, click on the Test Connection button to test the connection. It will inform you if the path to the CSV file is correct.
If the test is successful, click the Save button to add a new connection. If the test fails, you can review the details to identify the issue.
Import metadata using the user interface
When you add a new connection, it will appear in the tree view on the left. You will then be redirected to the Import metadata screen, where you can import files.
-
Import the "files" schema by clicking the Import tables button.

-
Import the "orders.csv" file by clicking on the Import all tables button in the upper right corner.
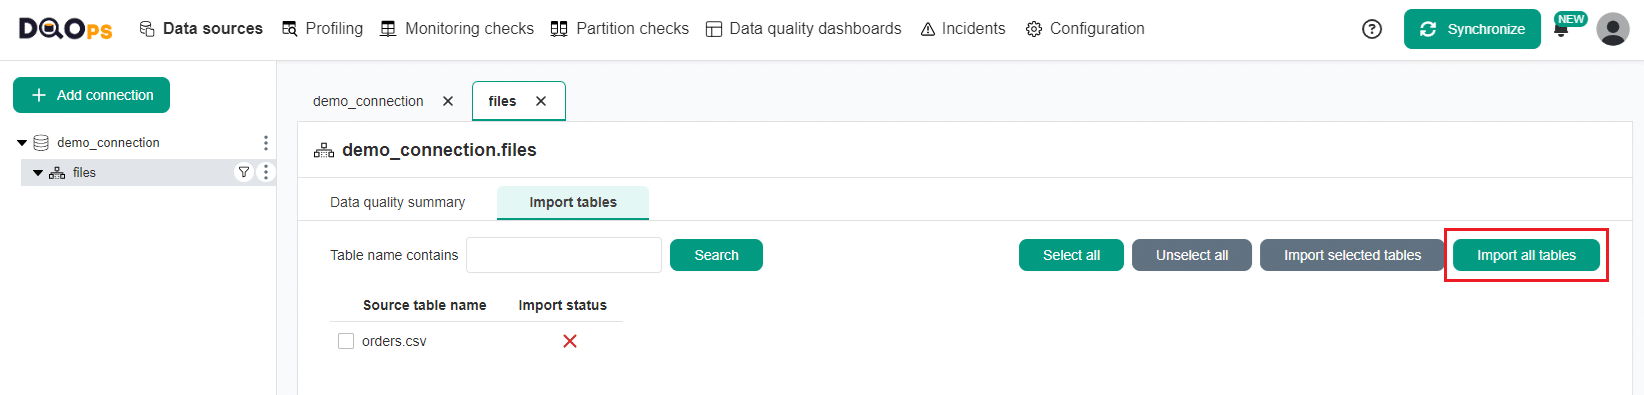
DQOps will create a table from the orders.csv file in the virtual schema "files", which will allow you to profile it and monitor its data quality.
Start data quality assessment
DQOps simplifies the data quality assessment process which is a routine activity for data governance and quality teams.
Upon import, you will receive information that a new tables have been imported. You can then begin collecting basic statistics and profiling data by running default data profiling checks. Simply click on the Start profiling button to initiate this process.

Automatically activated checks
Once new tables are imported, DQOps automatically activates checks defined in data policies These checks detect volume anomalies, data freshness anomalies, empty tables, table availability, schema changes, anomalies in the count of distinct values, and null percent anomalies. By default, the profiling checks are scheduled to run at 12:00 p.m. on the 1st day of every month, and the monitoring checks are scheduled to run daily at 12:00 p.m.
Profiling checks are designed to assess the initial data quality score of a data source. Profiling checks are also useful for exploring and experimenting with various types of checks and determining the most suitable ones for regular data quality monitoring.
Monitoring checks are standard checks that monitor the data quality of a table or column. They can also be referred to as Data Observability checks. These checks capture a single data quality result for the entire table or column.
Default data profiling checks
Below is a list of the data profiling checks automatically activated according to default Table and Column-level data quality policies.
| Target | Check name | Description |
|---|---|---|
| column | profile contains usa phone percent | Detects USA phone numbers inside text columns. |
| column | profile contains email percent | Detects emails inside text columns. |
Default daily monitoring checks
Below is a list of the daily monitoring checks automatically activated according to default Table and Column-level data quality policies.
| Target | Check name | Description |
|---|---|---|
| table | daily row count | Captures the row count of the table every day and identifies empty tables. |
| table | daily row count anomaly | Detects day-to-day anomalies in the table volume. Raises a data quality issue when the increase or decrease in the row count is in the top 1% of most significant changes. |
| table | daily row count change | Detects significant day-to-day changes in the table volume. Raises a data quality issue when the increase or decrease in the row count is greater than 10%. |
| table | daily freshness anomaly | Measures the freshness of the table and detects anomalous (outstanding) delays in data freshness. The table must be properly configured to support timeliness checks. |
| table | daily table availability | Verifies that a table exists, can be accessed, and queried without errors. Detects corrupted tables and expired credentials to data sources. |
| table | daily column count | Retrieves the metadata of the monitored table from the data source and counts the number of columns. |
| table | daily column count changed | Detects whether the number of columns in a table has changed since the last time the check (checkpoint) was run. |
| column | daily nulls count | Counts null values in every column without raising any data quality issues. |
| column | daily nulls percent | Measures the percentage of null values in every column without raising any data quality issues. |
| column | daily nulls percent anomaly | Measures the percentage of null values in every column and detects anomalous changes in the percentage of null value. Raises a data quality issue for the top 1% biggest day-to-day changes. |
| column | daily not nulls count | Verifies that a column contains a minimum number of non-null values |
| column | daily not nulls percent | Measures the percentage of null values in every column without raising any data quality issues. |
| column | daily empty column found | Detects empty columns that contain only null values. |
| column | daily distinct count anomaly | Counts distinct values in every column and detects anomalous changes in the percentage of null value. Raises a data quality issue for the top 1% biggest day-to-day changes of the count of distinct values. |
| column | daily detected datatype in text changed | Scans all values in a text column and detects the data type of all values in a column. Raises a data quality issue when the type of texts changes. For example, when a column contained always numeric values, but a text value was found. |
| column | daily column exists | Reads the metadata of the monitored table and verifies that the column still exists in the data source. |
| column | daily column type changed | Detects if the data type of the column has changed since the last time it was retrieved. |
For more general information about checks, see the DQOps concepts section.
Review scheduling
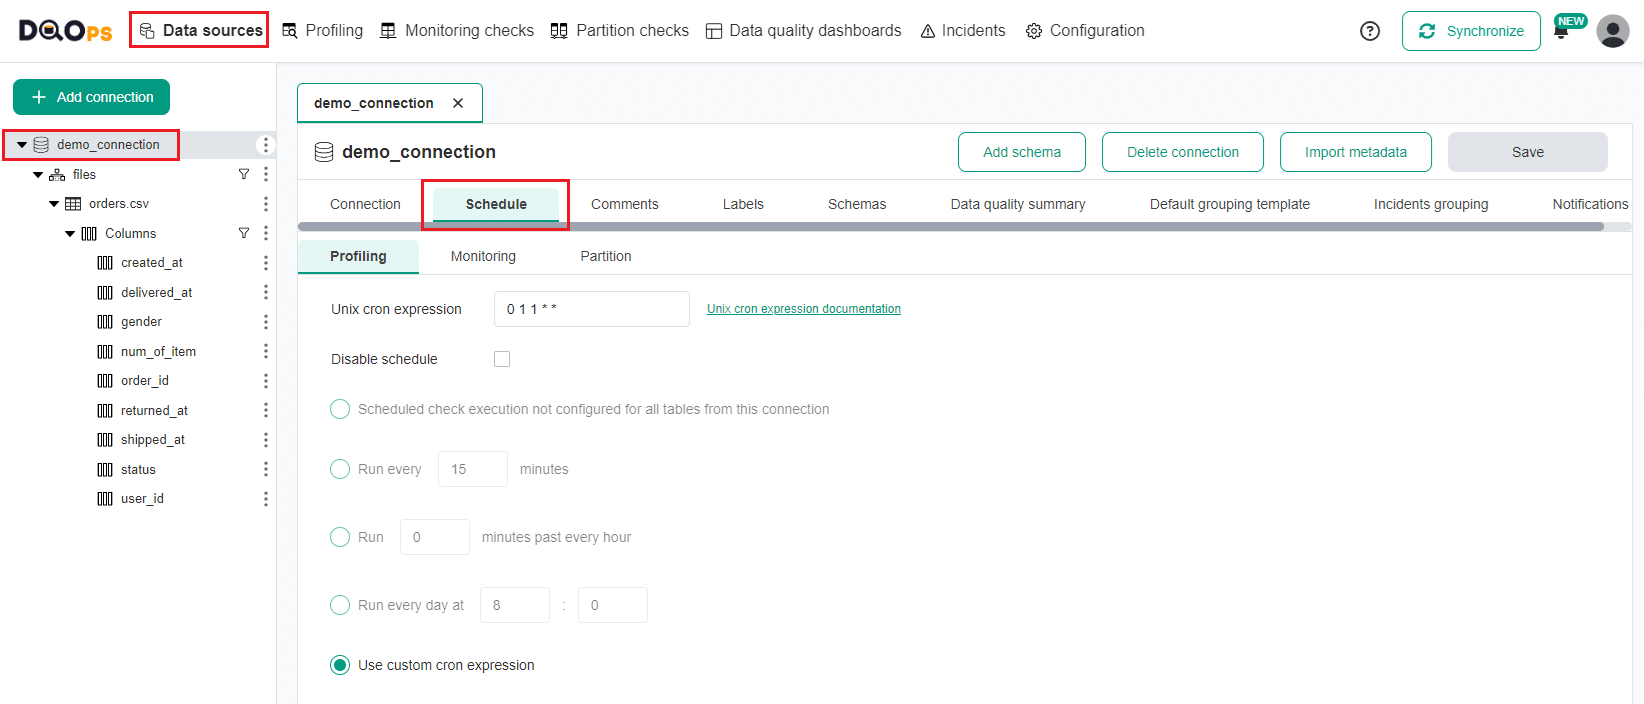
To review scheduling for profiling and daily monitoring checks
- Go to the Data source section.
- Select the connection from the tree view on the left.
- Select the Schedule tab where you can review scheduling settings for the added connection.
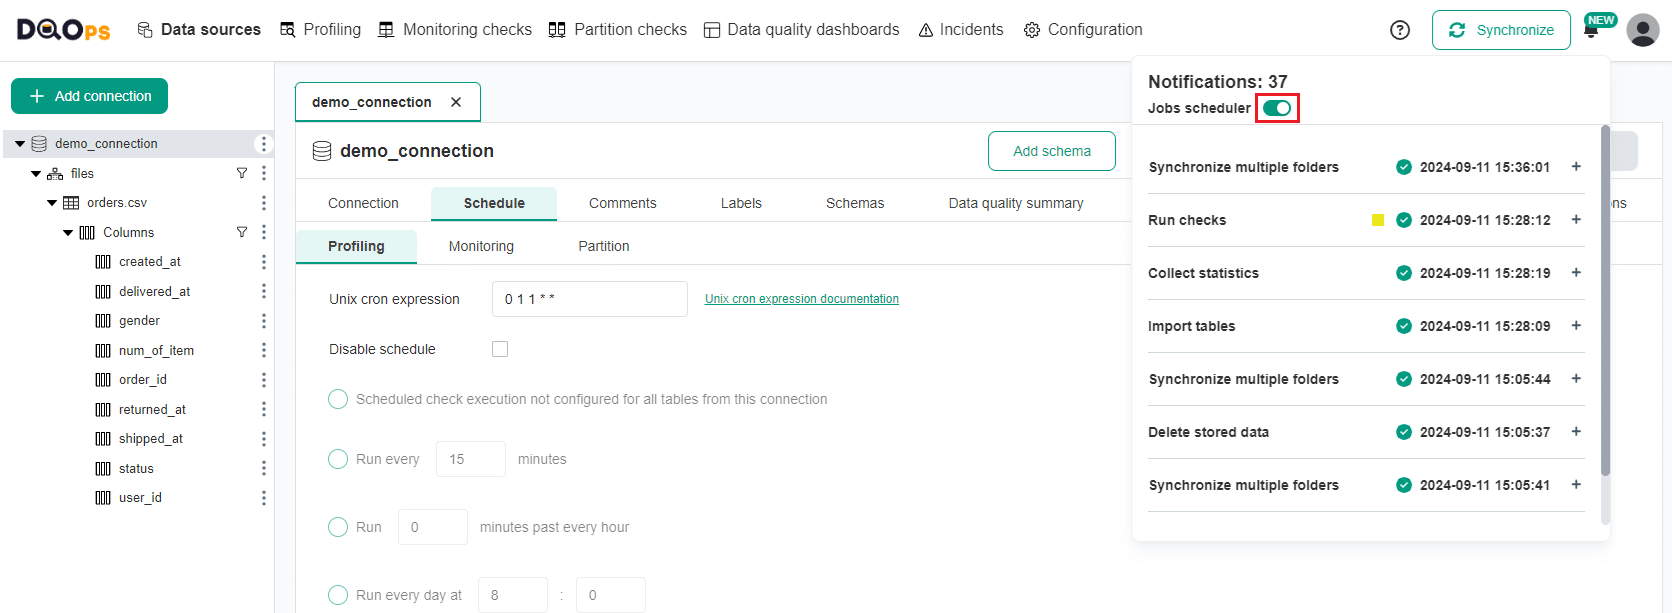
The scheduling is enabled by default. You can turn it off by clicking the Notification icon in the upper right corner and then clicking the Job scheduler toggle button.
Explore the connection-level tabs in the Data sources section
There are several tabs to explore in the Data sources section that differ depending on the selection of the elements in the tree view on the left (connection, schema, table or column): The following tabs are shown at the connection level:
- Connection: Provides details about the connection parameters.
- Schedule: Allows you to configure of the check execution schedule at the connection level.
- Comments: Allows adding comments to your connection.
- Labels: Allows adding labels to your connection.
- Schemas: Allow importing schemas and tables.
- Data quality summary: Displays summaries of the data quality status. You have the option to choose one of two subtabs:
- Tables: This subtab provides a summary of the data quality status for tables in this connection.
- Columns: This subtab provides a summary of the data quality status for columns in this connection.
- Default grouping template: Allows setting up data grouping globally at the data source level. Learn how to configure data grouping.
- Incident grouping: Allows configuring incidents grouping level. Learn more about incidents that let you keep track of the issues that arise during data quality monitoring.
- Notifications: Allows configuring incidents and Webhooks for notifications. Learn how to configure notifications whenever a new incident is created or modified.
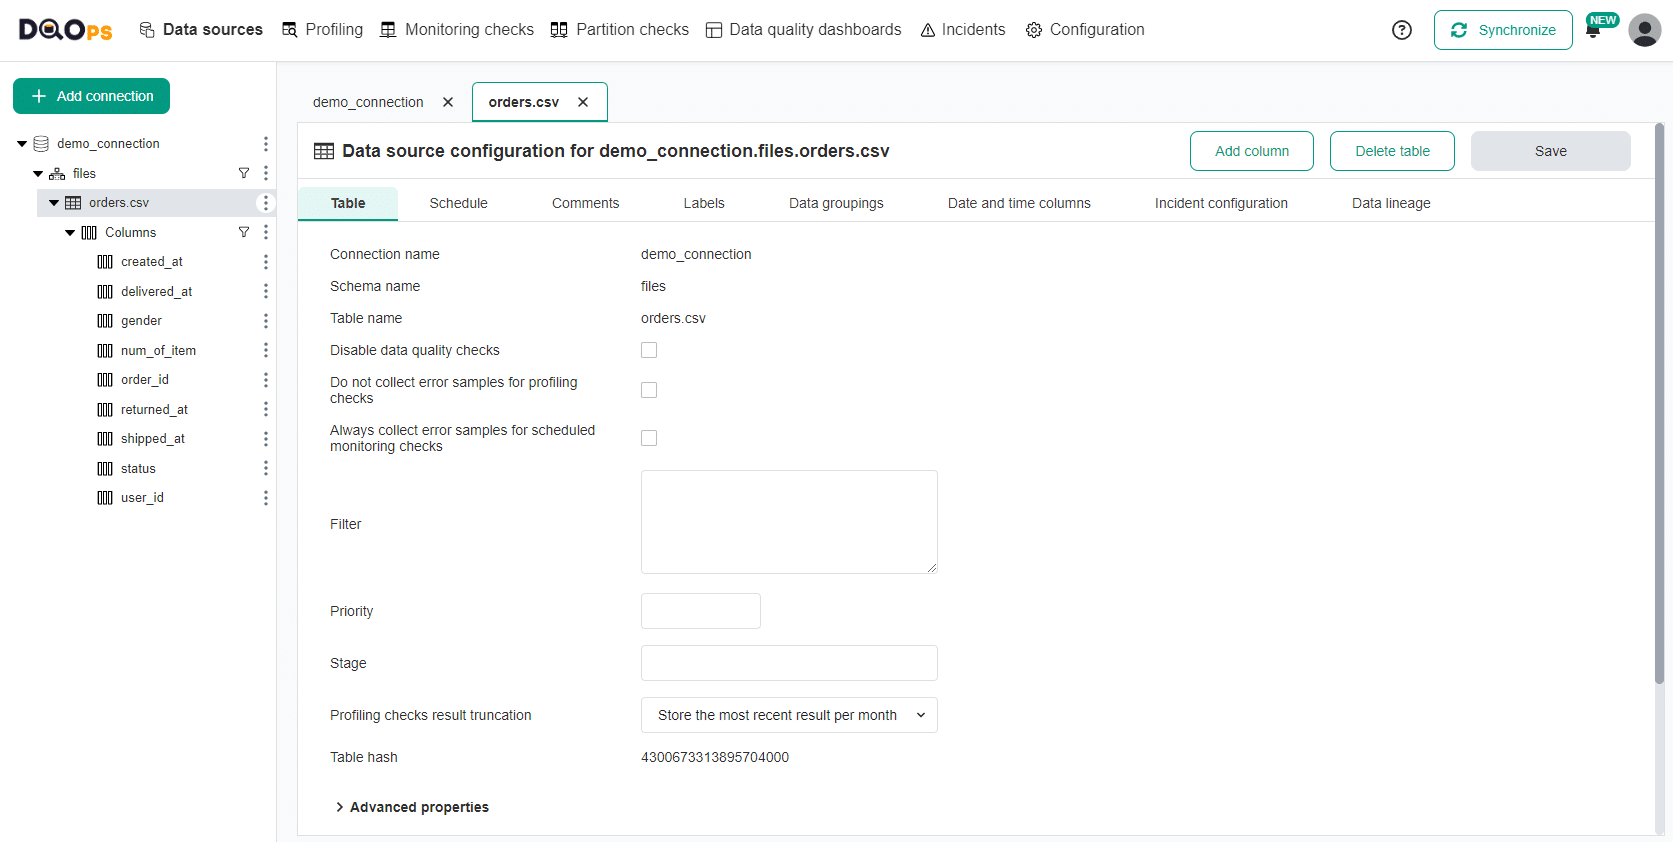
Explore the table-level tabs in the Data sources section
At the table level in the Data sources section, there are the following tabs:
- Table: Provides details about the table and allows you to add filter, priority or stage name (for example, "Ingestion").
- Schedule: Allows setting schedule for running checks. Learn how to configure schedules.
- Comments: Allows adding comments to your tables.
- Labels: Allows adding labels to your tables.
- Data groupings: Allows setting up data grouping at the table level. Learn how to configure data grouping.
- Date and time columns: Allows configuring event and ingestion timestamp columns for timeliness checks, as well as date or datetime column for partition checks.
- Incident configuration: Allows configuring incidents. Learn more about incidents that let you keep track of the issues that arise during data quality monitoring.
Next step
Now that you have connected a data source and initiated data assessment, it is time to review the results, automatically configure data quality checks to detect the most common data quality issues and create an incident notification.