Last updated: July 21, 2025
How to Measure Data Quality KPI Metrics - Definition and Examples
Learn how to measure the data quality KPI metrics, what is the formula used to calculate the score, and how to improve quality by tracking KPIs on dashboards.
Purpose of data quality KPIs
The purpose of data quality KPIs (Key Performance Indicators) is to measure data quality by calculating a reliable data quality score. The score will be used to assess the health and quality of data sources. It can be also used to verify compliance with data quality requirements agreed in a data contract between a data producer and a data consumer.
We can divide the data quality KPIs into business-focused and data engineering-focused.
- The data quality KPIs for business help monitor data quality to prove the trustworthiness of data.
- The data quality KPIs for data engineering monitor the problems with the data pipelines, allowing the data engineering teams to improve the data platform.
The data quality metrics should also be calculated at a physical level, measuring the KPI of each
- data source,
- database schema,
- table,
- column.
In addition to monitoring physical entities such as tables, the data quality KPI metrics should also be calculated at logical levels, such as
- data domain in a data mesh architecture,
- data producer,
- external vendor that is providing data as part of their service contract,
- data contract.
DQOps calculates the data quality KPI metric as a value between 0% and 100%, which is the percentage of passed data quality checks. A percentage KPI is the easiest way to share between all stakeholders, including the data teams, data stewards, data owners, data producers, and data consumers.
Besides calculating the data quality KPI for each physical and logical group of data, the KPI must also support identifying the type of data quality issue. For that purpose, all data quality check results are attributed to the name of a data quality dimension, allowing the identification of the type of problem.
Data quality score formula
DQOps calculates data quality KPIs as a percentage of passed data quality checks out of all executed checks. The data quality KPI is represented as a percentage value. The following formula calculates the score.

The result of measuring the data quality KPI for two data quality checks, daily_nulls_percent and daily_duplicate_percent on 5 columns over a 10-day period is shown below.

Passed data quality checks are shown as green boxes. Data quality issues that decrease the data quality KPI are shown as orange (error severity issue) and red (fatal severity issue) boxes.
Issue severity levels
DQOps supports configuring data quality rules at three severity levels:
-
warning severity issues are dedicated to anomalies and less severe data quality issues for which the data producer (the data owner) should not be accountable because those types of issues are expected. The warning severity issues are calculated as passed data quality checks, not decreasing the data quality KPI.
-
error severity issues are dedicated to data quality issues that should be resolved over time. They are counted as failed data quality checks in the data quality KPI, decreasing the final score.
-
fatal severity issues are dedicated to very severe data quality issues that should be detected inside the data pipelines.When a fatal issue is detected, the data pipeline should be stopped to prevent the data quality issues from spreading into the downstream tables. Similar to error severity issues, fatal severity issues are also counted as failed data quality checks, decreasing the data quality KPI.
The effect of warning severity issues on the data quality KPI formula used in DQOps is shown below.

The reason for treating warning severity data quality issues as passed data quality checks is due to the nature of warnings. Warnings should be raised only for anomalies or data quality issues that are expected occasionally, and will be reviewed when they are detected. Warnings should also be raised for data quality issues that are outside the agreed data contact between the data producer and the data consumer.
The updated data quality KPI formula is shown below. The number of valid data quality results plus the number of warnings is divided by the total number of data quality results, including both passed data quality checks and errors.

Excluding data checks from KPI
The data quality issues can be divided into two groups.
-
Data quality issues that the data producer should be accountable for should be included in the KPI score.
-
Random data quality issues that are occasionally expected, or the data producer is not able to fix them because the data is received from an external source. For example, the data engineering team that has set up the data pipeline to load data received from a CRM platform is responsible for loading the data correctly but cannot be held accountable for missing data (completeness issues), when the sales team did not enter the data.
Data quality checks are excluded from KPI calculation in the check's settings section in DQOps, as shown below.
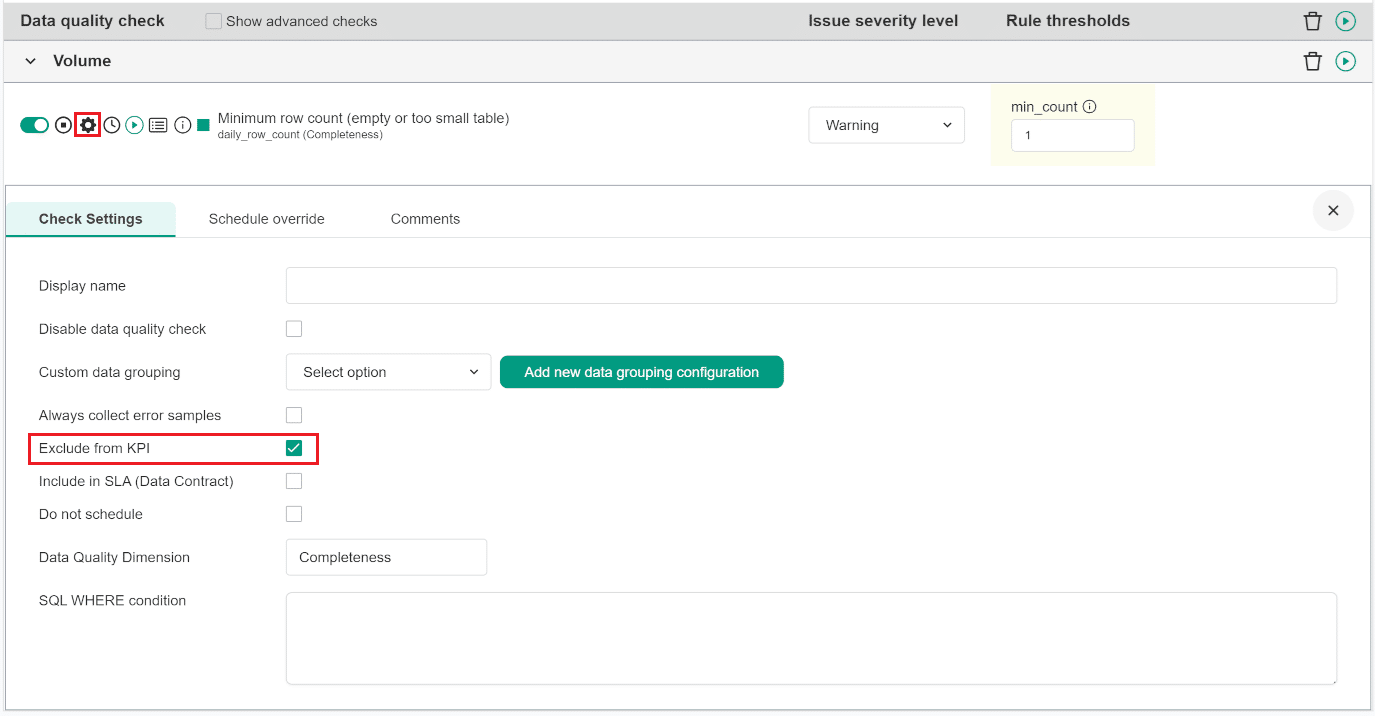
The configuration is stored in the exclude_from_kpi field in the YAML file, as shown below.
- To exclude the check from the KPI score, set the value to true. The default value of this field is false.
Improving data quality with KPIs
Sharing KPIs with stakeholders
Measuring and increasing data quality KPIs is the most reliable way to run a data cleansing project. The biggest challenge that each data team faces when introducing data quality practices is gaining support from upper management. Management expects to see progress and proof of success. Sharing the data quality KPI with upper management is the best way to secure financing for data projects.
Reaching 100% data quality KPI score

The DQOps team has written an eBook "A step-by-step guide to improve data quality" which describes their experience in data cleansing and data quality monitoring using DQOps.
The eBook describes a full data quality improvement process that allows to reach ~100% data quality KPI score within 6-12 months.
The process described below is a simplified version of the whole process described in the eBook.
Data quality improvement process
An agile data cleansing project that is driven by data quality KPIs is shown below.
graph LR
  classDef step fill:#A9DBD4;

  I(Identify high<br/> priority tables):::step  --> S;
  S(Collect<br/> basic statistics):::step  --> A;
  A(Activate profiling checks<br/> using rule mining):::step  --> P;
  P(Review profiling<br/> issues):::step  --> M;
  M(Activate <strong>monitoring</strong><br/> and <strong>partition</strong> checks):::step  --> O;
  O(Observe KPIs<br/> and issues):::step  --> |KPI decreased| R;
  R(Review issues):::step  --> |Root cause<br/> identified| F;
  F(Fix data<br/> or recalibrate checks):::step  --> |Continue observing| O;
The main steps are described in the following sections.
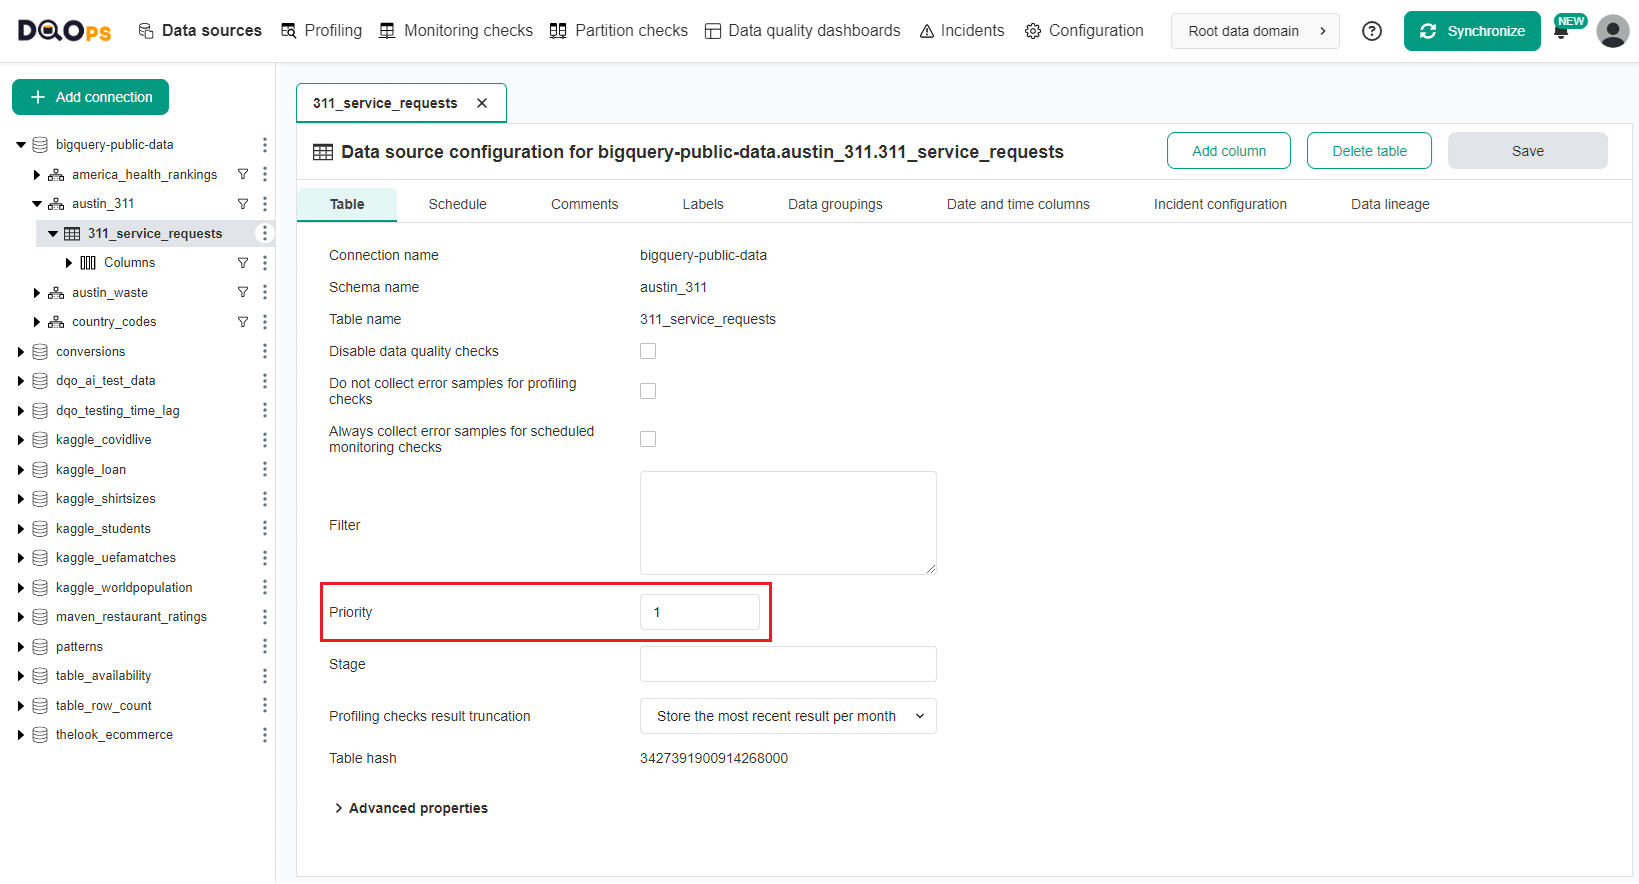
Identify high-priority tables
A successful data quality improvement process requires showing visible progress to data stakeholders, and cleansing the most important tables within the first weeks of the project.
DQOps uses numeric priorities (1, 2, 3, ...) configured on the table's metadata screen in the Data Sources section as shown below.
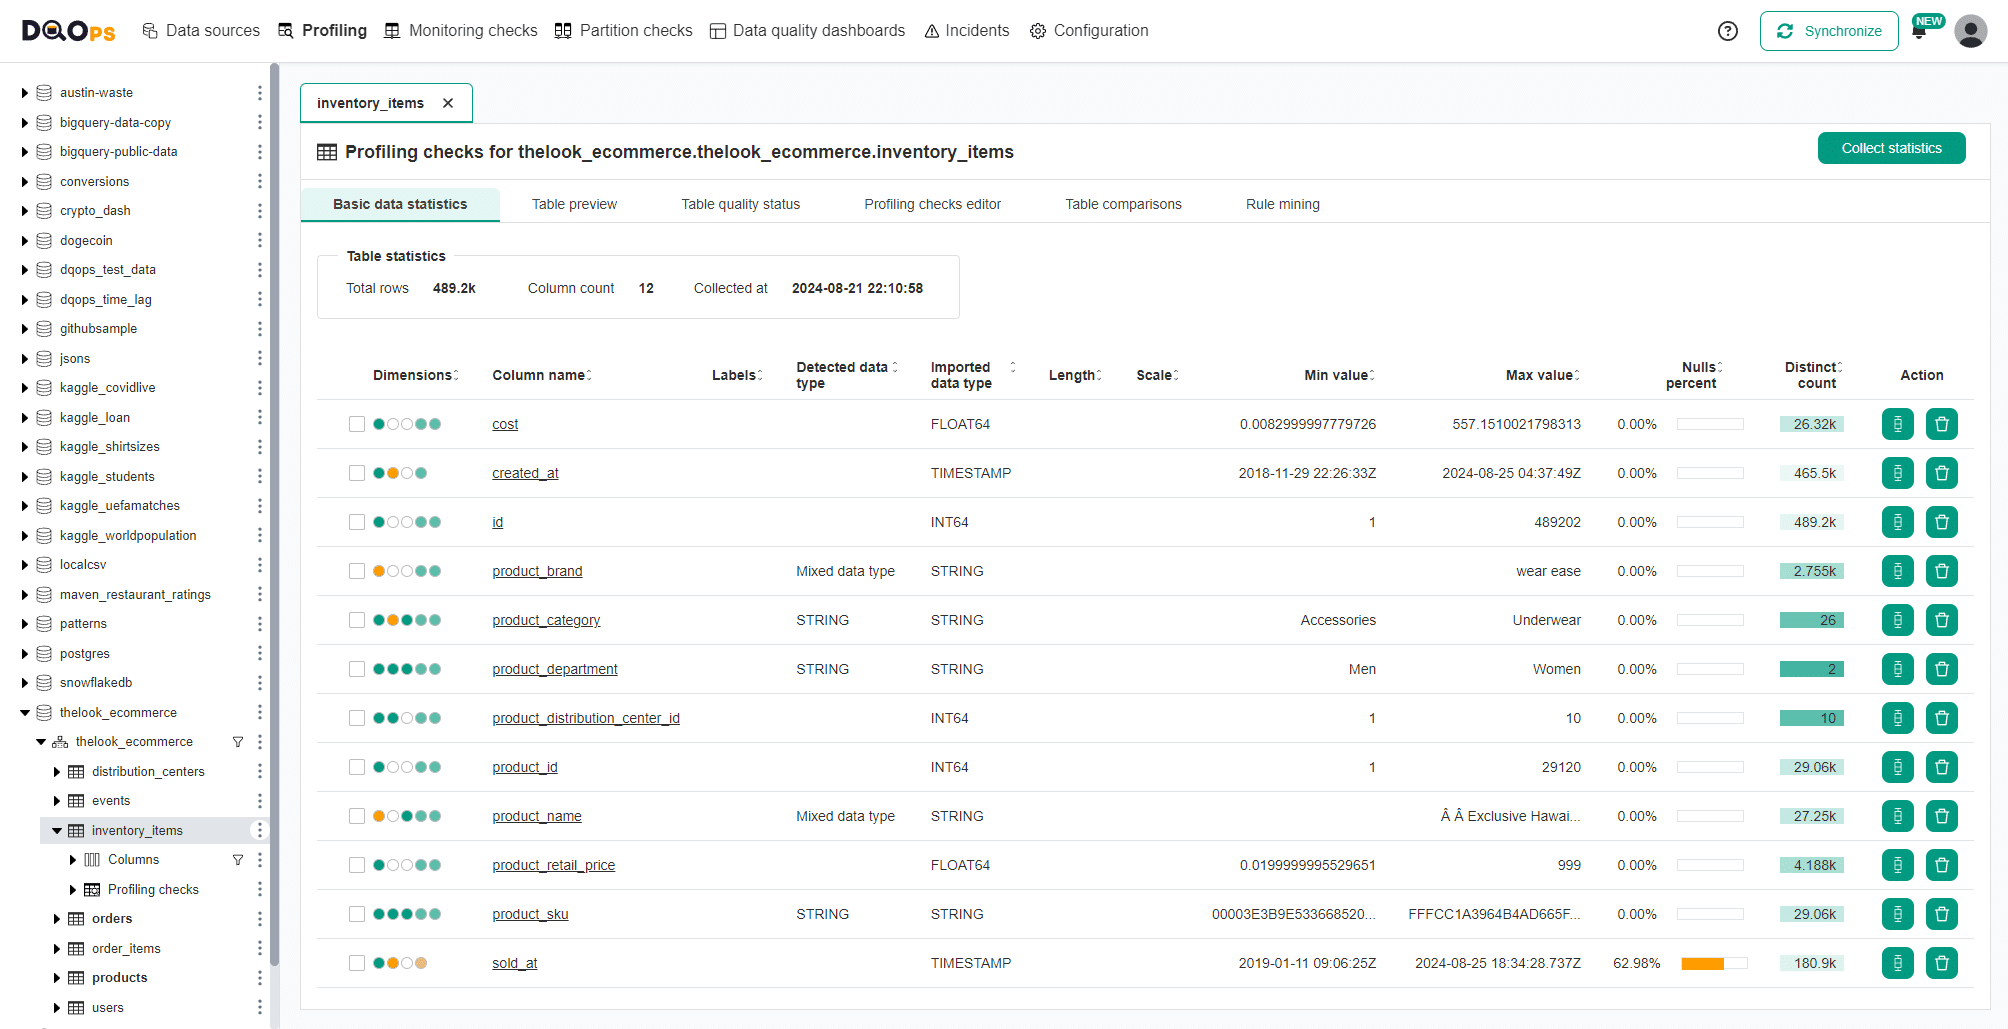
Collect basic statistics
Profile the data sources by calculating basic statistics. This is the initial step of data quality assessment. DQOps simplifies the collection of statistical information on each column and also collects sample values from an analyzed table.
An example of basic statistics is shown below.
Activate profiling checks using rule mining
Next, validate the data with profiling data quality checks to ensure that it meets data quality requirements and is not affected by data quality issues. This is the second step of data quality assessment.
During the data profiling stage, you will probably activate many data quality checks supported by DQOps, just to see if they pass.
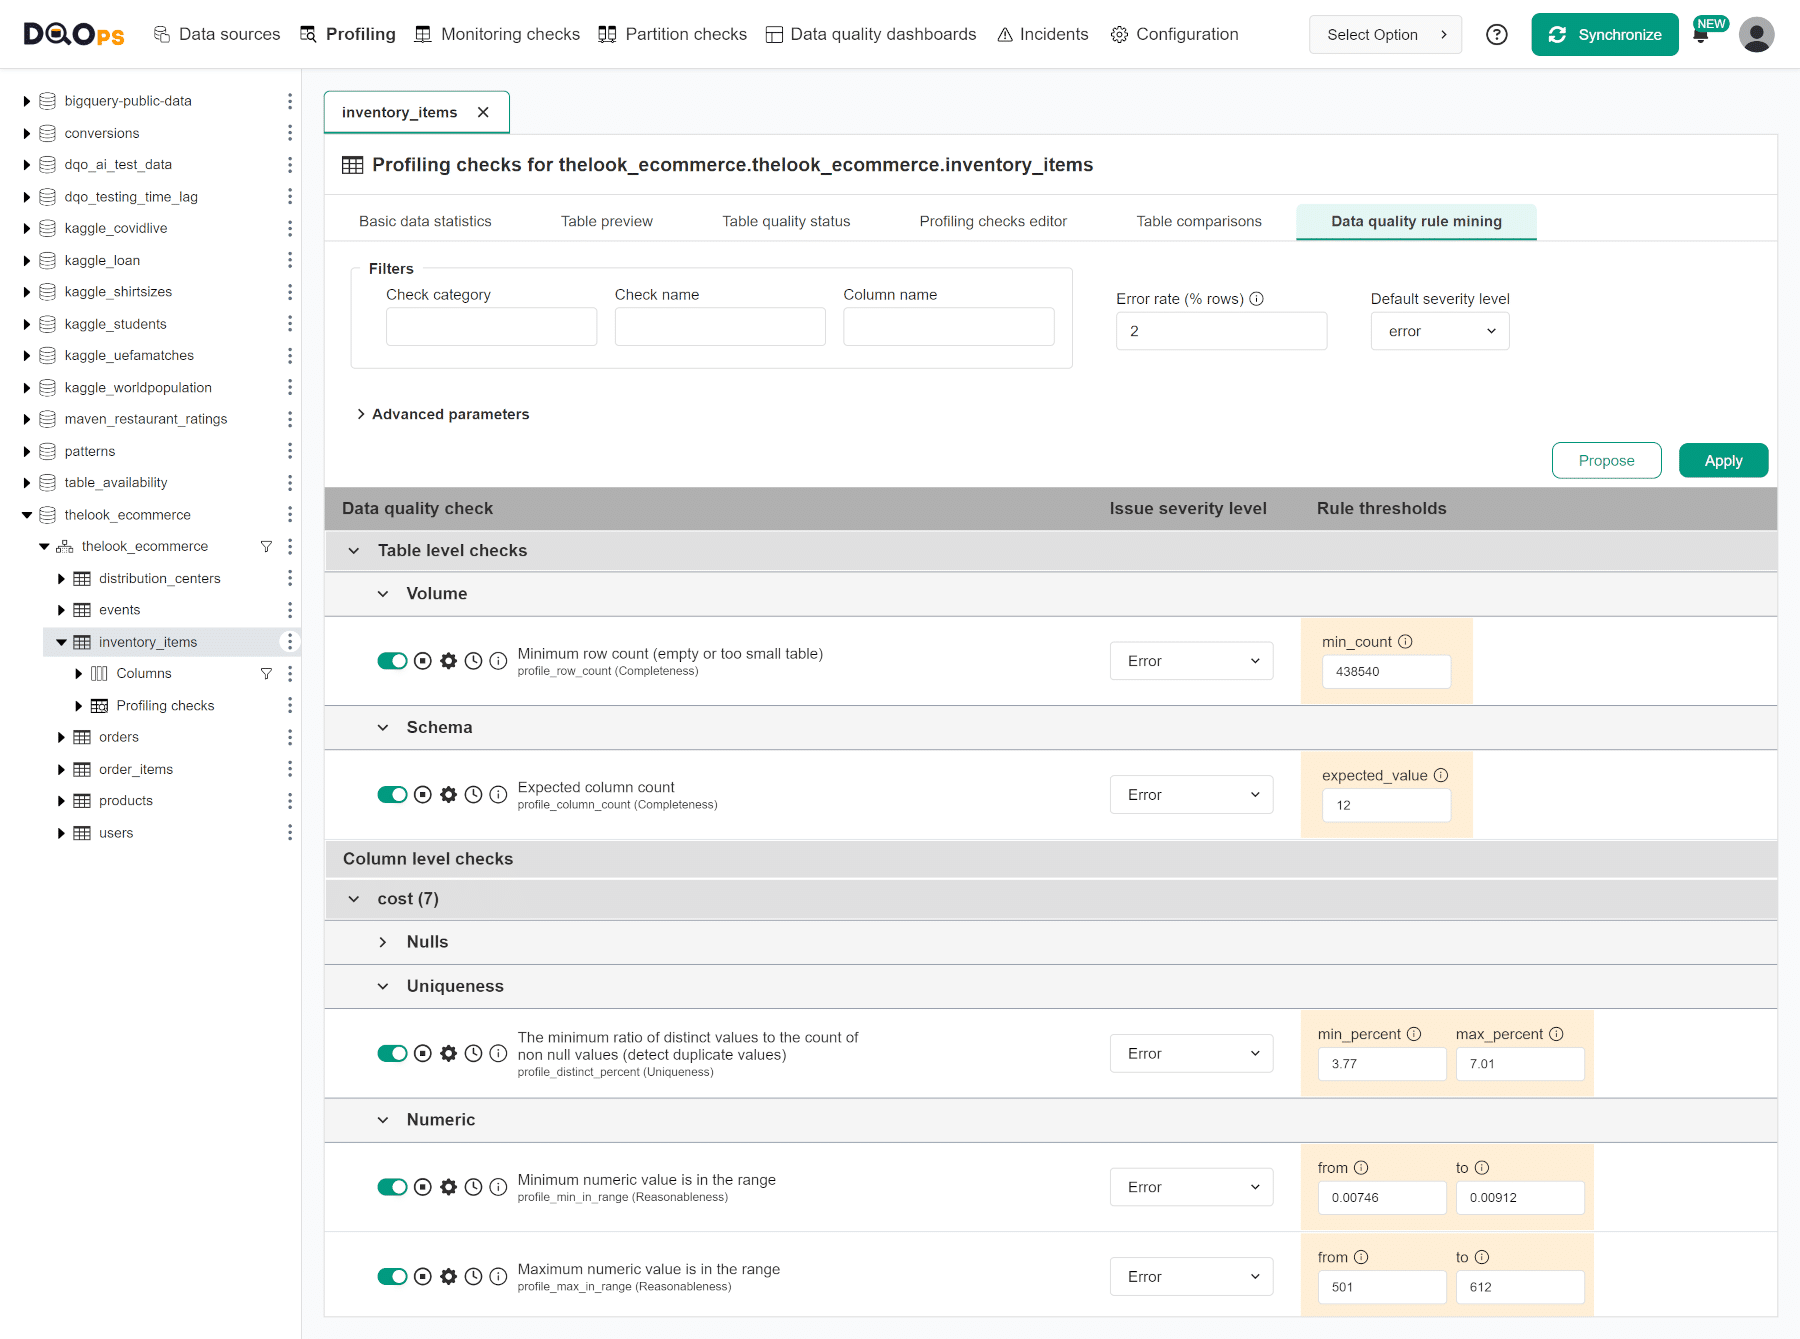
DQOps can speed up this process by using the DQOps rule mining engine to propose the configuration of data quality checks to detect the most common data quality issues. DQOps uses statistics and data samples to propose these checks and their rule thresholds (parameters).
Follow the link to learn more about the rule mining engine.
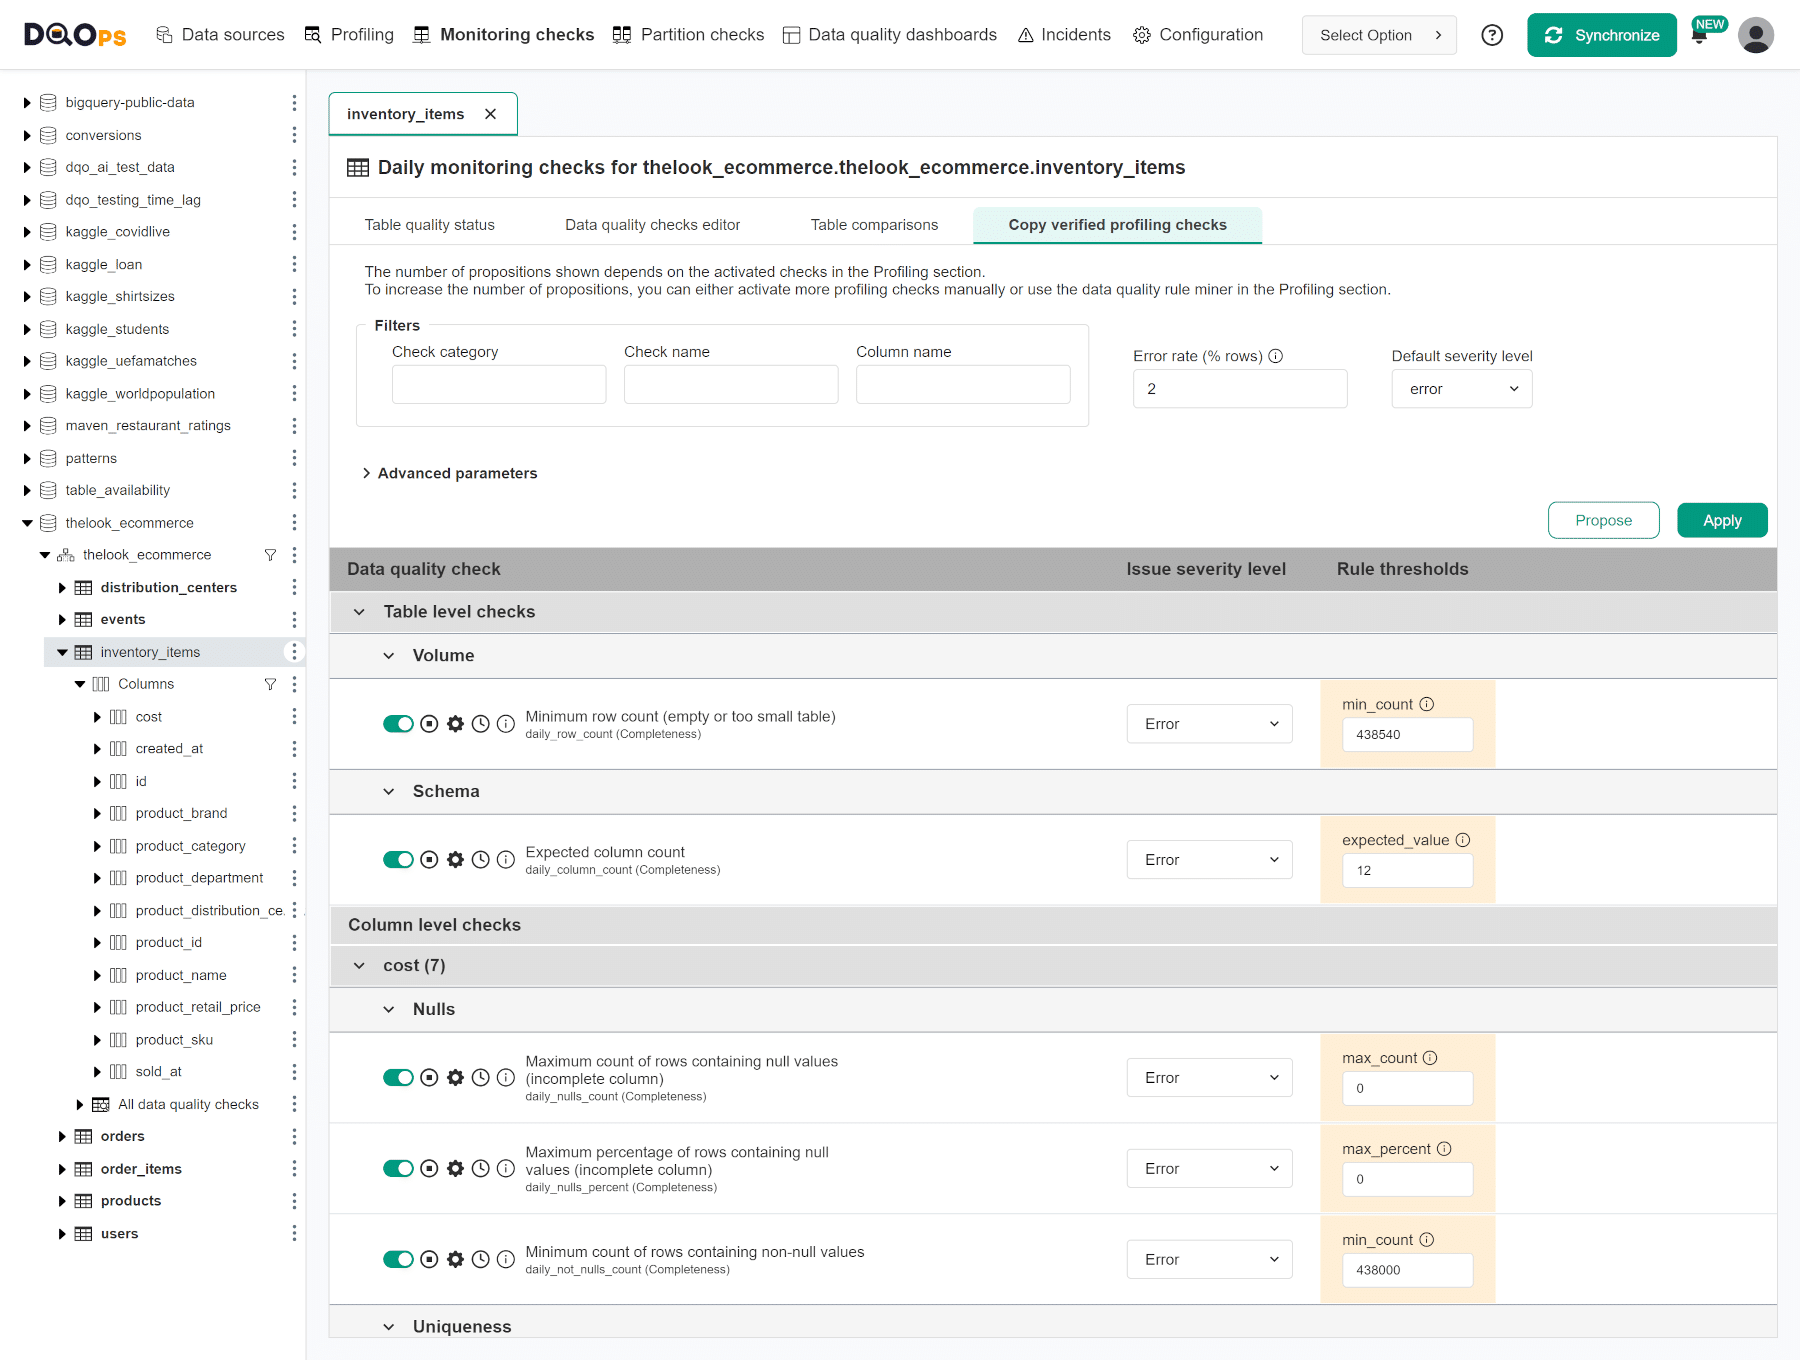
The following screenshot shows the rule mining proposals of data quality checks that should detect issues if less than 2% of records are invalid.
Review profiling issues
After performing the data quality assessment, review the data quality results with the Table quality status.
DQOps displays the Table quality status for each table in the form of a matrix. Each row represents the data quality health status for one table's row. The columns in this view group checks into categories of data quality checks, but an alternative view to show data quality dimensions is also supported.
Table quality status also displays the Data quality KPI score for the table.
Below is an example of the Table quality status screen.

Table quality status will help you identify data quality issues that should be fixed and monitored.
The tasks for fixing confirmed data quality issues should be planned for the data cleansing tasks. False-positive issues will require disabling incorrectly configured data quality checks.
Activate monitoring and partition checks
Once the data quality assessment is complete, it will be clear which data quality issues are real issues and which failed profiling checks should not be measured since some columns may be incomplete.
After configuring all profiling checks, you should copy approved data quality checks from the profiling section to the monitoring checks or partition checks sections. The rule mining engine simplifies this process by allowing the user to copy profiling checks and their parameters.
Observe KPIs, review issues and fix data
The next step involves a continuous data observability process. DQOps will run configured monitoring and partitioned checks on a daily basis to detect data quality issues. These issues will then be included into the data quality KPI score.
The data quality improvement process operates as a continuous loop, involving the following steps:
-
DQOps detects a new data quality issue, resulting in a decrease in the data quality KPI.
-
The issue is reviewed.
-
Valid issues are either assigned to the data engineering teams or the data producer is contacted to fix the data at the source.
-
The data quality KPI scores are reviewed for each data source, table, vendor, and data quality dimension.
-
Tasks are planned to fix data quality issues.
-
Data quality checks are executed again after the data issue is solved to verify the fix.
-
Data quality KPIs are reviewed once more.
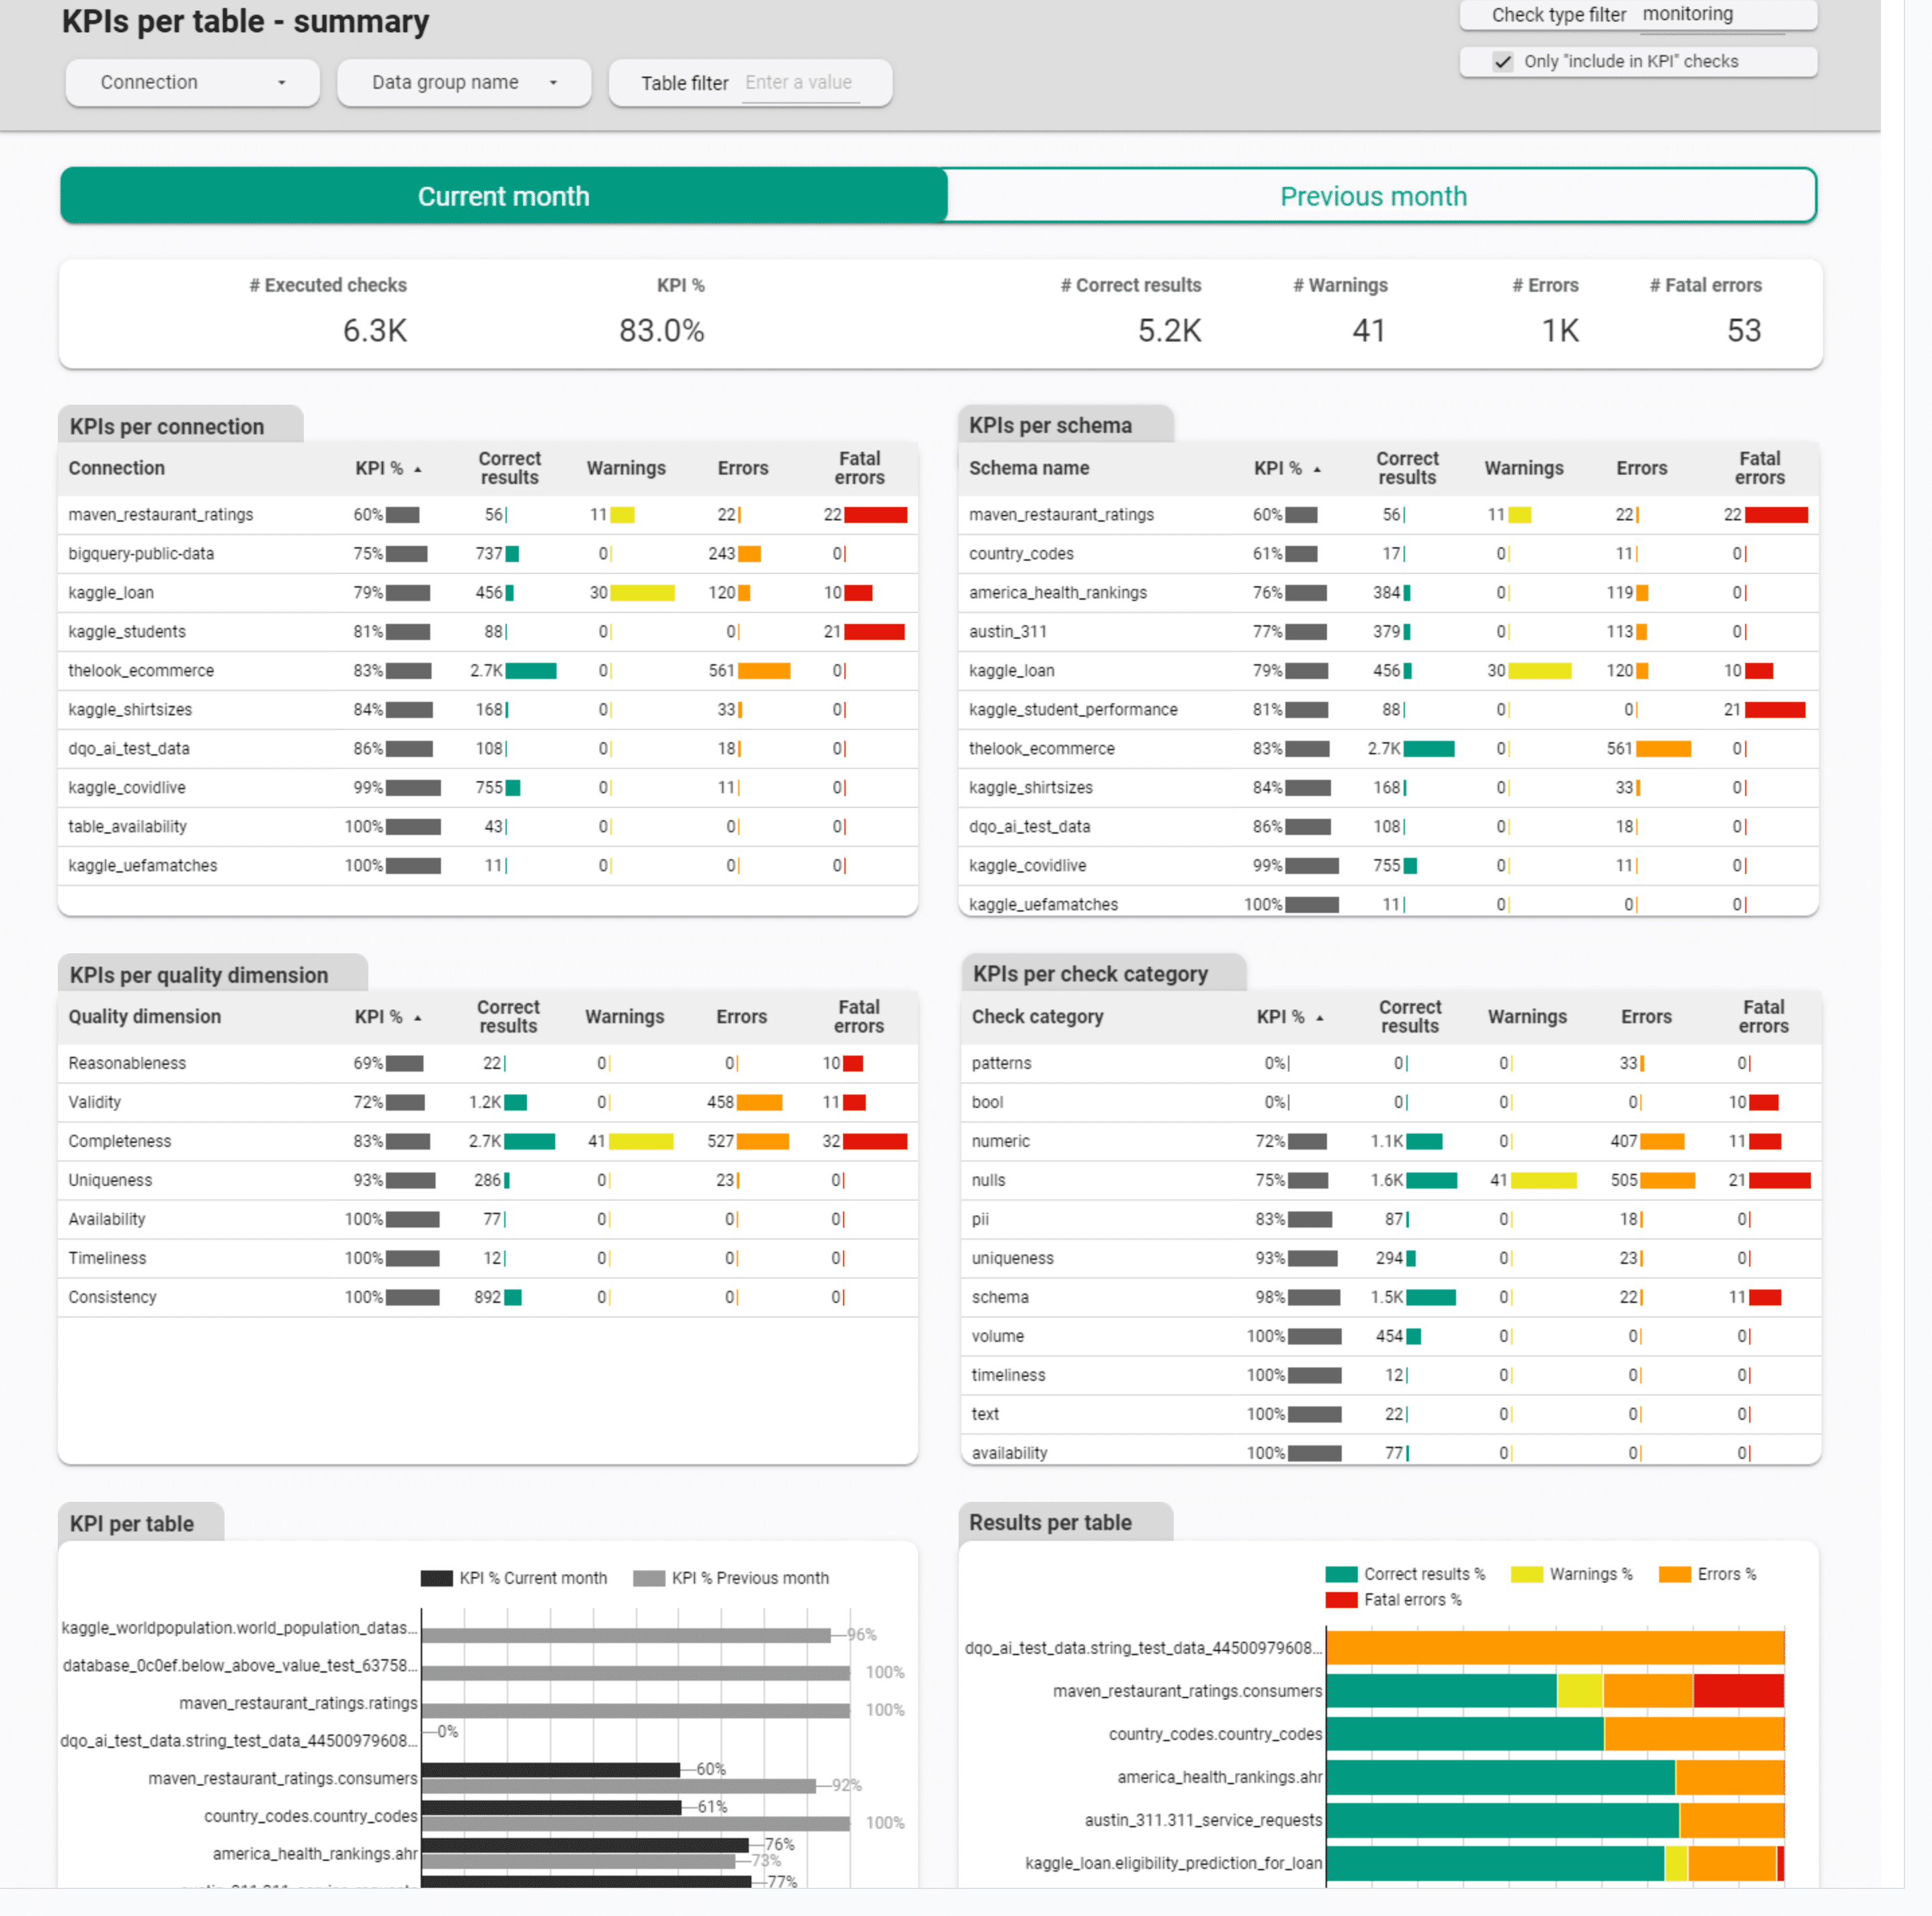
The following screenshot displays one of the data quality KPI dashboards, offering drill-down options to pinpoint the type of the data quality issue. This dashboard can be found in the Data Quality Dashboards -> Monitoring -> Data quality KPIs subsection.
Data contracts
Data contract verification
Data contracts are a modern way to document the format of published data, and verify the compliance of data with the agreed contract. The responsibility for defining the data contract is on the data producer side, but the data consumer should verify if the received data meets the data contract.
Data contracts are defined for various areas, including
- table metadata
- data types
- data refresh frequency
- foreign key constraints
- data formats
- nullability and completeness
- allowed values for each column
- daily volume
- documentation of the tables
- who owns the data
The areas of the data contract that can be verified with data quality checks are highlighted in bold. Those areas should be measured at least daily or after each data loading operation, to verify that the data is compliant with the data contract. The level of compliance can be measured with a data quality KPI that proves that both the data producer ensured that the data is compliant, and the data consumer reviewed the compliance with data quality checks to ensure that the data has not been corrupted on the way.
DQOps data quality checks that are defined in .dqotable.yaml files are a simple way to define the data contract that can be shared between the data publisher and the data consumer, also ensuring compliance with KPIs.
Sharing data
DQOps can be used by the data publisher to prove that the data quality was verified for every batch of data and meets the requirements defined in the data contract, measured with a KPI.
The data publishers who should verify the quality of published data are
-
data domain owners, especially in a data mesh architecture,
-
platform owners, who provide access to their databases,
-
data engineering teams responsible for maintaining data warehouses used by other teams,
-
external vendors, who are also required to share data files with detailed information
- marketing agencies,
- suppliers,
- subcontractors,
- distributors.
Receiving data
The team or organization that receives data is called a data consumer. The data consumer can integrate DQOps as part of the data pipeline to ensure that no fatal severity issues are detected and the total data quality KPI meets the target.
Please review the samples in the integration with Airflow article in the integrations section.
Aggregation of data quality KPIs
Monthly KPI aggregation
The default data quality KPI aggregation scale used by data quality dashboards in DQOps is monthly aggregation. The data quality dashboards are grouping data quality check results on the time_period column, which stores the day or month when the data quality check was executed.
The data quality KPIs in monthly periods are calculated as the percentage of passed data quality checks executed during the month. Data quality dashboards in DQOps truncate the time_period columns to the first day of the month to aggregate the results in monthly periods.
| Month (truncated time_period) | Executed checks | Passed checks | KPI value |
|---|---|---|---|
| 2023-01-01 | 1000 | 951 | 95.1% |
| 2023-02-01 | 1000 | 962 | 96.2% |
| 2023-03-01 | 1000 | 945 | 94.5% |
| 2023-04-01 | 1000 | 947 | 94.7% |
Data quality KPIs in DQOps are calculated in monthly periods because this scale allows to notice changes in the data quality score during recurring data quality review sessions. Month-to-month changes to the data quality KPI can be reviewed using drill-down dashboards. The data engineering team can plan implementation tasks such as rebuilding a data pipeline that is loading corrupted data.
Daily KPI aggregation
Sample data quality KPIs aggregated at a daily level are shown in the table below.
| Time period | KPI value |
|---|---|
| 2023-10-01 | 95.1% |
| 2023-10-02 | 96.2% |
| 2023-10-03 | 94.5% |
| 2023-10-04 | 94.7% |
The data quality dashboards such as the KPI history dashboard shown below can aggregate the data quality KPI per day. Please look at the last chart with KPI calculated for the whole previous month.

Monthly with data quality dimensions
The data quality KPIs are most relevant, when aggregated both at the monthly period, and divided by the data quality dimension, as shown in the following table.
| Month | Timeliness | Completeness | Validity |
|---|---|---|---|
| 2023-01-01 | 96.1% | 97.4% | 95.1% |
| 2023-02-01 | 99.2% | 94.6% | 96.2% |
| 2023-03-03 | 94.6% | 97.0% | 94.3% |
| 2023-04-04 | 99.1% | 93.2% | 94.7% |
By groups of rows
Additionally, data quality KPIs can be calculated for each data group.
Tracking the data quality for groups of rows identified by the discriminator column makes it possible to identify data received from different data sources, but ultimately aggregated into a single table. The discriminator column can be a country, state, vendor, or supplier name.
DQOps supports running data quality checks as SQL queries with a GROUP BY clause. Please read the article about data segmentation in the concept of data grouping.
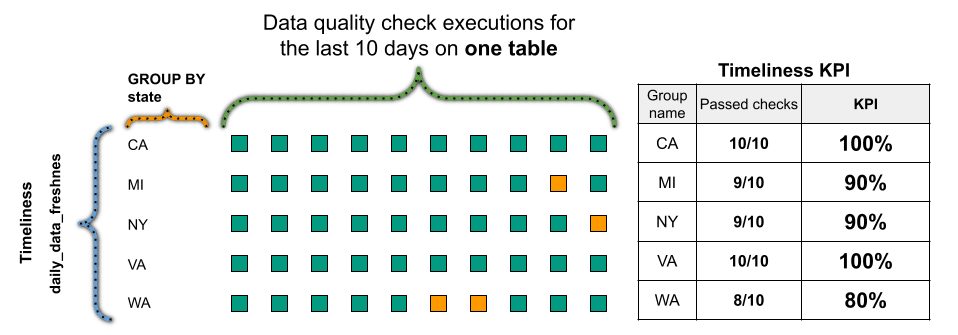
The following data quality KPI formula shows how DQOps measures the score for each group of rows, when the data is grouped by a state column that contains US state names.
By groups of rows and dimensions
The Data quality KPI can also be aggregated by the data group name and data quality dimension. Sample results are shown in the table below.
| Month | Data Source (state) | Timelines | Completeness | Validity |
|---|---|---|---|---|
| 2023-10 | CA | 96.1% | 97.4% | 95.1% |
| 2023-10 | MI | 99.2% | 94.6% | 96.2% |
| 2023-10 | NY | 94.6% | 97.0% | 94.3% |
| 2023-10 | WA | 99.1% | 93.2% | 94.7% |
The data quality KPI formula for splitting scores by the data group name and data quality dimension is shown below.

The data quality dashboards provided by DQOps that show the results aggregated by data group names and data quality dimensions are
- Profiling -> Data quality KPIs -> KPIs per quality dimension and data group for profiling checks, showing the initial data quality score
- Monitoring -> Data quality KPIs -> KPIs per quality dimension and data group for monitoring checks, showing data quality scores observed by regular full-table monitoring
- Partitions -> Data quality KPIs -> KPIs per quality dimension and data group for partitioned checks, showing data quality scores for daily and monthly partitions
By groups of tables
DQOps also supports calculating data quality KPIs for groups of tables. This type of KPI aggregation is useful:
- when tables are grouped by data source,
- when tables are grouped by geography (country, state, etc.),
- for business owner
Please read the concept of data grouping by tags article to see how to assign tags to tables.
The following data quality KPI formula shows how DQOps can measure timeliness for tables tagged by a state name.

FAQ
You can find answers to some popular questions about data quality KPIs.
What are quality metrics?
Quality metrics are simply ways to measure how good something is. They can be used in any area where you need to assess and improve quality, like manufacturing, customer service, or even healthcare. These metrics help you track performance, identify areas for improvement, and ensure you're meeting your goals.
These metrics can be quantitative, focusing on numbers (like the weight of a chair), or qualitative, describing characteristics (like the comfort of the chair).
Quantitative data quality metrics are measured with data quality KPIs or by the number of invalid data records in a dataset. Interviews with users measure qualitative data quality metrics to ask about their perceived usability, performance, availability, and data quality.
What are data quality metrics?
Quality metrics are quantifiable measurements that help you assess the condition of your data. They provide insights into various aspects of data quality, such as accuracy, completeness, consistency, timeliness, and validity. These metrics are crucial for organizations to make informed decisions, improve operational efficiency, and ensure regulatory compliance.
Why data quality is important?
Good data quality is really important because it makes sure the information we get from that data is correct and can be trusted. This means businesses can make good decisions, work better, and do what they need to do. Bad data can cause many problems, like wrong decisions, mistakes, and even losing money.
Here's why:
- Good choices: We can use good data to plan our business, understand our customers, and choose the best way to do things.
- Working better: Good data helps things run smoothly. We can avoid mistakes, save time, and do things more efficiently.
- Happy customers: With good data, we can give our customers what they want and provide them with better service.
- No compliance issues: Good data helps us follow laws and rules, which is important for any business.
What are data quality metrics examples?
Data quality metrics are specific ways to measure how good your data is. Here are a few examples:
- Completeness: This checks if your data has any missing values. For example, you can measure how many customer records don't have a phone number.
- Uniqueness: This checks if you have any duplicate data. For example, you can find out how many customers have the same email address.
- Accuracy: This checks if your data is correct. You can compare your data with a trusted source to make sure it's right. For example, you might check customer addresses against a postal service database.
- Validity: This checks if your data follows the rules. For example, you might check if all phone numbers are in the correct format.
You can also measure data quality for entire tables, files, and datasets. This can tell you how many data quality checks have passed.
These are just a few examples of data quality metrics. The specific metrics you use will depend on your needs and the type of data you have. Please review the list of data quality check categories to learn more about methods of measuring other data quality metrics.
What is the data quality metrics definition?
Data quality metrics are measurable values that help you understand how good your data is. They provide a way to assess different aspects of data quality, such as:
- Accuracy: Is the data correct and free from errors?
- Completeness: Does the data include all the necessary information?
- Consistency: Is the data the same across different systems and sources?
- Timeliness: Is the data up-to-date?
- Validity: Does the data conform to defined rules and standards?
By using data quality metrics, you can identify areas where your data needs improvement and track the progress of your data quality initiatives. This helps you make better decisions, improve operations, and reduce risks.
What is a KPI formula?
A KPI formula is a calculation that helps you measure how well something is performing. It takes specific data and turns it into a meaningful number that you can track and analyze.
For example, in data quality, a KPI formula might measure the percentage of valid records in a dataset:
(Number of valid records / Total number of records) * 100. This tells you how much of your data meets your defined standards.
How to create a data quality scorecard?
Creating a data quality scorecard involves bringing together various data quality metrics to get a clear picture of your data's health. Here's how you can do it:
-
Gather your data quality metrics: First, you need to collect important metrics like completeness, accuracy, and consistency. This often involves using tools and scripts to analyze your data and generate these metrics.
-
Store the metrics: Next, store these metrics in a database. This allows you to track them over time and analyze trends.
-
Build a dashboard: Create a visual dashboard that displays your key data quality KPIs. This dashboard should show how these KPIs change over time, and allow you to see the scores for different data sources and datasets.
-
Analyze and prioritize: Use the scorecard to identify areas with low data quality scores. This helps data owners and data teams prioritize their improvement efforts.
To make this process easier, you can use tools like DQOps. DQOps has a built-in data quality metrics database and provides many ready-to-use dashboards, including different types of data quality scorecards. This can save you time and effort in building your own solution.
What is a data quality scorecard example?
A data quality scorecard is like a report card for your data. It gives you a quick overview of how healthy your data is. Here's what a good data quality scorecard should do:
- Show the overall health of your data: It should give you a quick summary of how good your data is right now.
- Show how data quality changes over time: It should track data quality metrics over time, like for each month, so you can see if things are getting better or worse.
- Show data quality for different sources: It should show you the scores for different data sources, so you can see which ones need the most attention.
- *Show data quality for different areas(: It should show you scores for different data quality dimensions, like completeness, accuracy, and timeliness.
You can find examples of data quality scorecards in DQOps, a data quality platform. These examples can give you ideas on how to create your own scorecards and how to present the information in a way that's useful for your team and the business sponsors.
What are the benefits of data quality?
Good data quality means fewer headaches for everyone!
Data teams spend less time fixing errors, so they can focus on more important tasks.
Dashboards show reliable information, so you can make quick decisions without second-guessing the numbers.
And because the data is trustworthy, you can use it right away without wasting time checking it against other sources.
Overall, good data quality saves time, reduces frustration, and helps everyone make better decisions.
How to measure data quality?
Measuring data quality is all about checking your data for different dimensions, such as accuracy and completeness. You do this by running data quality checks to see if your data meets your expectations.
Here are two main ways to measure data quality:
- Counting errors: This involves checking individual records for problems, like missing values or incorrect formats.
- Calculating KPIs: This involves looking at the bigger picture and measuring things like the overall percentage of valid records in a dataset or database.
You can check your data quality once, like taking a snapshot, or you can continuously monitor it over time. Tools like DQOps can help you keep track of data quality metrics and alert you to any problems.
What are the data management KPIs?
Data management KPIs are like a health checkup for your entire data system. They give you a complete view of how well your data is being managed, used, and maintained. These KPIs go beyond just data quality and include things like:
- Metadata: This tracks information about your data, like the number of tables or databases you have.
- Data usage: This measures how often and how effectively your data is being used.
- Data quality: This includes the usual suspects like accuracy, completeness, and consistency.
- Tickets and incidents: This tracks issues with your data, such as the number of open or delayed tickets.
By tracking these KPIs, you can see how well your data management processes are working and identify areas for improvement. This helps you ensure your data is a valuable asset to your organization.
How to begin data quality measurement?
To start measuring data quality, you can use a tool to get a quick look at your data. Then, set up some simple checks to see if your data is complete and correct. After reviewing the results, you can clean up any problems you find. Finally, use a tool to keep an eye on your data quality over time. This will help you make sure your data stays in good shape.
Read the description of the DQOps' data quality process to learn the details.
What are the 5 metrics of quality data?
Five key metrics for quality data are completeness (having all the necessary information), accuracy (being correct), consistency (being the same across time and different sources), timeliness (being up-to-date), and validity (following the defined rules and standards). These metrics help you understand how trustworthy and reliable your data is for making decisions and running your business.
What are the data quality metrics best practices?
To get the most out of your data quality metrics, it's important to have a solid process in place. This means regularly checking new data, automatically testing it for problems, and continuously monitoring it for changes. You should also use tools that can help you spot unusual patterns and alert you when something goes wrong. Finally, make sure you have clear dashboards and workflows to help you track and manage any data quality issues that arise. By following these best practices, you can ensure that your data quality metrics are always accurate and up-to-date.
How to measure data quality for ongoing improvement?
To measure data quality for ongoing improvement, you first need to understand your starting point by profiling your data. This creates a baseline, like a snapshot of your data's current quality. Then, you can use a data observability tool to continuously monitor your data, run quality checks, and update your scores. This helps you track changes and see if your data is getting better or worse. A tool like DQOps can store this information and show it on dashboards, making it easy to identify areas that need attention. By regularly checking these dashboards and fixing any new data quality problems, you can steadily improve your data quality and reach your goals, often within a few weeks.
What are the KPIs for master data management?
KPIs for master data management focus on making sure your most important data, like customer or product information, is accurate and reliable. This means keeping a close eye on the number of incorrect or invalid records in these key datasets. It's also crucial to track these KPIs over time, so you can quickly spot any negative trends or sudden drops in data quality that might make the data unusable. This helps you maintain a high level of trust and confidence in your master data.
How to build reliable data pipelines?
Reliable data pipelines require robust observability to ensure data integrity and availability.
This necessitates an external tool capable of deep monitoring and proactive anomaly detection.
This tool should continuously track key metrics like completeness, accuracy, and consistency to identify deviations from expected ranges,
and leverage machine learning to identify unusual patterns or trends in data that may indicate underlying pipeline issues or data integrity problems.
It's also vital to track data arrival times and latency to detect potential pipeline failures or upstream data source issues,
and to integrate with pipeline logging systems to identify errors, warnings, and performance bottlenecks.
Effective pipeline observability demands tight integration with the pipeline itself, enabling automated triggering of data quality checks at critical stages.
This should be coupled with a sophisticated incident management workflow, incorporating real-time alerting and escalation procedures to ensure timely intervention by operations teams.
This comprehensive approach minimizes data downtime and ensures the delivery of high-quality, reliable data for downstream consumption.
What's next
- Look at some built-in data quality KPI dashboards
- Read about build-in data quality dashboards
- Learn how DQOps assigns data quality checks to data quality dimensions
- Learn how to review results of data quality monitoring results on dashboards
- Find out how data quality KPIs are measured incrementally for partitioned data