Last updated: July 05, 2025
What are Data Profiling Checks? Definition and Examples
Data quality profiling checks are performing the initial data quality assessment of datasets to find common quality issues and create a data quality baseline.
What are data profiling checks?
The data profiling checks in DQOps are responsible for assessing the initial data quality score of data sources. They should be activated on new data sources to verify that the dataset meets the minimum data quality requirements.
Profiling checks are also useful for exploring and experimenting with various types of checks to determine the most suitable ones for regular data quality monitoring. Before activating a data quality monitoring check, the user should test a profiling version of the data quality check. Every monitoring and partition data quality check has a profiling version, named as profiling_*.
Summary
The following table summarizes the key concepts of profiling data quality checks in DQOps.
| Check type | Purpose | Time period truncation | Check name prefix |
|---|---|---|---|
| profiling | Evaluate the initial data quality score of new tables. Experiment with DQOps data quality checks before activating monitoring checks for measuring the data quality KPIs. |
A single data quality profiling result is captured per month. If profiling is repeated within the same month, the previous result is replaced. |
profile_* |
Data profiling status checkpoints
DQOps stores only the one data quality profiling result for each month. If user runs the same profiling again during the same month, the previous result is replaced. This behavior is designed for experimentation and tuning the parameters for the data quality rules.
Profiling checks in DQOps user interface
The following screen shows the profiling results for a profile_row_count
data quality check that detects empty tables. By setting the min_count rule parameter to 0, DQOps will raise an error severity
data quality issue for empty tables. The data quality issue is stored in the check_results Parquet table.
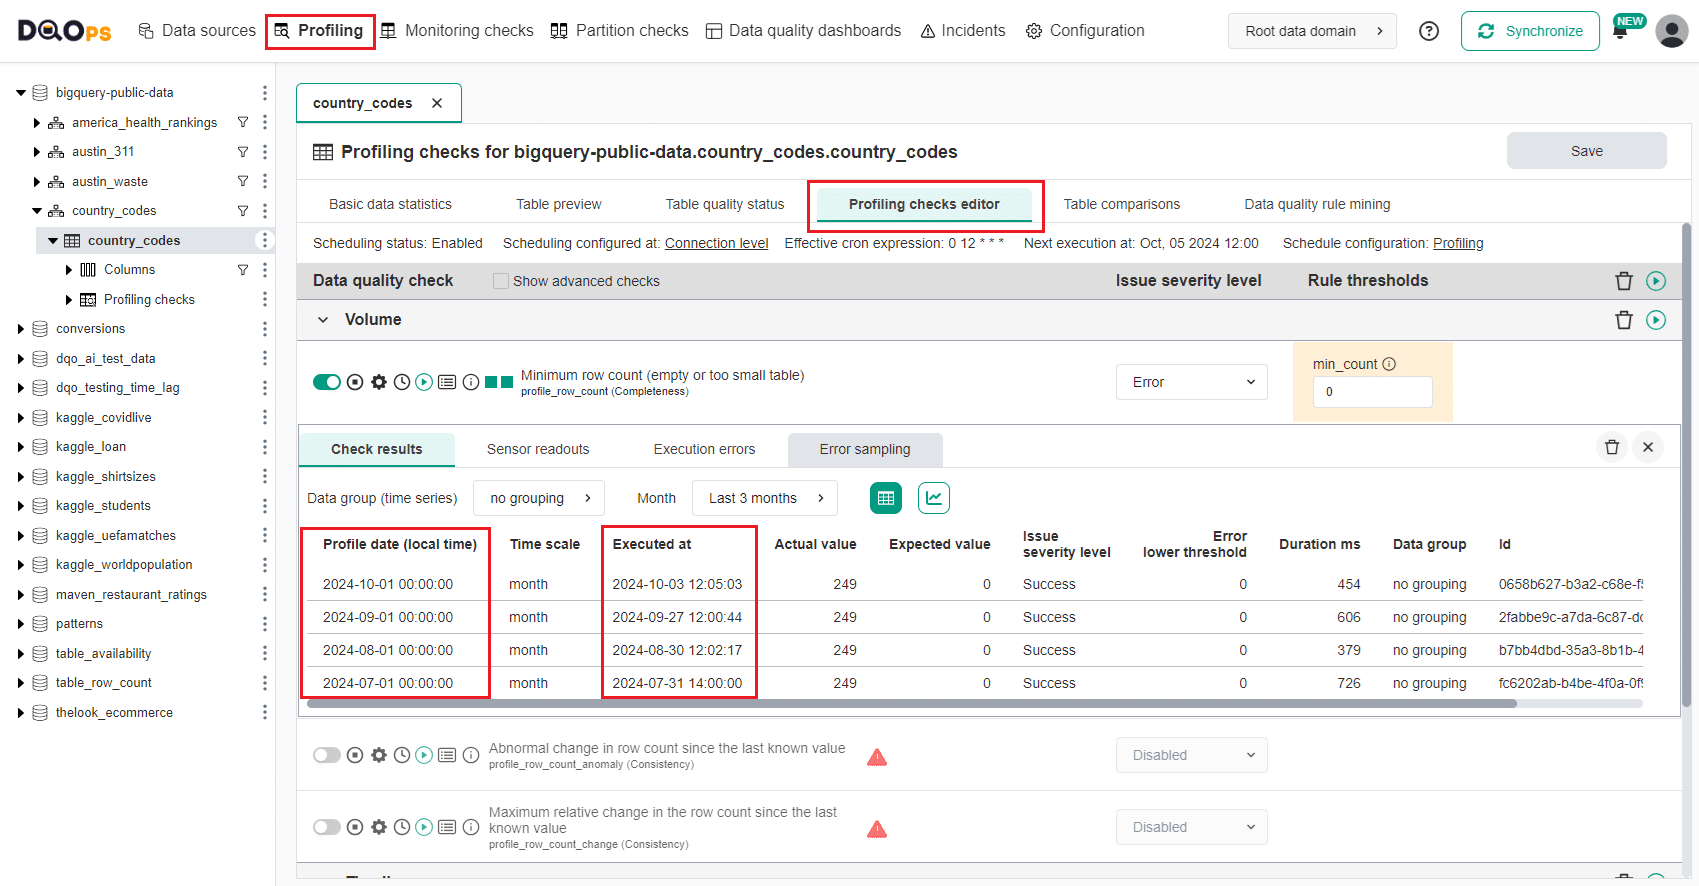
The screenshot above shows the most recent data profiling results captured at 2024-10-03 12:05:03. The dates in the Executed At column show the dates when the profiling checks were executed. The Profile data (local time) is the time period (month) for which the profiling result is valid. The date is truncated to the 1st day of the month when the profiling data quality checks were run.
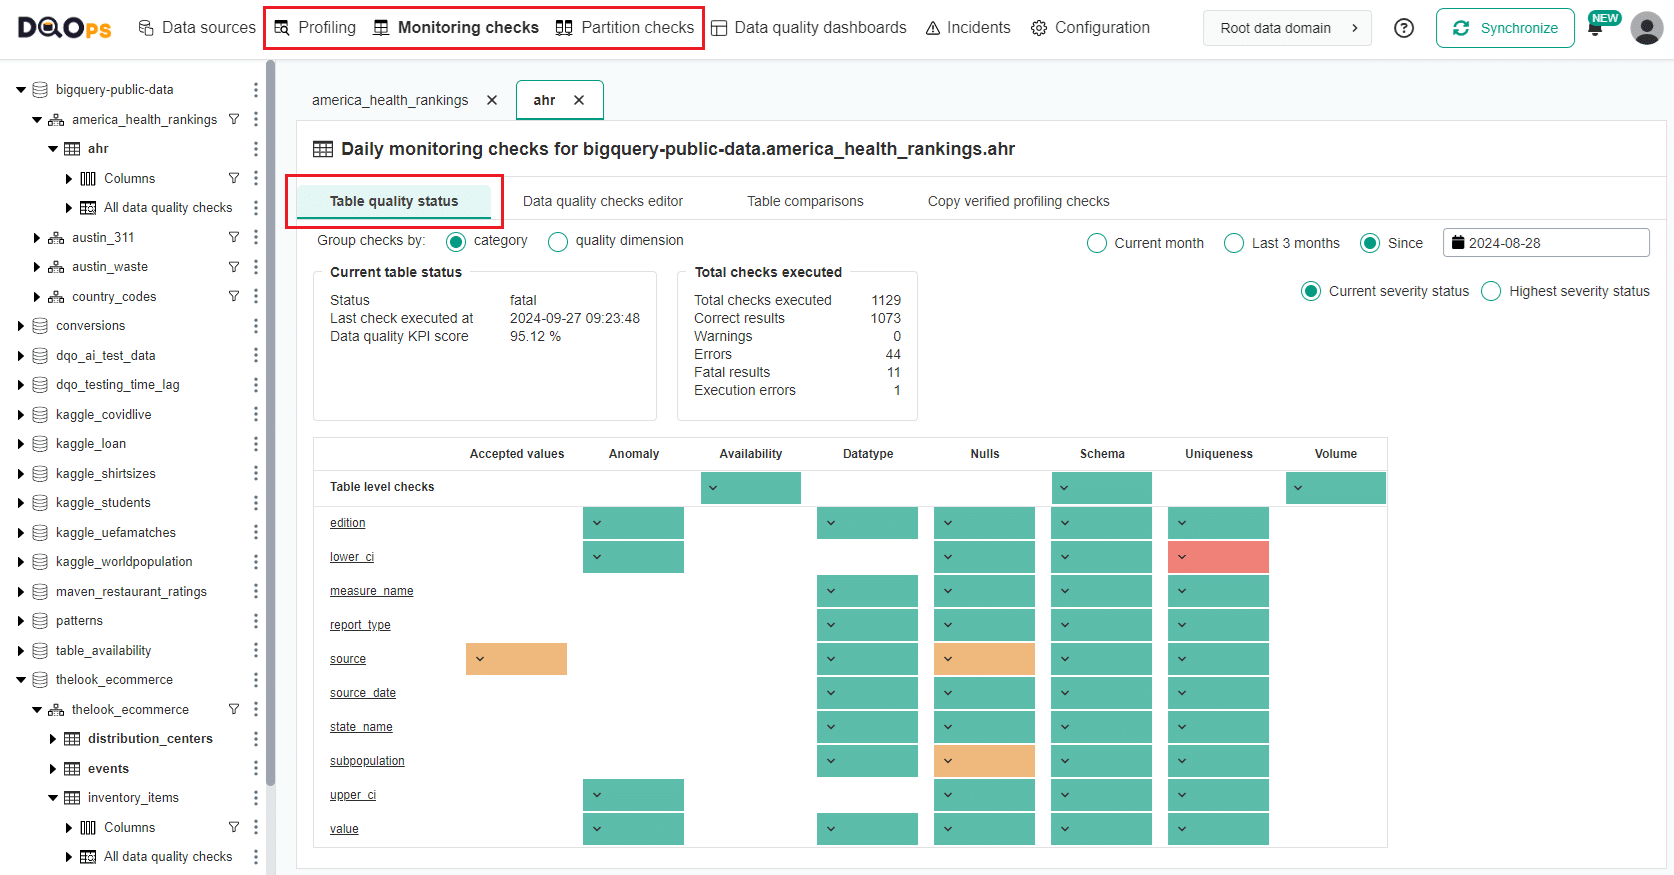
Initial data quality KPI score
Initial data quality KPI score can be quickly verified in the Table quality status This screen provides a summary of the results of the executed checks, grouped by check category or data quality dimension.
Profiling checks pros and cons
When to use profiling checks
Use the data profiling checks for:
- assessing the initial data quality score of new tables,
- experimenting with data quality checks, DQOps has 150+ built-in data quality checks,
- testing custom data quality checks, and sensors, and rules,
- testing changes to monitored tables before data quality monitoring checks are activated, and the data quality KPI score is used to verify compliance with data contracts.
Limitations of profiling checks
Data profiling checks store only one result per month, which limit their usage only to assessing the initial data quality.
-
Do not use the DQOps REST API Client from data pipelines for running profiling checks, unless there is a requirement to maintain the most recent data profiling status at all time. Run monitoring data quality checks instead to capture the result for each day.
-
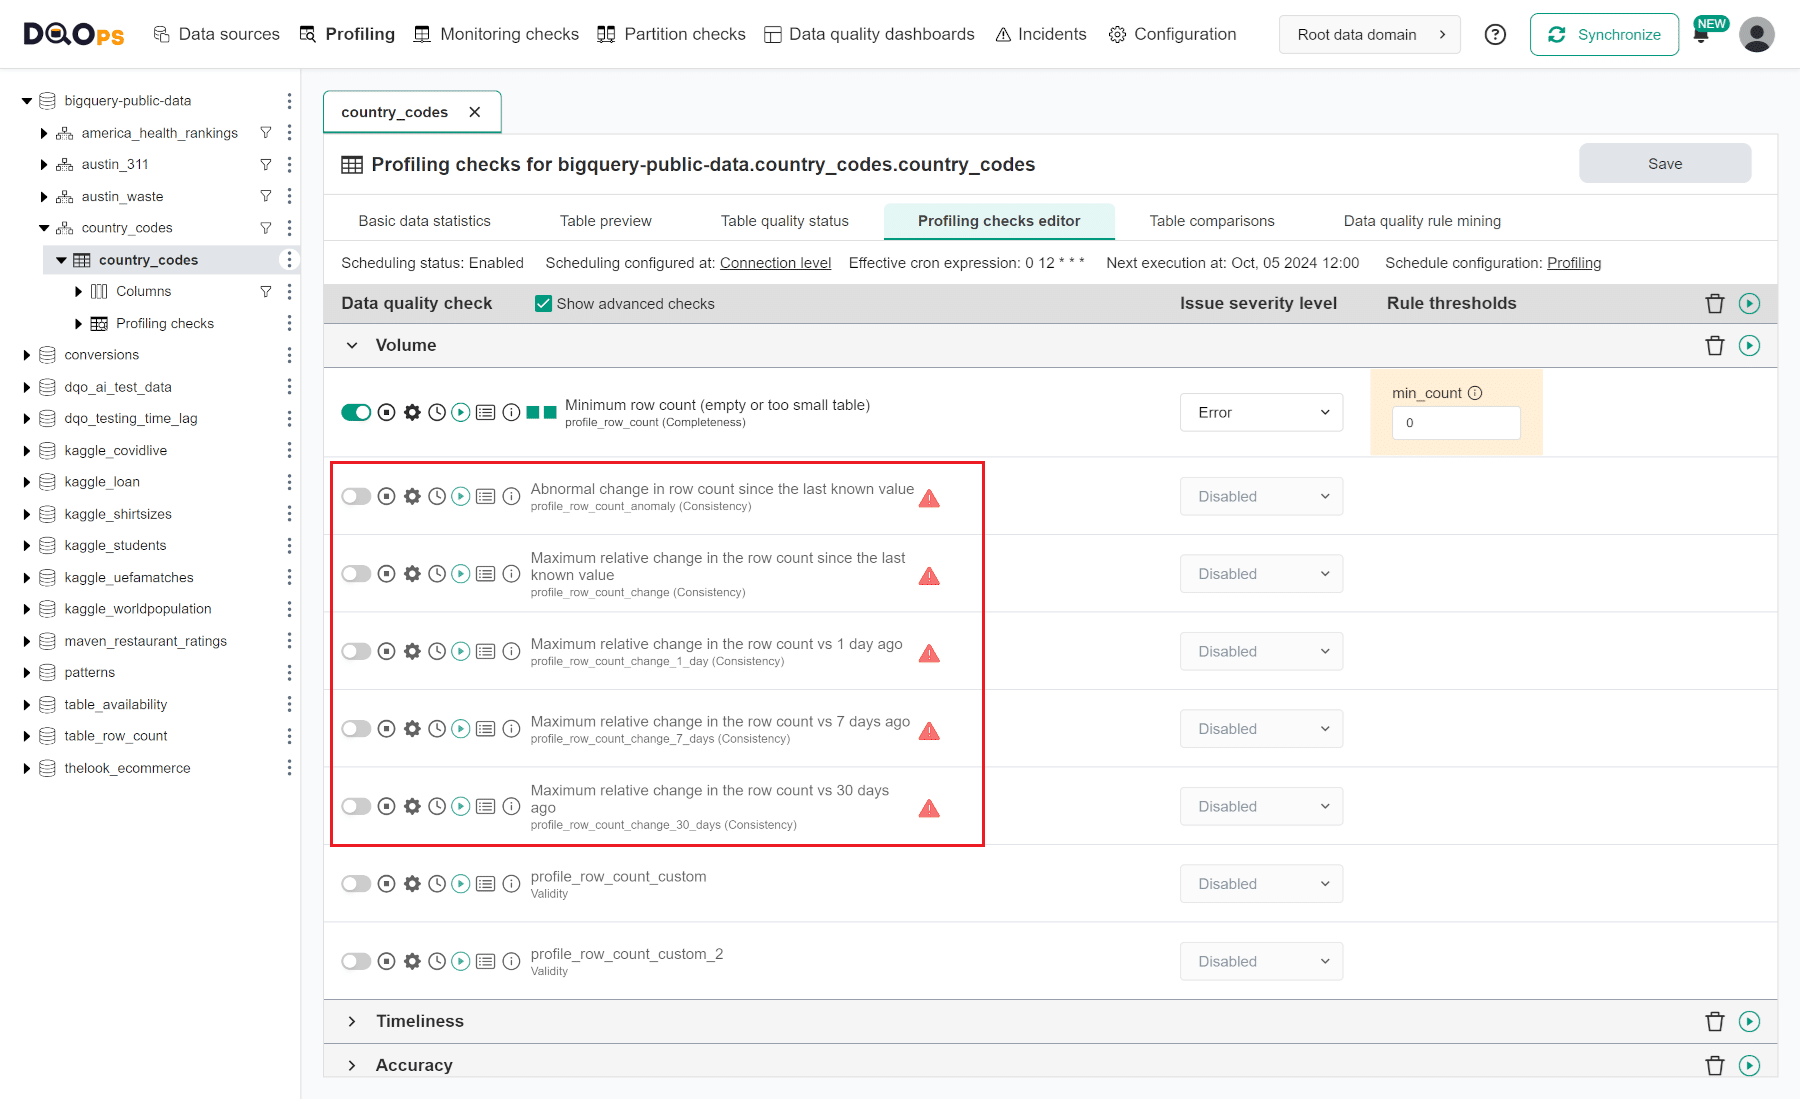
Do not activate any anomaly detection and relative value lookup checks as profiling checks, because anomaly detection depends on feeding a full history of data quality results at least at a daily scale. Profiling checks in DQOps store only one result per month, so the history of data quality results is limited. The following screenshot shows how the DQOps check editor presents anomaly detection checks that cannot be run, because there is not enough historical data to be used for prediction.
Profiling check configuration in DQOps YAML files
The configuration of active data quality profiling checks is stored in the .dqotable.yaml files. Please review the samples in the configuring table metadata article to learn more.
-
configuring table-level profiling checks shows how to configure profiling checks at a table level
-
configuring column-level profiling checks shows how to configure profiling checks at a column level
What's next
- Learn how to monitor data quality using monitoring checks.
- Learn how to analyze data quality of partitioned data using partition checks.
- Read the configuring table-level profiling checks and configuring column-level profiling checks to learn the details of configuring profiling checks in YAML files.
- Learn how to use profiling checks in the end-to-end data quality improvement process using DQOps.