Last updated: July 21, 2025
What is a Data Quality Check? Definition, Examples and Best Practices
Data quality checks are responsible for detecting data quality issues, and asserting the data quality requirements for monitored data sources.
Data quality check definition
In DQOps, a check is a data quality test that can be run on both table or column levels. The data quality check consists of a data quality sensor and a data quality rule.
The data quality sensor reads the value from the data source at a given point in time. The data quality rule includes a set of conditions (thresholds) that the sensor readout must meet. When the conditions are not met, the check detects an issue with your data, and it creates an incident that can be viewed, filtered, and managed.
The components involved in running a data quality check are shown below. The example below shows how DQOps performs the daily_row_count data quality check that verifies if the number of rows in the monitored table is greater than the expected minimum row count.

The data quality check is evaluated on a monitored table (or column) in three phases.
-
The placeholders for the table name (and column name) sensor template are filled in a templated SQL query (called a data quality sensor)
-
The generated SQL query is executed on the data source, capturing the data quality measure. It is expected that all data quality sensors in DQOps will return a result column named actual_value as a data measure, which will be evaluated with data quality rules.
-
The data quality metric (called sensor readout in DQOps) is passed to a data quality rule that is a Python function. The function determines if the measure (sensor readout) should be accepted or if the data quality check should fail and generate a data quality issue at one of three severity levels: warning, error, or fatal.
The data quality measure (sensor readout) is passed up to three data quality rules because data quality rules for warning, error, and fatal severity levels use different parameters (thresholds).
Activating data quality checks
DQOps user interface
Data quality checks are activated in the DQOps user interface on the data quality check editor.
There are two types of checks editors Simplified and Advanced. The primary difference lies in the ability to define multiple severity levels in the Advanced mode. Both types of editors share the same core functionalities, such as activation, deactivation and run of table and column-level checks, viewing results, and accessing additional settings.
The data quality check is activated by turning the green toggle button on the left to an ON position. The alerting thresholds for data quality issue severity levels are configured in the Warning threshold, Error threshold and Fatal threshold columns.
The following example shows Advanced checks editor with a daily_row_count data quality check that measures the row count captured for each day. It is a daily monitoring check type. The configuration of alerting rules are:
- raise a warning severity data quality issue when the row count (the number of countries) drops below 240
- raise an error severity data quality issue when the row count (the number of countries) drops below 100
- raise a fatal severity data quality issue when the table is empty, because the row count (the number of countries) is below 1

DQOps YAML files
Data quality checks are defined as YAML files that support code completion in code editors, such as Visual Studio Code.
Data quality check definitions can be stored in the source code repository, and versioned along with any other data
pipeline or machine learning code. The folder structure where DQOps stores those YAML files is called DQOps user home
and is documented in the configuring data quality checks article.
Below is an example of the YAML file showing a sample configuration of a profiling column data quality check profile_nulls_percent.
-
The node that contains configuration of checks. In this example, these are profiling checks defined at a column level.
-
The name of the check category. Check categories group similar checks.
-
The name of the configured check.
-
The warning severity rule configuration.
-
The error severity rule configuration.
-
The fatal severity rule configuration.
The spec section contains the details of the table, including the target schema and table name.
The columns section lists the columns in the table that has configured checks. In this example, the column named
target_column has a configured check profile_nulls_percent. This means that the sensor reads the percentage of null
values in target_column. If the percentage exceeds a certain threshold, an error, warning, or fatal message will
be raised.
The structure of the table configuration file is described in the configuring checks section.
Issue severity levels
Each data quality check supports setting the alerting thresholds at three severity levels: warning, error, and fatal. DQOps evaluates the sensor readout (the captured data quality metric, such as a percentage of null values) by three data quality rules, using different alerting thresholds configured as rule parameters. If multiple rules at different severity levels identify a data quality issue (the rule fails), DQOps picks the severity level of the most severe rule that failed in the following order: fatal, error, and warning.
The rule severity levels are described below.
Warning
The warning level alerting threshold raises warnings for less important data quality issues, usually anomalies or expected random or seasonal data quality issues. Warnings are not treated as data quality issues. Data quality checks that have not passed the warning alerting rule, but have passed the error and fatal alerting rules, are still counted as passed data quality checks and do not reduce the data quality KPIs score. Warnings should be used to identify potential data quality issues that should be monitored, but the data producer should not take accountability for them.
For example, a percentage of data quality check monitoring null value may raise a warning when the percentage of rows with a null value exceeds 1% of all rows.
Error
The error is the default alerting level for monitoring checks, comparable to the "error" level in logging libraries. Data quality checks that failed to pass the rule evaluation at the "error" severity level are considered failed data quality checks for the purpose of calculating the data quality KPI score.
For example, a percentage of data quality check monitoring null value may raise an error when the percentage of rows with a null value exceeds 5% of all rows.
Fatal
The fatal severity level is the highest alerting threshold that should only be used to identify severe data quality issues. These issues should result in stopping data pipelines before the issue spreads throughout the system. Fatal data quality issues are treated as failed data quality checks and reduce the data quality KPIs score. The fatal threshold should be used with caution. It is mainly useful when the data pipeline can trigger the data quality check assessment and wait for the result. If any data quality check raises a fatal data quality issue, the data pipeline should be stopped.
For example, a percentage of data quality check monitoring null value may raise a fatal alert when the percentage of rows with a null value exceeds 30% of all rows.
Rule severity matrix
The purpose of reporting data quality issues at different severity levels is summarized below.
| Alerting threshold | Data quality check passed | Data quality KPI result is decreased | Data pipeline should be stopped |
|---|---|---|---|
| Warning | |||
| Error (default) | |||
| Fatal |
Types of checks
In DQOps, data quality checks are divided into 3 types.
Profiling checks
Profiling checks are designed to assess the initial data quality score of a data source. Profiling checks are also useful for exploring and experimenting with various types of checks and determining the most suitable ones for regular data quality monitoring.
Monitoring checks
Monitoring checks are standard checks that monitor the data quality of a table or column. They can also be referred to as Data Observability checks. These checks capture a single data quality result for the entire table or column. There are two categories of monitoring checks: daily checks and monthly checks.
-
Daily monitoring checks capture the end-of-day data quality status of the monitored table or column. When they are run again during the day, the daily checks store only the most recent data quality status for that day.
-
Monthly monitoring checks capture the end-of-month data quality status of the monitored table or column. When they are run again during the month, they store only the most recent status for the current month, overwriting the previous data quality status from the previous evaluation during the current month.
Partition checks
Partition checks are designed to measure the data quality of partitioned data. In contrast to monitoring checks, partition checks capture a separate data quality result for each partition. To run a partition check, you need to select a column that serves as the time partitioning key for the data. Partition checks are also divided into two categories: daily checks and monthly checks. Partition checks are designed for incremental data quality monitoring.
Define custom check in DQOps user interface
You can easily change the rules and sensor associated with the checks in DQOps using the Configuration section of the user interface.
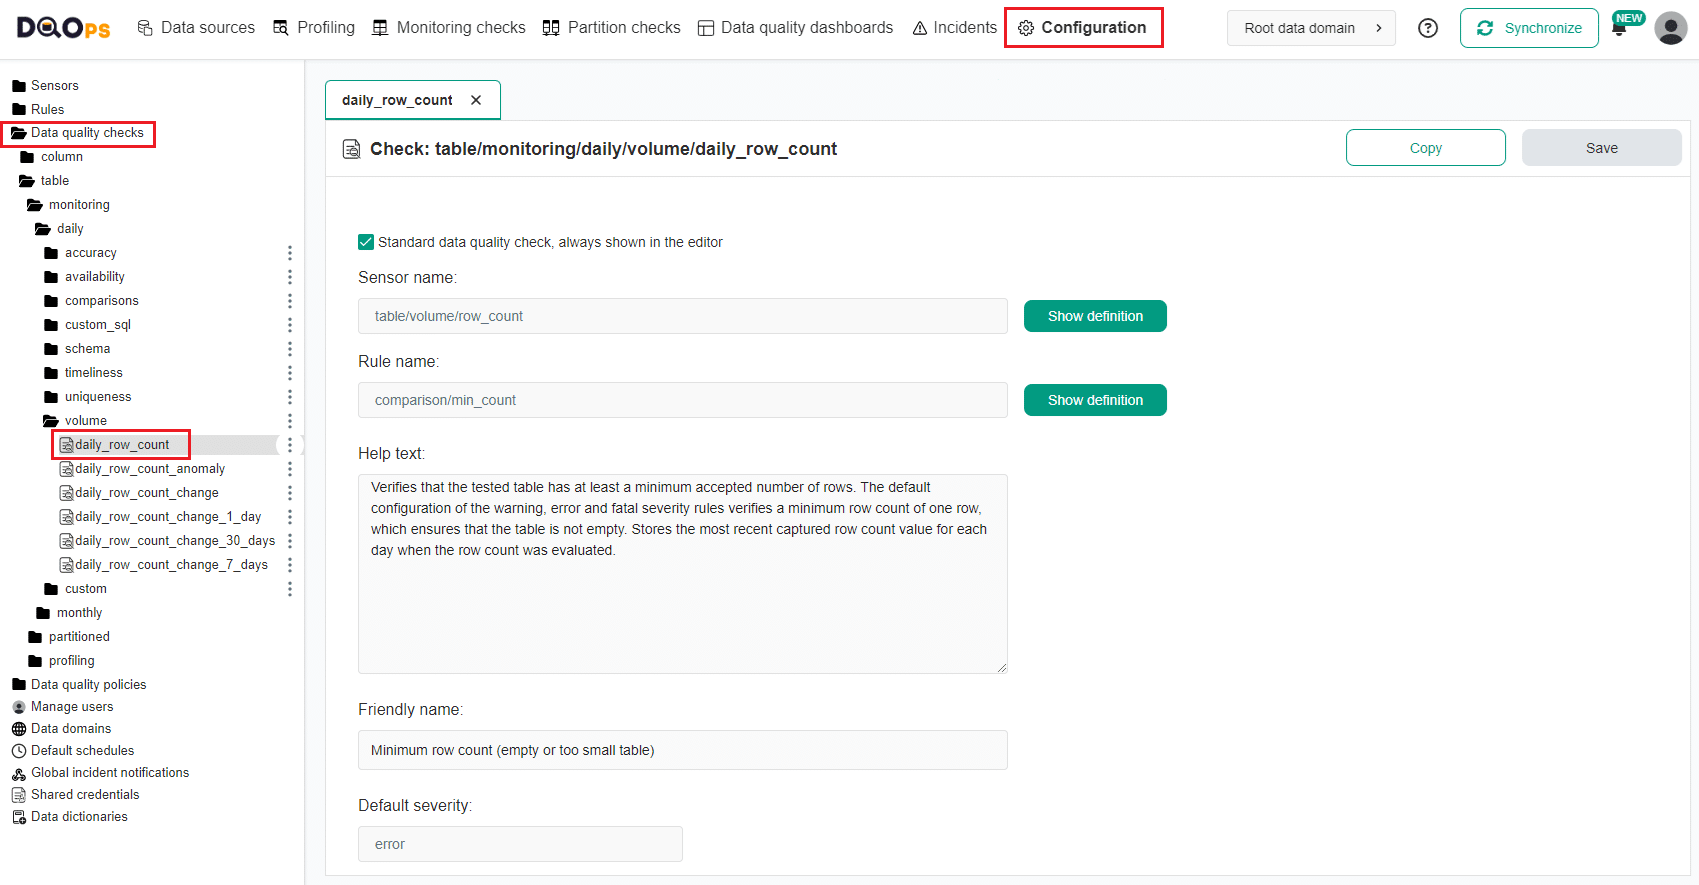
Check definition screen
Below is an example of the Configuration screen for the daily_row_count check.
This screen is responsible for editing the specification files for a custom data quality check
stored in the $DQO_USER_HOME/checks/**/*.dqocheck.yaml files.
FAQ
You will find a list of common questions about data quality checks and their answers.
What are quality checks?
Quality checks are simply tests we do to make sure something meets a certain standard. Think of it like inspecting a product before it leaves the factory.
When we talk about data quality checks, we're specifically testing our data to make sure it's accurate, complete, and consistent. We want to find any errors or inconsistencies that might cause problems later on. These checks might involve things like:
- Validation rules: Making sure data follows certain rules (e.g., email addresses are in the correct format).
- Completeness checks: Looking for missing values.
- Consistency checks: Checking for inconsistencies across different datasets.
What are data quality checks?
Data quality checks are tests we run to ensure our data is accurate and reliable. They help us uncover issues like missing values or values that don't conform to the expected format. These checks are performed using data quality tools that connect to our data sources and execute queries to validate the data.
What is data quality testing?
Data quality testing is the process of checking if the data stored in your databases is accurate and reliable.
It often happens when someone spots incorrect values in reports, dashboards, or business applications.
To do this testing, you'll use a data quality tool to run various checks on your data and pinpoint the source of the errors.
What are data quality checks examples?
Data quality checks help us validate our data in different ways. Here are a few examples:
- Completeness checks look for missing values in important columns.
- Pattern matching checks make sure data follows expected patterns, like an email address format or a phone number.
- Range checks make sure numerical data falls within an allowed range. For example, an age column might need to be between 0 and 100.
What is the definition of data quality?
Data quality refers to how accurate, complete, consistent, and reliable a dataset is for its intended use. High-quality data is free of errors and inconsistencies, conforms to defined business rules, and is available when and where it's needed. We ensure data quality by testing data with various data quality checks, which help us identify and fix any problems.
What is data quality monitoring?
Data quality monitoring is the process of continuously checking your data to make sure it stays accurate and reliable over time. This is usually done with a data observability tool that automatically runs data quality checks and tracks key metrics. These tools also detect schema changes (like when someone adds a new column) and watch for anomalies to catch unexpected errors.
What is data quality checking?
Data quality checking is the process of making sure your data is accurate and error-free. This involves running specific tests called "data quality checks" that are designed to catch common data errors. These checks can help you find things like missing values, incorrect formats, or inconsistencies in your data.
How to check data quality?
To check data quality, you'll need a data quality tool. Here's how it usually works:
-
Connect the tool to your data source (database, data warehouse, etc.).
-
Set up a list of data quality checks to detect common issues like missing values, invalid formats, or inconsistencies.
-
Let the tool scan your tables and identify potential errors.
This process is often called data quality monitoring. For ongoing data quality assurance, you'll want a data observability tool that automatically runs these checks at regular intervals and alerts you to any new errors.
What are the types of data quality checks?
There are many types of data quality checks, but here are some of the most common:
- Null checks find missing values in your data.
- Format checks make sure data follows the expected format, like for email addresses, phone numbers, or dates.
- Range checksmake sure numerical data falls within an allowed range (e.g., age should be between 0 and 120).
- Dictionary checks ensure data conforms to a predefined set of valid values. For example, a "state" column should contain a valid US state name.
You can find more data quality checks in the DQOps documentation. It is a data quality tool that supports over 150 checks.
What are data quality tests?
"Data quality tests" is just another way of saying "data quality checks." They're basically rules you define to make sure your data is accurate and meets your standards. For example, a data quality test could check that:
- Required columns always have a value.
- A price column never contains a negative number.
These tests help you find and fix errors before they cause problems in your reports, analyses, or applications.
How to make data quality checks?
You have a few options when it comes to creating data quality checks. You can write SQL queries that identify invalid records based on your specific criteria. For more complex scenarios, you might code custom checks using Python or another programming language. Some tools, like DQOps, allow you to build custom data quality checks without writing any code. You define the logic through a user-friendly interface instead. The best approach depends on your technical skills, the complexity of your checks, and the tools available to you.
What are the common data quality checks?
While the specific checks you'll need will depend on your data, here are some common ones that apply to most datasets:
- Completeness checks make sure there are no missing values in important columns across all your tables.
- Uniqueness checks look for duplicate records, especially in primary key columns or columns that should hold unique business identifiers.
- Pattern matching checks ensure that columns contain the correct type of data (e.g., numbers, dates, email addresses).
- Freshness checks test transactional data to make sure you have the most up-to-date information.
By implementing these checks, you can significantly improve the accuracy and reliability of your data.
How to perform data quality checks?
There are a couple of ways to perform data quality checks. You can use the built-in checks that most data quality tools provide. These allow you to simply select the parameters you want to validate, like the format of an email address or the range of allowed values. Alternatively, for more complex checks, you can write custom SQL queries that specifically target potential errors in your data. This method offers greater flexibility.
If you're looking for an extensible platform, DQOps is a tool that lets you create your own libraries of custom data quality checks without needing to write any code. You can then use these checks directly from the tool's user interface.
What is data quality control?
Data quality control is the ongoing effort to make sure your data is accurate, consistent, and error-free. It starts with defining clear standards for your data, outlining what constitutes "good" data and which types of errors are unacceptable.
Then, you use a data quality tool to connect to your data sources and configure checks that enforce those standards. The tool will automatically test your data at regular intervals, alerting you to any issues and helping you maintain high-quality data over time.
What is a data quality checklist?
A data quality checklist is essentially a to-do list for ensuring your data is top-notch. It guides you through the key steps of achieving and maintaining high-quality data. Here's a typical flow:
- Begin with data profiling to understand your data.
- Runs various data quality checks to assess the current state of your data. Identify any errors or inconsistencies.
- Sets up ongoing monitoring to automatically check your data for problems at regular intervals. This helps you catch and address issues quickly.
By following a data quality checklist, you can proactively manage your data quality and prevent costly errors down the line.
What is a data quality threshold?
Data quality thresholds define the acceptable limits for errors in your data. They help you set clear expectations for how clean your data needs to be. For instance, you might decide that it's okay to have missing email addresses for up to 20% of your customers. That 20% would be your threshold. You can also set thresholds for your entire dataset, like requiring that at least 99% of your data quality checks pass. These thresholds act as guardrails, helping you maintain consistent data quality over time.
What are data quality rules?
Data quality rules are like the criteria you set for your data to pass a test. They work in conjunction with data quality checks to determine if your data is valid. Think of it this way: a check gathers information about your data (like counting the number of rows), and then a rule evaluates that information against a specific threshold.
For example, you might have a rule that says a dataset is considered complete only if it has at least 1,000 records. If a data quality check finds only 800 records, the rule would flag this as a data quality issue. Essentially, rules help you enforce your data quality standards.
At what levels can you view data quality rules?
Not all data quality issues are created equal. Some might be minor annoyances, while others could signal serious problems. That's where data quality rules come in. You can configure them to raise alerts at different severity levels, helping you prioritize your response.
For example, let's say you have a rule that checks the number of rows in a table. You could set it up to:
- Raise a warning if the table has fewer than 1,000 records.
- Raise an error if the row count drops below 100 records.
- Raise a fatal error if the table is completely empty.
This tiered approach helps you focus on the most critical issues first.
What is a data quality score?
Think of a data quality score as a grade for your data. It's a metric that tells you how healthy your data is.
It is also called a data quality KPI. One common way to calculate this score is by looking at the percentage of data quality checks that your data passes.
So, a table with no failed checks would have a perfect score of 100%! This score helps you track data quality over time and quickly identify potential problem areas.
What is a data quality monitoring system?
A data quality monitoring system is a platform that constantly watches over your data and its metadata (table schema). It uses data quality checks to find any problems and then sends alerts to the right people, like administrators or data owners, whenever it spots an error. This helps you stay on top of your data quality and fix issues before they impact your business.
What is a data quality center?
A data quality center is a complete data quality management platform that combines data profiling, data quality assessment, and continuous data quality testing with data quality checks. It also supports data observability to detect unknown issues by using machine learning and anomaly detection. For example, DQOps Data Quality Operations Center is an example of such an end-to-end data quality management tool.
What are data quality errors?
Data quality errors are flaws in your data that indicate it's inaccurate, incomplete, or invalid. These errors can be as simple as a missing value or as complex as inconsistent data across different systems. We find these errors by running data quality checks – specialized tests that validate data and detect common problems.
In systems subject to regulatory compliance, it's often necessary to keep a record of these errors as an audit trail. This helps demonstrate compliance and track data quality improvements over time.
How to test data quality from Python?
The simplest and most reliable way to test data quality with Python is to use a dedicated data quality tool. These tools allow you to configure data quality checks for your dataset and then use their Python client to execute those checks.
While you could write data quality checks directly in Python, this approach can be harder to maintain. Plus, non-coding users like data analysts or data stewards won't be able to easily update the checks in the future. Using a data quality tool provides a more user-friendly and sustainable solution.
What are the basic data quality checks?
Basic data quality checks are the simplest types of tests you can run on your data. These often include:
- Null checks simply count the number of missing (NULL) values in a column.
- Range checks apply to numerical data and ensure values fall within an expected range. For example, you could check for negative values in an "age" column.
Other data quality checks tend to be more complex, requiring you to set additional parameters or define specific rules. But these basic checks are a good starting point for any data quality effort.
How data quality checks in SQL work?
SQL is a very powerful language for checking your data quality.
SQL data quality checks work by running queries against your datasets to find and count invalid records.
If there are errors, the query will return a count of the rows that have those errors.
For example, let's say you want to find any products with a price less than $1.00. You could use a SQL query like this:
What are machine learning data quality checks?
Machine learning data quality checks use fancy algorithms to find unusual patterns in your data over time.
These checks can:
- Spot anomalies in trends: For example, they might notice an unusual spike in the number of rows in your table on a Sunday.
- They can identify values that are unusually large or small compared to the rest of your data (data outliers).
Data observability tools often use these types of checks. They continuously monitor your data and store historical values to make it easier to spot these anomalies. You can use a data observability tool DQOps, which supports those type of checks out of the box.
Data cleaning fixes errors automatically, like typos or missing values. Data cleansing goes deeper, ensuring data is correct, often with manual checks.
What's next
- Learn how to configure data sources
- Learn how to configure data quality checks
- Learn how to run data quality checks
- Data quality checks do not need to be configured manually. Learn how the data quality rule mining engine can automatically propose and configure data quality checks to detect the most common data quality issues.
- Learn more about profiling checks
- Learn more about monitoring checks
- Learn more about partition checks
- Review the list of common data quality problems detected by DQOps, divided into categories of data quality checks