Last updated: July 05, 2025
What is Data Quality Rule Mining? Examples and Best Practices
Read this guide to learn how to automatically configure (mine) the rule thresholds in data quality checks to find the most common data quality issues.
Definition
Data quality rule mining automatically configures data quality checks, focusing on finding the most probable data quality issues.
What is data quality rule mining
Setting up data quality rules by hand and choosing the right threshold can take a lot of time. This is especially true because data quality checks will usually show that everything is okay. The real reason we set up these checks is to find those few data quality problems that are hard to see just by looking at the data.
DQOps makes this process automatic with its automated data quality rule mining engine. This engine analyzes both statistical summaries of the monitored table and sample values from the columns. You can specify a desired percentage of rows that can contain invalid records. DQOps will then examine the sample data and propose configurations for data quality checks that can detect the most common types of issues. These might include a few duplicate rows in a large table or some emails that do not match a well-known email format.
Besides configuring checks to find existing problems, DQOps also proposes checks that will pass for the current data. These checks serve as a baseline. If the data drifts over time and its distribution changes, these checks will fail, indicating that the data no longer resembles its structure at the time of profiling.
Data profiling
In the data profiling stage, DQOps gathers basic data statistics and sample values from a table and its columns. DQOps collects basic statistics automatically for every table you register in DQOps. But it also has a second step that's more advanced. It can test your data with different profiling checks to find the most common data quality issues. You can do this step in a few ways:
- manually using the data quality check editor,
- semi-automatically by enabling data quality checks for all matching tables and columns using data quality policies,
- letting DQOps suggest the configuration of data quality checks for you and then review the problems it finds in your data.
Information used for proposing checks
DQOps uses all information collected during basic profiling to propose a reasonable configuration of data quality checks. The data sources are described below.
Basic data statistics
The data quality rule miner uses the following data captured as basic statistics to configure data quality rule thresholds.
-
Table volume to configure the minimum accepted row count.
-
Column counts to configure the expected column count and detect when it changes.
-
The range of values in numeric columns, especially the minimum, maximum, and mean (average) values. DQOps will set up data quality checks to detect when values out of the range appear in the table.
-
The range of date and timestamp columns. DQOps will detect obviously invalid dates, such as 1970-01-01 or 2099-12-31, which are often used as placeholder values for null values. The most recent date found in the column used to configure data timeliness checks (the timestamp of an event or transaction) will be used to configure a maximum delay in data freshness checks.
-
The text length statistics of text columns, such as the minimum, maximum, and mean length of text columns. Similarly to numeric columns, DQOps will configure checks that will detect text values that are too short or too long in the future.
-
The minimum and maximum word count of text columns, which can provide a helpful way to analyze the quality of data used for Generative AI use cases.
-
Detected data types in text columns containing, if the column contains only boolean, numeric, or date values. The check configured by the DQOps rule miner can be used to analyze raw data in landing zones.
-
Data completeness statistics, such as the number of null values in a column. When a column contains just a few null values, and their count is below the desired percentage of error records, DQOps will configure the data quality checks to raise data completeness issues for these columns.
-
Data uniqueness statistics for each column. DQOps will use this information to configure duplicate detection checks for columns containing just a few duplicate values that must be invalid or configure the distinct count checks to monitor the number of distinct values to stay in range.
Data samples
DQOps configures several data quality checks using sample values captured from each column. The types of data quality checks configured by the rule mining engine are listed below.
-
DQOps captures the top 100 most common values in each column. If the number of distinct values is below 100 and the captured sample values cover all possible values in a column, DQOps will configure the values_found_in_set_percent dictionary checks. If some values captured in the data samples are rare and present in less than the expected percentage of erroneous rows (the default is 2% of records), DQOps will not include these values in the list of accepted values. Running the data quality checks in the accepted values category will generate data quality issues, and the error samples will show these invalid values.
When a data dictionary containing valid values is already defined in DQOps, and the majority of column values are present in any of the data dictionaries defined by the user, the rule mining engine will configure the values in set checks to use that dictionary. This algorithm will configure data quality checks to detect values not present in the dictionary.
-
The sample values are also used to configure the expected_texts_in_top_values checks, ensuring that the most common values are always the same in the data set over time.
-
Text values are analyzed for well-known patterns, such as UUID identifiers, emails, phone numbers, ISO country codes, or currency codes. When DQOps detects columns mainly containing these values, relevant pattern validation checks are automatically configured.
-
DQOps will detect column values containing possible patterns that can be analyzed with regular expressions. Suppose the sample column values contain texts of at least three components, such as numbers, texts, and special characters, such as
A/2024/11-C. In that case, DQOps will propose a regular expression pattern that will detect values that do not match the pattern.
Results of data profiling checks
The rule mining engine is not limited to data quality checks that can be configured using sample values or data statistics. Users can use the data observability policies (data quality patterns) to configure data profiling checks without any data quality rules enabled. These checks will only capture the sensor readouts (the data quality metrics) without evaluating them with data quality rules.
By default, the Profile text columns to detect PII values (sensitive data) policy is enabled in the PII (Personal Identifiable Information) check category to detect columns containing sensitive values, such as emails or phone numbers inside comment columns. When the rule mining engine notices that the contains_email_percent check finds 1% of records containing emails and the desired error rate is 2%, DQOps will configure the contains_email_percent check with a max_percent threshold 0%, identifying all these records as values containing a possible data leak.
DQOps rule miner also supports custom data quality checks as long as they use built-in data quality rules, such as the max_percent rule.
The data quality results of the profiling checks are used further in DQOps when activating data quality checks for continuous data quality monitoring in the monitoring or partition sections.
Data quality check configuration steps
Follow these steps to configure the data quality lifecycle process in DQOps.
Basic data profiling
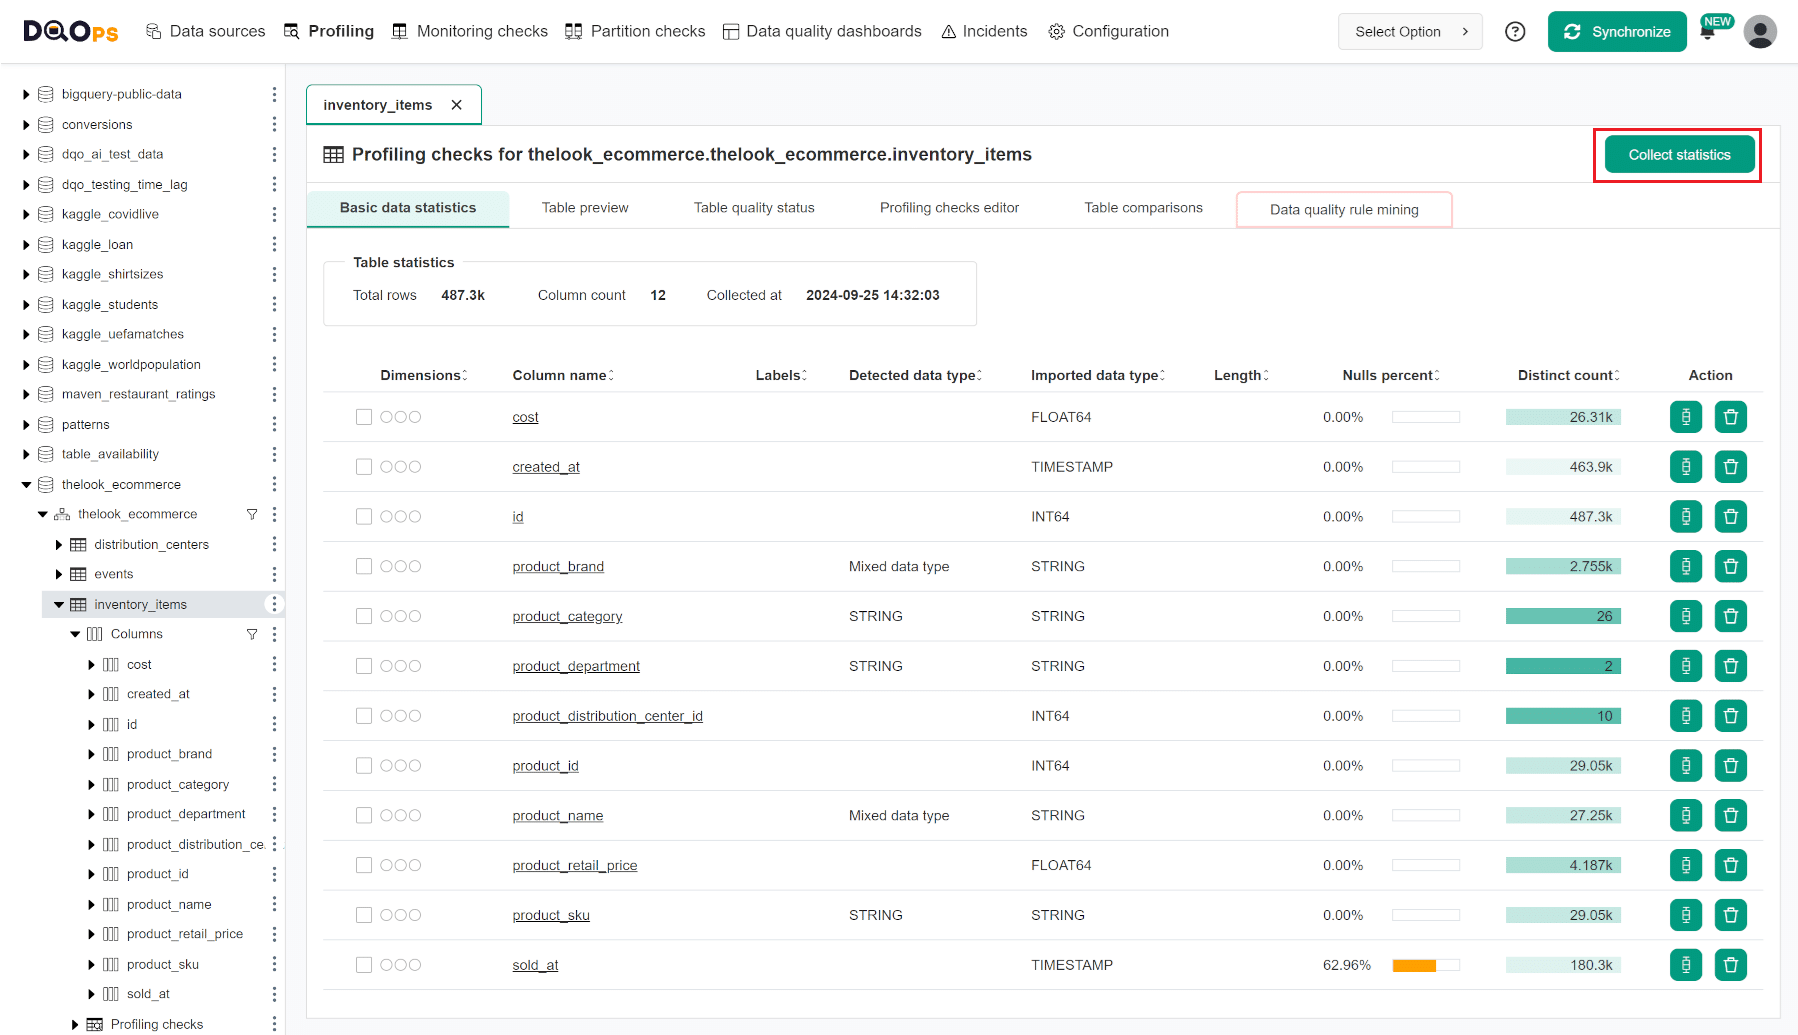
The first step of generating data quality rule configuration in DQOps, as part of a data quality assessment process, is collecting basic data statistics.
DQOps starts a statistics collection job for every table imported into DQOps using the user interface. If the basic statistics are outdated or statistics collection has been stopped, the user can click the Collect statistics button and wait until the screen shows the scale of null and distinct values for each column.
Propose a configuration of data quality checks using rule mining
After collecting the basic statistics and column value samples, the rule mining screen can propose a configuration of data quality checks. To navigate to the rule miner, click on the Data quality rule mining tab in the Profiling section.
The rule mining screen allows you to view and select the automatically proposed configuration of data quality checks. DQOps proposes a list of data quality checks instantly upon entering the rule mining screen. If any parameter configuration is changed, clicking the Propose button will generate a new proposal. Use the Apply button to save (apply) the proposed check configuration.
The most critical configuration parameter of the DQOps data quality rule miner is the desired Error rate. It is a percentage of errors that can contain invalid values. The default value of the Error rate is 2%. DQOps will try to configure data quality checks in a way the data quality checks will detect data quality issues in 2% of records containing the most outstanding values.
The following screen shows how DQOps proposed the configuration of data quality checks. The rule miner shows proposed configurations as a list of checks divided by table, columns, and check types. The column names can be expanded to view the proposed checks.

Below is an example of all proposed checks for the product_department column. Before applying the proposed configuration,
you can change the proposed data quality check parameters and data quality rule thresholds.

Managing data dictionaries
DQOps rule mining engine uses the list of most popular values in each text column to propose the configuration of Accepted values checks.
You can modify the list of expected_values parameter by clicking on the Modify button.

The list of values does not need to be entered directly for each check. DQOps supports using data dictionaries, which are stored as simple CSV files. The list of valid values can be copied to a data dictionary and replaced with a reference to the data dictionary.

The data dictionary is created by clicking the Convert to dictionary button, entering the desired dictionary name, and clicking the Save button.

Data quality check selection
If you disagree with the proposed data quality checks configuration, DQOps supports two ways to exclude them.
The first option is to use the toggle button to deactivate these checks from the proposal. In that case, DQOps will propose these data quality checks the next time any user opens the rule mining screen.

Another option is to disable the data quality check, which excludes it from execution and further proposals. Click on the Disable button next to the toggle button. The button will turn into the red stop icon and the check will be disabled.

Apply the proposed check configuration
DQOps does not save the proposed configuration of data quality checks until the user presses the Apply button.

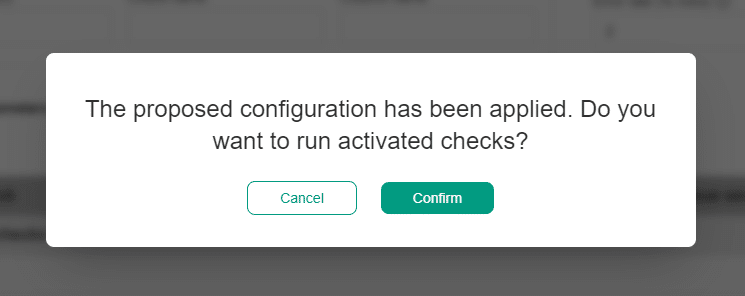
Pressing the Apply button saves the configuration of data quality checks and their rules. A popup window will appear, notifying you that the checks have been activated and that you can run the activated check by clicking on the Confirm button.
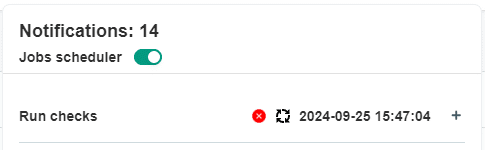
The progress of running the data quality checks can be tracked in the notification panel that shows the progress of running jobs in real-time. The Run checks job will run as long as the circle icon highlighted below is visible.
Data quality health review
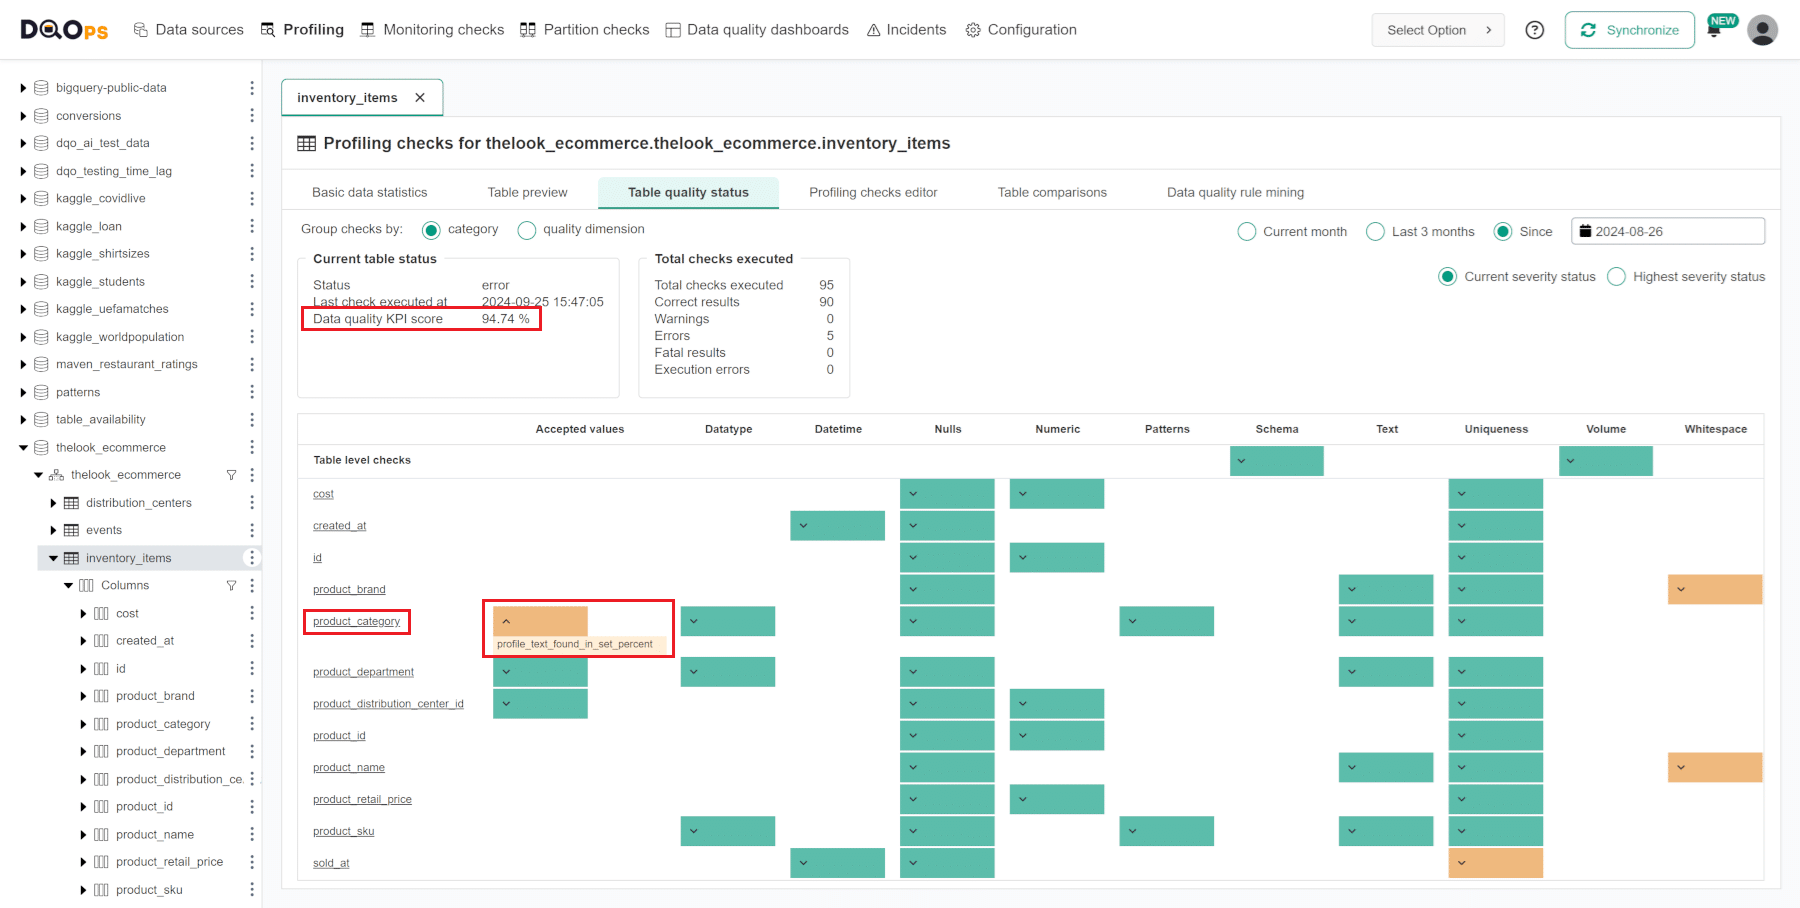
After the Run checks job finishes, as shown in the screenshot below, you can review the summary of the identified data quality issues on the Table quality status screen. Click on the Table quality status tab to navigate to that screen.

The Table quality status screen summarizes data quality issues identified for each column and each category of data quality checks. It includes the number of executed checks and detailed results per table and columns grouped by check categories or data quality dimensions. DQOps calculates a data quality KPI score, which is measured as the percentage of data quality checks that passed successfully.
At the bottom of the screen, you will find a table that displays the check results per category, table, and column.
The colored boxes indicate the current or the highest severity status: green for a correct result, yellow for a warning, orange for an error, red for a fatal error, and grey stripes for an execution error.
You can click on the colored box to view a list of checks that contribute to the result. Hovering over the check name will provide more details. Clicking on the name of the column will navigate you to a detailed data quality check editor screen.
Data quality issue review
You can review more detailed check results and error samples on data quality check editor screen. You can find more information about the check editor in the User interface overview section of the documentation.
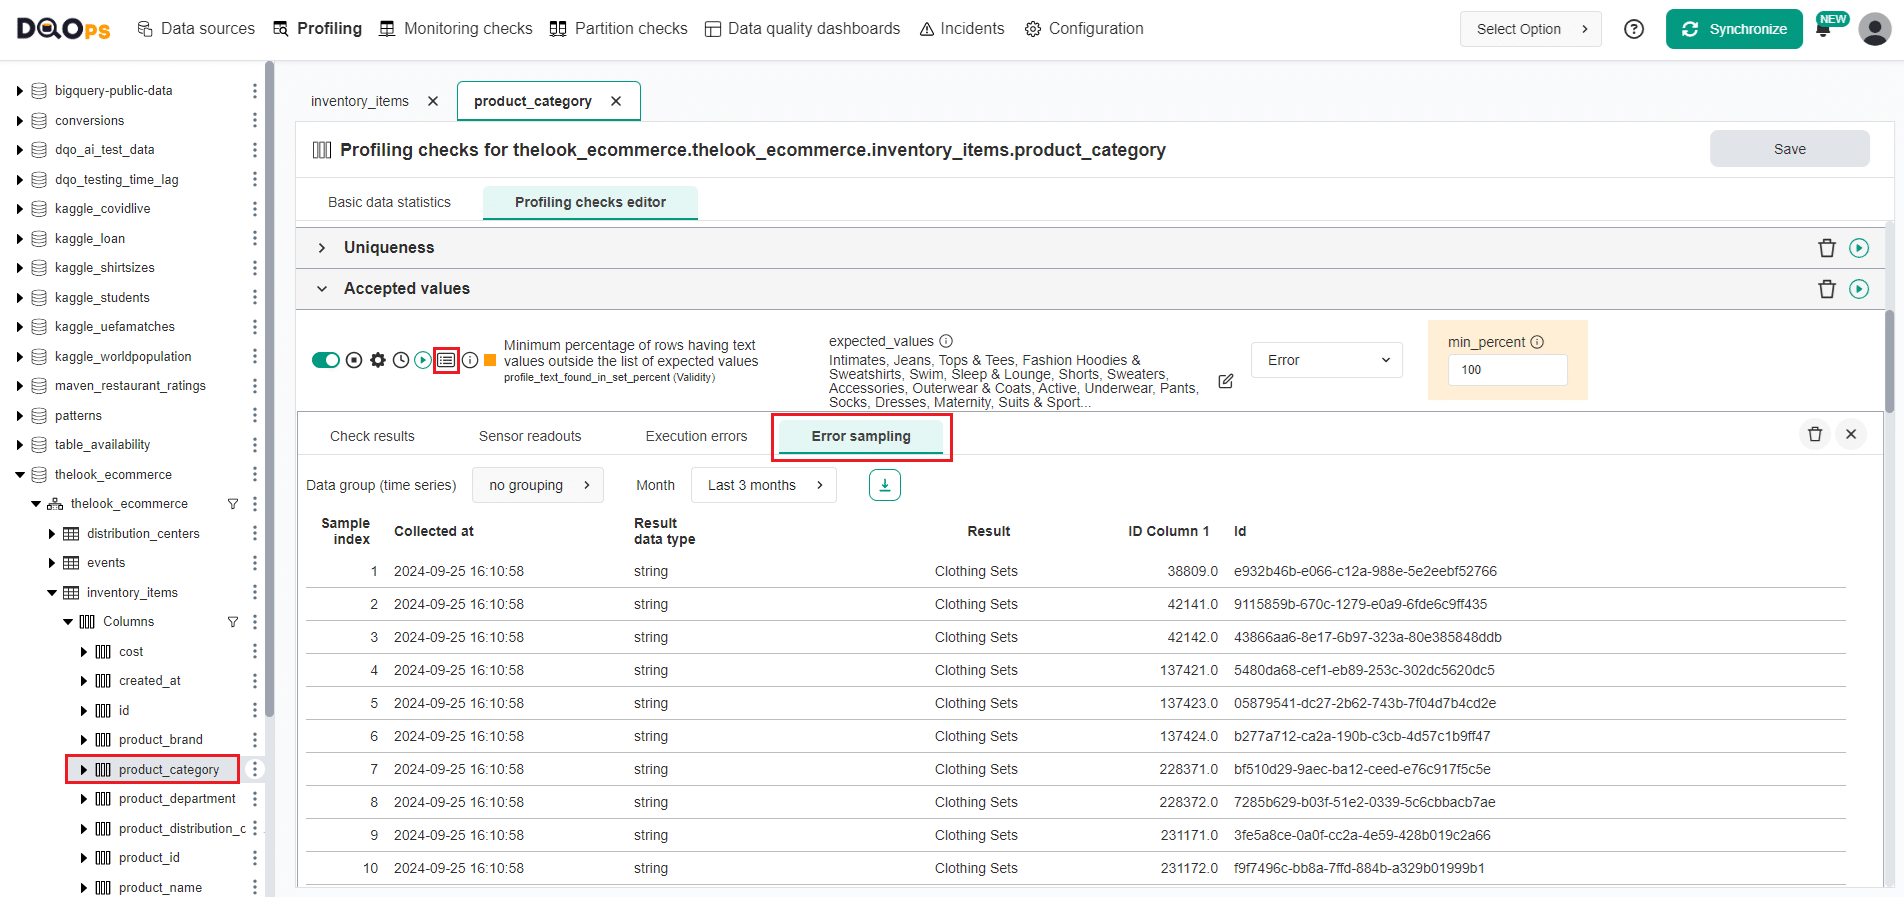
To review the check results, click the Results icon. You can view representative examples of data that do not meet the specified data quality criteria by clicking on the Error sampling tab in the results section.
DQOps will collect error samples of invalid values that did not pass the data quality check evaluation.
In the following example, the rule mining engine configured a desired list of column values, but the Clothing Sets value was scarce and was present in less than 2% of records.
Because the desired percentage of invalid rows was 2%, DQOps did not add this value to the list of accepted values, assuming it is invalid.
If this value is valid, the list of the expected_values should be updated in the editor to include that value.
Disabling false-positive checks
The rule mining editor can suggest configurations for checks that may result in false positives. These occur when the checks are set to aggressively identify a certain percentage of invalid records. After reviewing error samples, the best way to handle these checks is to disable them.
After making any changes, click the Save button at the top right of the screen to save configuration changes.

Rule miner parameters
This section describes the configuration parameters shown at the top of the rule mining screen.
Briefly, you can customize the rule miner proposals with the following options:
- Filtering by check category, check name, and column name: You can use these filtering options to narrow down the list of proposals by specifying check category, check name, or column name.
- Error rate (% of rows): The most critical configuration parameter of the rule miner to control its sensitivity. It represents the percentage of errors that can contain invalid values. By default, it is set to 2%, but you can change this value. DQOps will attempt to configure data quality checks to detect data quality issues in 2% of records containing the most outstanding values.
- Default severity level: This is used to set the initial severity level for proposed checks, which can be later modified individually.
- Advanced parameters: These parameters contains checkboxes that allows control how the rule mining engine handles already configured data quality checks and select data quality check categories that you want to include in the proposal.
Propose checks for a column
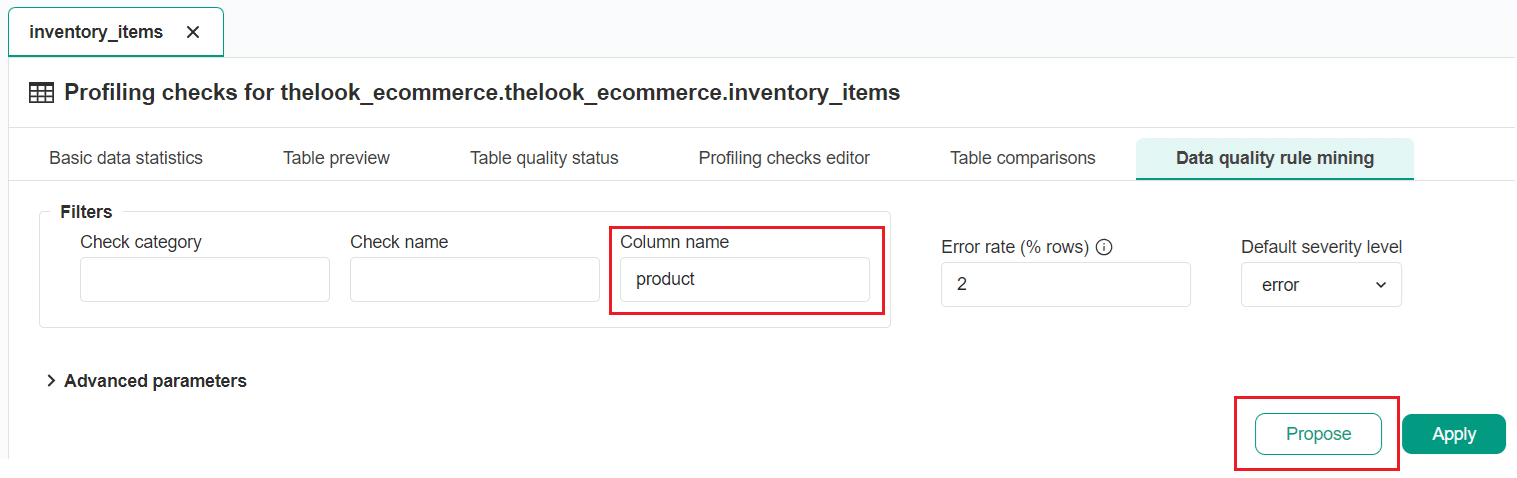
You can filter the list of data quality check proposals by one or multiple columns that contain the same text in the column name.
For example, if you want to narrow down the list of proposals to columns that contain the word "product", simply enter "product" in the filter field to see relevant check proposals.
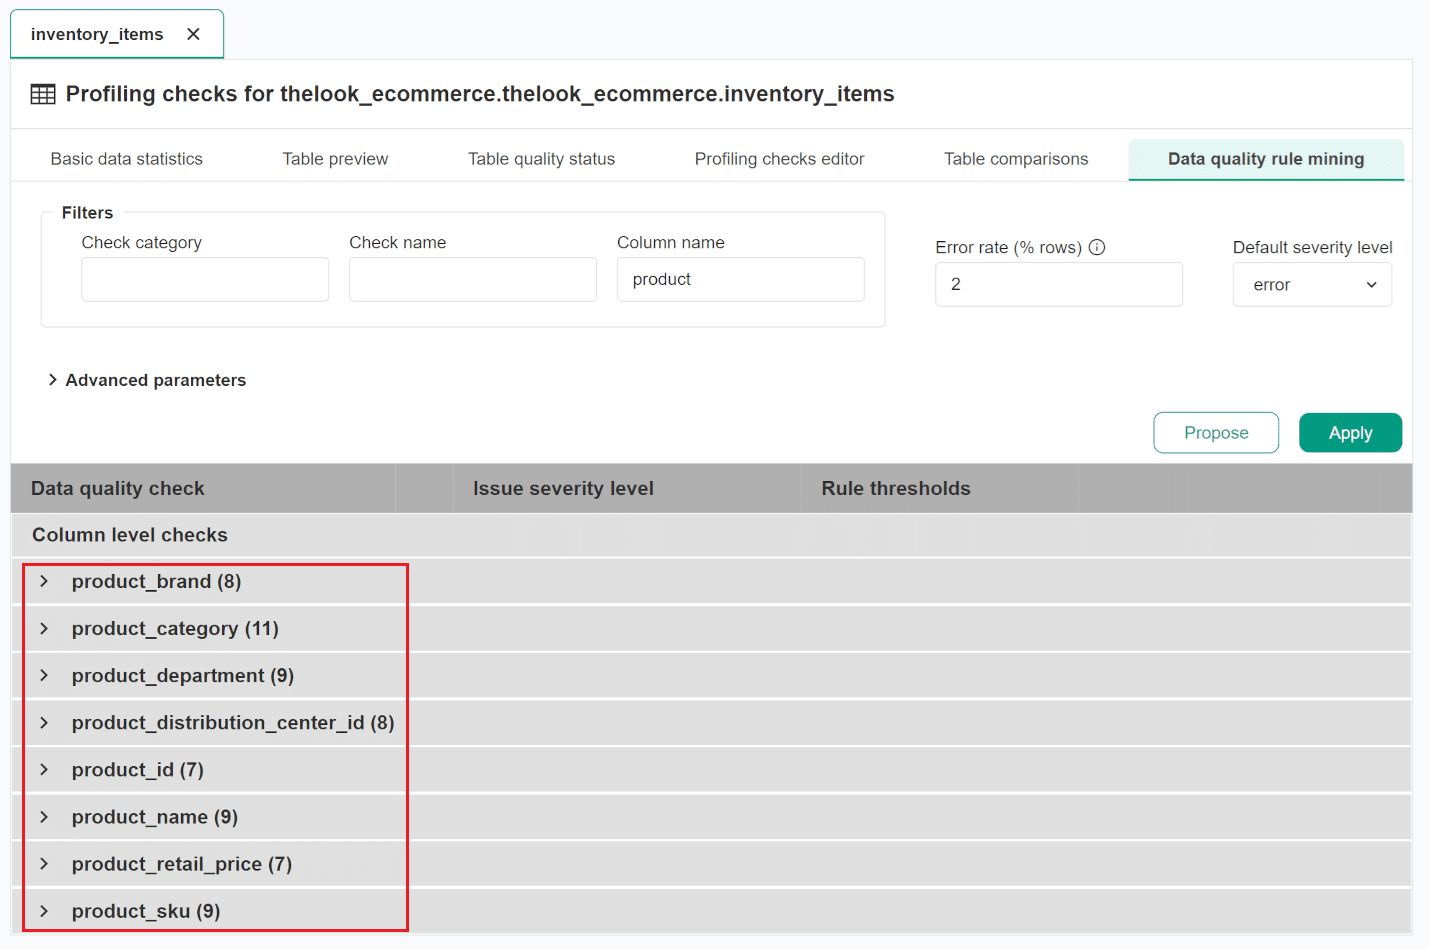
After clicking the Propose button, the rule engine will generate a new proposal for check configuration.
The table has eight columns containing the word "product".
Advanced rule miner parameters
The advanced rule miner's parameters are divided into two groups:
- The controls of how the rule mining engine handles already configured data quality checks.
- Selection of specific data quality check categories that you want the rule miner to include when generating a proposal.

The first group of parameters becomes particularly important when copying the verified profiling checks to table monitoring checks and partition monitoring checks. This process is explained in detail later in this guide.
The following table describes in detail the first group of the parameters.
| Parameter name | Description |
|---|---|
| Copy failed profiling checks | Copy the configuration of profiling checks that failed during the last execution. The preferred approach is to review the profiling checks, disable false-positive checks, and enable this configuration to copy the reviewed checks to the monitoring and partitioned checks for continuous monitoring. |
| Copy disabled profiling checks | Copy the configuration of disabled profiling checks. This option is effective for monitoring or partitioned checks only. By default it is disabled, leaving failed or incorrectly configured profiling checks only in the profiling section to avoid decreasing the data quality KPI. |
| Copy profiling checks | Copy the configuration of enabled profiling checks to the monitoring or partitioned checks. This option is effective for monitoring or partitioned checks only. By default it is enabled, allowing to migrate configured profiling checks to the monitoring section to enable Data Observability of these checks. |
| Tune quality policy checks | Reconfigure the rule thresholds of data quality checks that were activated using data observability rule patterns (data quality policies). |
The following table describes the second set of parameters that can be used to control the quality check categories included in the rule mining proposal.
| Data quality checks | Description |
|---|---|
| Minimum row count | Configure the minimum row count based on the basic statistics captured from the table. |
| Expected columns count | Configure a table schema check that ensures that the count of column stays the same as the count of columns detected during data profiling. |
| Column exists | Configure a column exists check for each column to report when the column is no longer present. |
| Timeliness checks | Configure all types of table's timeliness checks (freshness, staleness, ingestion delay). This option works only when the table is correctly configured to be analyzable by timeliness check, and has the timestamp column selected in the configuration of the table in the Data sources section. |
| Nulls (prohibit nulls) | Configure data quality checks that detect columns that have some null values in columns. When the percentage of null columns is below the value of the 'Error rate (% rows)' field, DQOps will raise a data quality issue when any null values are detected. |
| Not nulls (require nulls) | Configure data quality checks that require columns already containing null values to contain some null values. This option could be desirable in some rare cases. |
| Detected datatype in texts | Configure a check that verifies all values in a text column and detects a common data type. If all column values match the same data type, such as integers, floats, dates or timestamps, DQOps will configure a check that will monitor if any values not matching that data type appear in the column. This check is usable for raw tables in the landing zone. |
| Uniqueness checks | Configure uniqueness checks that detect columns with just a few duplicate values, and columns with a relatively low number of distinct values. DQOps will monitor if duplicate values appear, or the number of distinct values increases. |
| Numeric values ranges | Validate the values in numeric columns to detect if the values fall within the ranges that were observed during data profiling. DQOps will try to configure the min, max and *mean' checks. |
| Median and percentile ranges | Propose the default configuration of the median and percentile in range checks that validate the value at a given percentile, such as a value the in middle of all column values. The default value of this parameter is 'false' because calculating the median requires running a separate query on the data source, which is not advisable for data observability. |
| Text length ranges | Configure the checks that analyze text statistics of text columns, such as the minimum and maximum length of text values. |
| Word count in range | Propose the default configuration of the minimum and maximum word count of text columns. DQOps applies this checks when the minimum and maximum row count is at least 3 words. |
| Percent of true/false | Configure the checks that analyze boolean values and will configure a range percent check for the less common value (true or false). |
| Dates out of range | Configure the checks that detect invalid dates that are far in the past, or far in the future. |
| Values in a set (dictionary) | Proposes the configuration the categorical values checks value_in_set_percent from the accepted_values category. These checks will be configured to ensure that the column contains only sample values that were identified during data profiling. |
| Treat rare values as invalid | Configure the value_in_set_percent checks from the accepted_values category to raise data quality issues for rare values. DQOps will not add rare categorical values to the list of expected values. |
| Texts in top values | Propose the configuration the texts_in_top_values check from the accepted_values category. This check find the most common values in a table and ensures that they are the same values that were identified during data profiling. |
| Texts parsable to data types | Proposes the configuration the data type conversion checks that verify if text values can be converted to more specific data types such as boolean, date, float or integer. This type of checks are used to verify raw tables in the landing zones. |
| Standard text patterns | Propose the default configuration for the patterns check that validate the format of popular text patterns, such as UUIDs, phone numbers, or emails. DQOps will configure these data quality checks when analyzed columns contain enough values matching a standard pattern. |
| Detect regular expressions | Analyze sample text values and try to find a regular expression that detects valid values similar to the sample values. |
| Whitespace checks | Propose the default configuration for the whitespace detection checks. Whitespace checks detect common data quality issues with storing text representations of null values, such as null, None, n/a and other texts that should be stored as regular NULL values. |
| Apply PII check rules | Applies rules to Personal Identifiable Information checks (sensitive data), but only when the checks were activated manually as profiling checks, or through a data quality check pattern that scans all columns for PII data. |
| Custom checks | Custom data quality checks must use DQOps built-in data quality rules, such as max_percent, min_percent or max_count to find invalid values. |
Data quality monitoring
The next phase after performing the data quality assessment is configuring data observability, which involves continuous monitoring of data quality.
DQOps will use its CRON scheduler to evaluate data quality daily and raise incidents for identified data quality issues.
Enabling reviewed data quality checks for continuous data quality monitoring
The principal idea behind DQOps is its two-stage data quality check review process. In the first stage, users should assess data quality by configuring data profiling checks to identify data quality issues.
The second step involves reviewing false-positive data quality checks. Any incorrectly configured checks should be disabled, as shown before.
Once the list of active data profiling checks is limited only to approved checks that are either passing or detecting acknowledged data quality issues, switch to the Monitoring checks section of DQOps. Use the rule mining screen again to copy the configuration of checks from the Profiling section to the Monitoring checks section. This allows DQOps continuously evaluate only valid checks.
The rule mining screen on the Monitoring checks and Partition sections works slightly differently. In the Monitoring checks section, the rule miner primarily functions as a copy tool. Its primary purpose is to replicate data quality checks and their parameters that were previously configured and activated using the rule miner within the Profiling section. It does not generate new check proposals.
Copy the verified profiling check to the monitoring checks
The monitoring checks in DQOps perform regular full-table scans and analyze small to medium-sized tables or tables in which any row could be updated, such as a price list table.
To copy the configuration of checks activated in the Profiling section to Monitoring checks:
- Navigate to the Monitoring checks section.
- Select the table from the tree view on the left.
- Click on the Copy verified profiling checks tab.
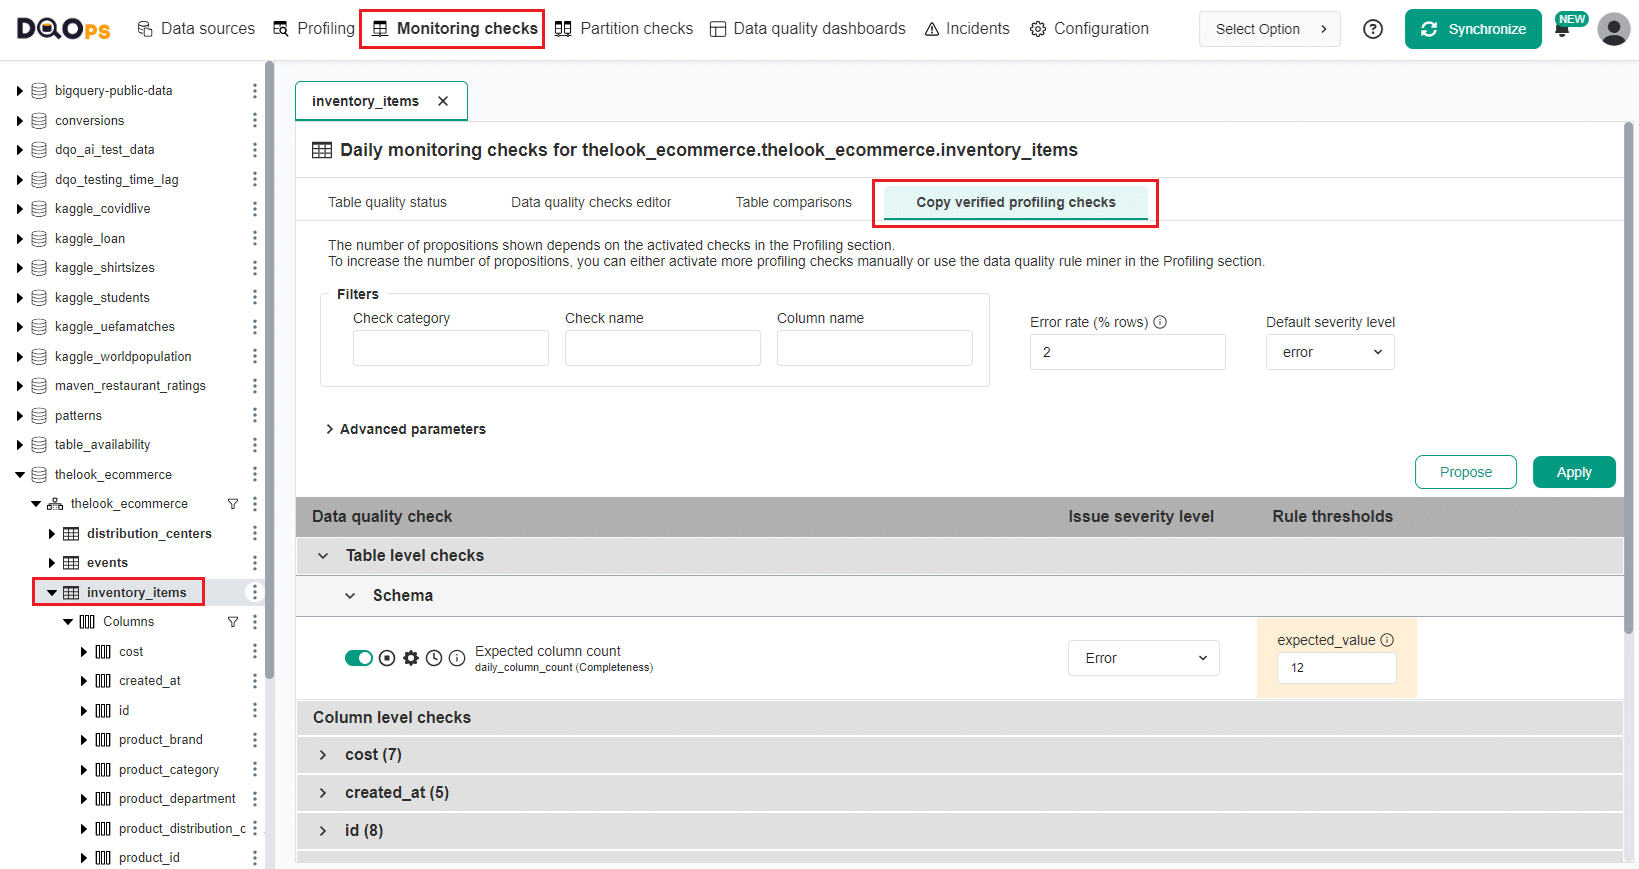
Here you can see a proposition of checks based on the activated checks in the Profiling section. You can choose which checks to include in the monitoring by excluding others (deactivating or disabling them). You can also modify the parameters of the proposed data quality checks and the thresholds for data quality rules. To increase the number of propositions, you can either manually activate more profiling checks or use the data quality rule miner in the Profiling section.
Click on the Apply button to save the configuration of monitoring checks
A popup window will appear, notifying you that the checks have been activated and that you can run the activated check by clicking on the Confirm button.
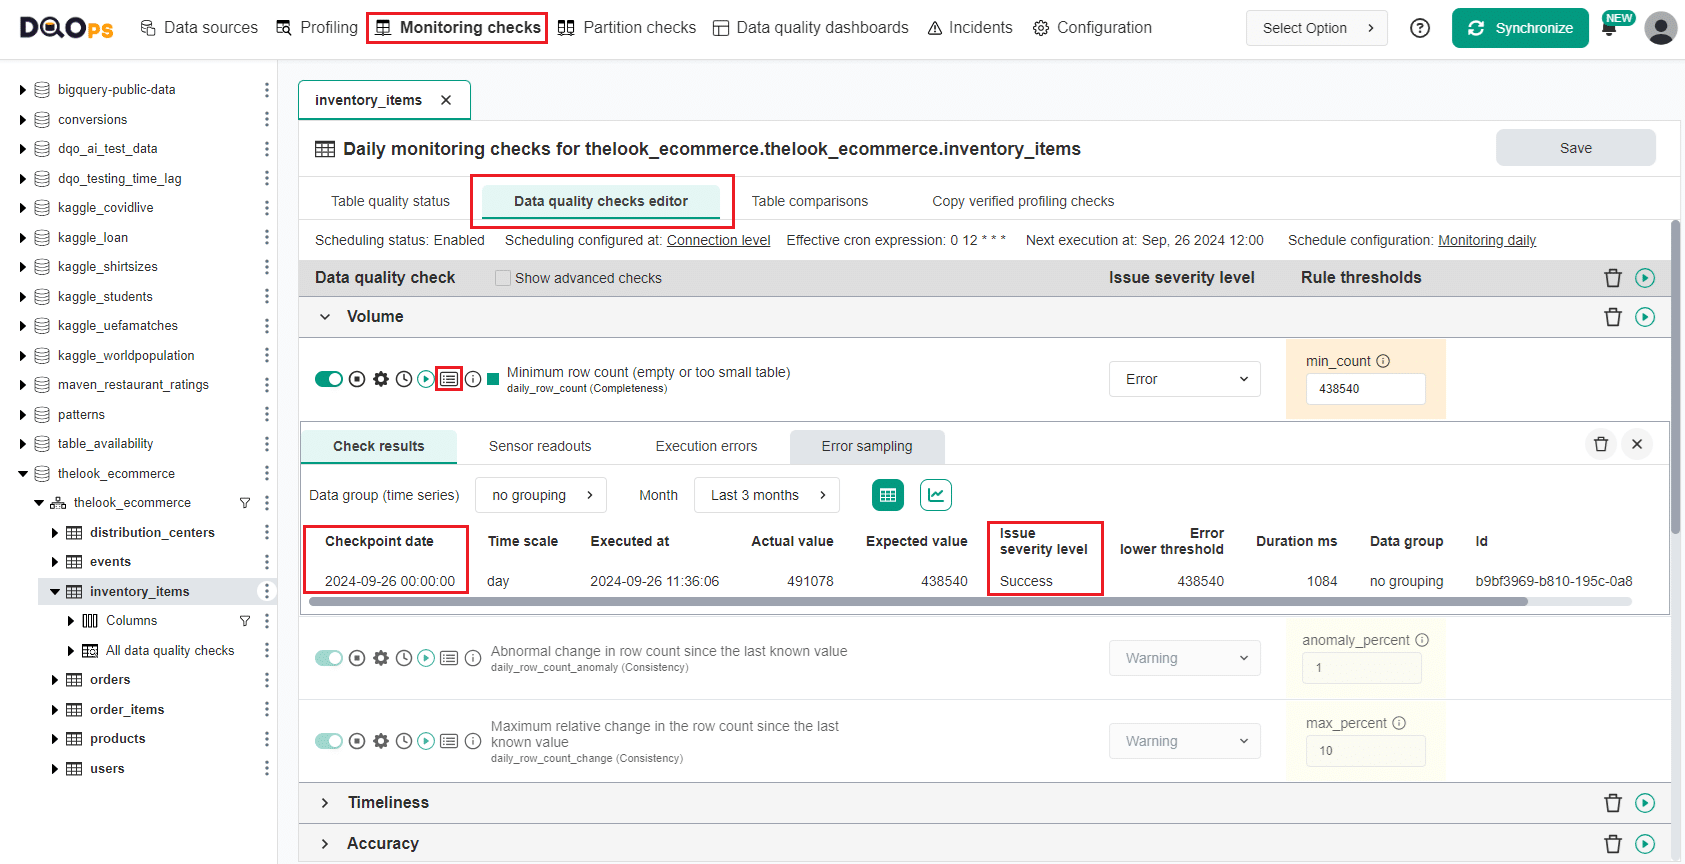
You can now review the result on the Table quality status or detailed results in the Data quality checks editor.
The screenshot below shows the data quality check result captured during the first check execution. DQOps will store one checkpoint per day for daily monitoring checks.
Copy the verified profiling check to partition checks
Configuring partition checks that validate partitioned data is similar to configuring monitoring checks. Please read the partition check description because DQOps requires additional configuration to enable these types of checks. Partition checks require selecting the date or timestamp column used for time partitioning.
What's next
- Get familiar with the DQOps user interface
- Learn how to connect data sources
- Learn how to configure data quality checks