Last updated: July 05, 2025
How to Detect Data Quality Issues with Data Observability
Read this guide to learn how to automatically activate data quality checks to profile data and monitor the most common data quality issues or anomalies.
Purpose of data observability
Data observability is a critical practice within data management aimed at ensuring that data pipelines and processes are transparent, reliable, and understandable. At its core, data observability provides organizations with the ability to monitor, understand, and troubleshoot their data infrastructure in real-time.
This includes monitoring data ingestion, transformation, and storage processes to detect anomalies, errors, or deviations from expected behavior. Moreover, data observability empowers data teams to proactively address potential issues before they escalate, thus minimizing the risk of data downtime, inaccuracies, or disruptions to business operations. By implementing robust data observability practices, companies can gain insights into the health and performance of their data pipelines, identify and resolve issues promptly, and maintain data integrity throughout the entire data lifecycle.
DQOps enables data observability by automatically activating selected data quality checks on data sources.
How DQOps activates data observability?
DQOps applies data observability by automatically activating data quality checks on monitored data sources.
Upon installation, DQOps creates Data quality policy configuration files. These policies automatically activate checks on all tables and columns in DQOps.
You can enable, disable or customize the existing policies, and also add a new policies. This customization can be done using the user interface or through the policies YAML files located in the patterns folder.
Automatic activation of checks
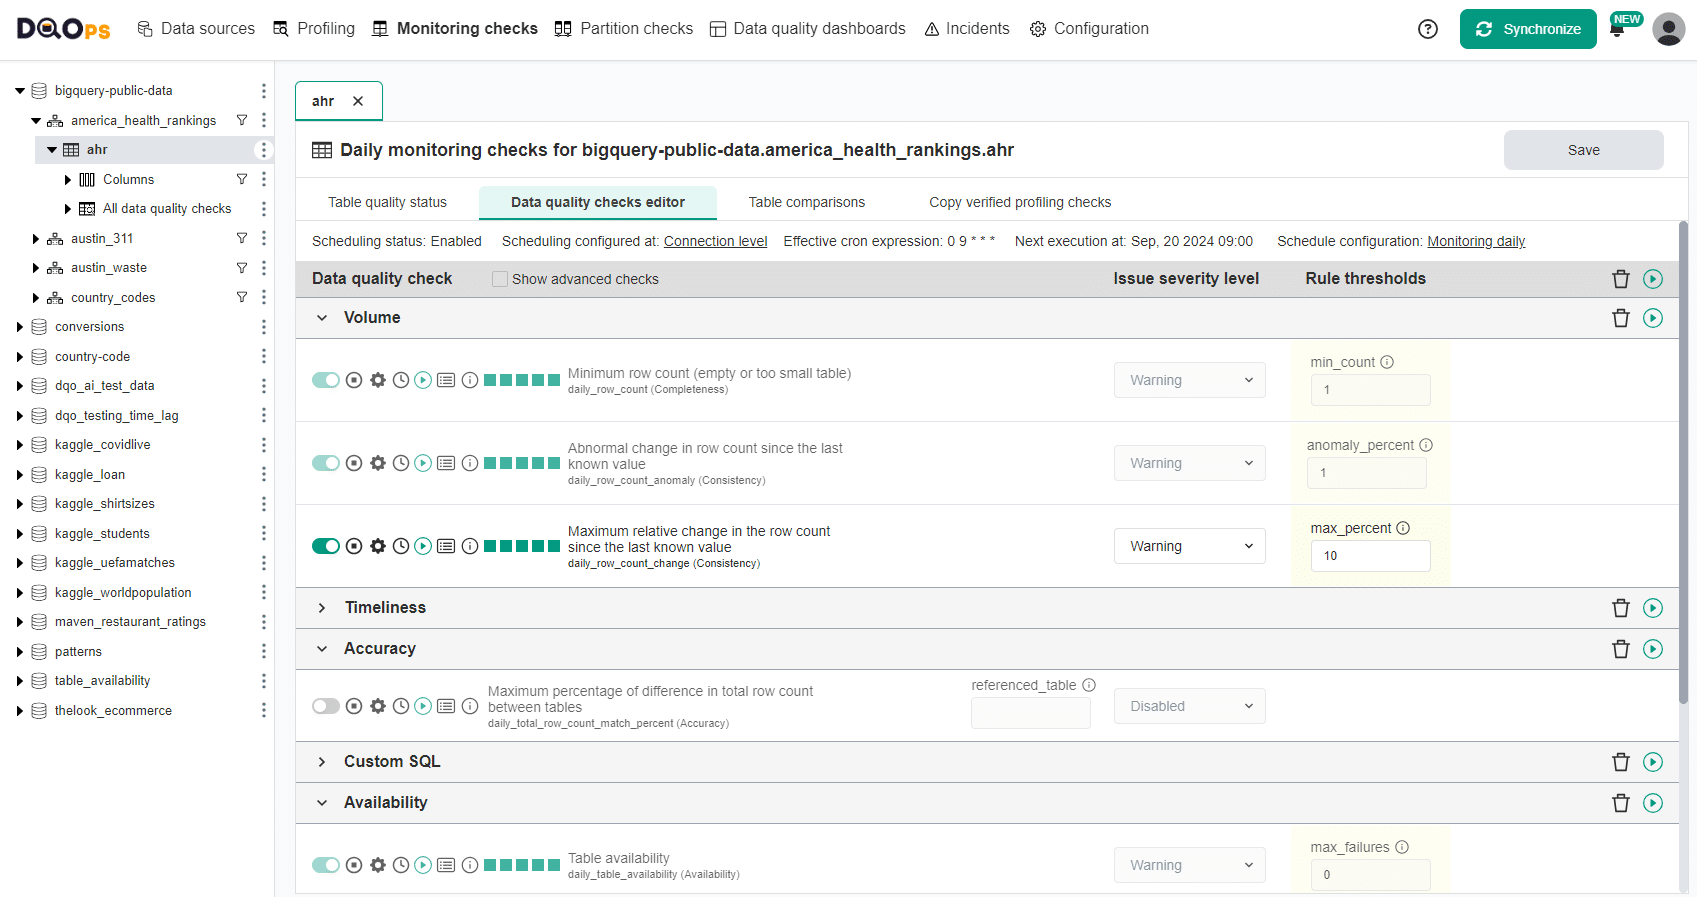
DQOps makes it easy to distinguish between automatically activated and manually activated data quality checks within the data quality check editor.
- Automatically activated checks are pre-enabled by policies and appear with a light green toggle button.
- Manually activated checks that have been manually activated are indicated by a darker green toggle button. When a check is manually activated on a table or column, DQOps uses the check's parameters from the .dqotable.yaml file instead of the configuration from a check policy file.
Deactivating a check on the table or column is also possible to prevent it from running.
Data quality policies
The data quality policies, also called patterns, are configurations of data quality checks. These policies are configured in YAML files in the patterns folder. Every configuration is identified by a policy name and has a set of filters for target tables and columns on which DQOps applies these checks.
The default content of the patterns folder is shown below.
$DQO_USER_HOME
├───...
├───patterns
│   ├───Detect big day-to-day data volume changes.dqotablepattern.yaml
│   ├───Detect data freshness anomalies daily.dqotablepattern.yaml
│   ├───Detect data volume anomalies.dqotablepattern.yaml
│   ├───Detect empty tables daily.dqotablepattern.yaml
│   ├───Detect table availability issues daily.dqotablepattern.yaml
│   ├───Detect table schema changes.dqotablepattern.yaml
│   ├───Detect anomalies in the count of distinct values.dqocolumnpattern.yaml
│   ├───Detect anomalies in the percentage of null values.dqocolumnpattern.yaml
│   ├───Detect anomalies in the sum and average of numeric values.dqocolumnpattern.yaml
│   ├───Detect anomalies in the sum and average of numeric values at a partition level.dqocolumnpattern.yaml
│   ├───Detect change of the data type of values in text columns.dqocolumnpattern.yaml
│   ├───Detect column schema changes.dqocolumnpattern.yaml
│   ├───Detect columns containing any null values.dqocolumnpattern.yaml
│   ├───Detect empty columns.dqocolumnpattern.yaml
│   ├───Detect outliers in numeric values.dqocolumnpattern.yaml
│   ├───Detect outliers in numeric values across daily partitions.dqocolumnpattern.yaml
│   ├───Detect significant changes in the percentage of null values.dqocolumnpattern.yaml
│   ├───Profile text columns to detect PII values (sensitive data).dqocolumnpattern.yaml
│   ├───Track the count and percentage of null values.dqocolumnpattern.yaml
│   ├───Track volume of daily partitions.dqotablepattern.yaml
└───...
Policy file format
The structure of the check policies YAML files is very similar to the structure of the .dqotable.yaml YAML files. The definition of the default table-level checks also has the profiling_checks, monitoring_checks, and partitioned_checks nodes.
The structure of the table-level <policy_name>.dqotablespattern.yaml file is shown below.
- The priority (order) of the pattern file. DQOps sorts the pattern files by the priority value is ascending order and activates the configuration from the files with the lowest priority first.
- An optional filter to select target tables or columns.
- The configuration of profiling checks.
- The configuration of monitoring checks.
- The configuration of partition checks.
The structure of the column-level <policy_name>.dqocolumnspattern.yaml file is very similar. The main differences are highlighted.
Policies priority
DQOps activates the policies on tables and columns according to priority. The configuration files with a lower priority are activated first. If an earlier priority file already had a configuration for some data quality check, it is not reconfigured by configuration from lower priority pattern files.
The priority field is shown below.
- The priority (order) of activating the pattern files.
Observability status in UI
DQOps automatically activates monitoring checks to track various aspects of your data health. The Observability status screen provides a quick overview of any data quality problems for the selected table or column. This allows you to proactively identify potential issues before they impact downstream processes.
With that screen, you can analyze trends in schema changes, volume, and freshness anomalies at table level and distinct count and null percent anomalies at the column level. The screen also displays a summary of data quality issues for the table or columns of choice.
Table-level observability status
To access Observability status at the table level, click on the Monitoring checks or Partition checks sections, select the table of interest and select the Observability status tab.
The screen below provides an example of the Observability status screen at the table level in the Monitoring section.
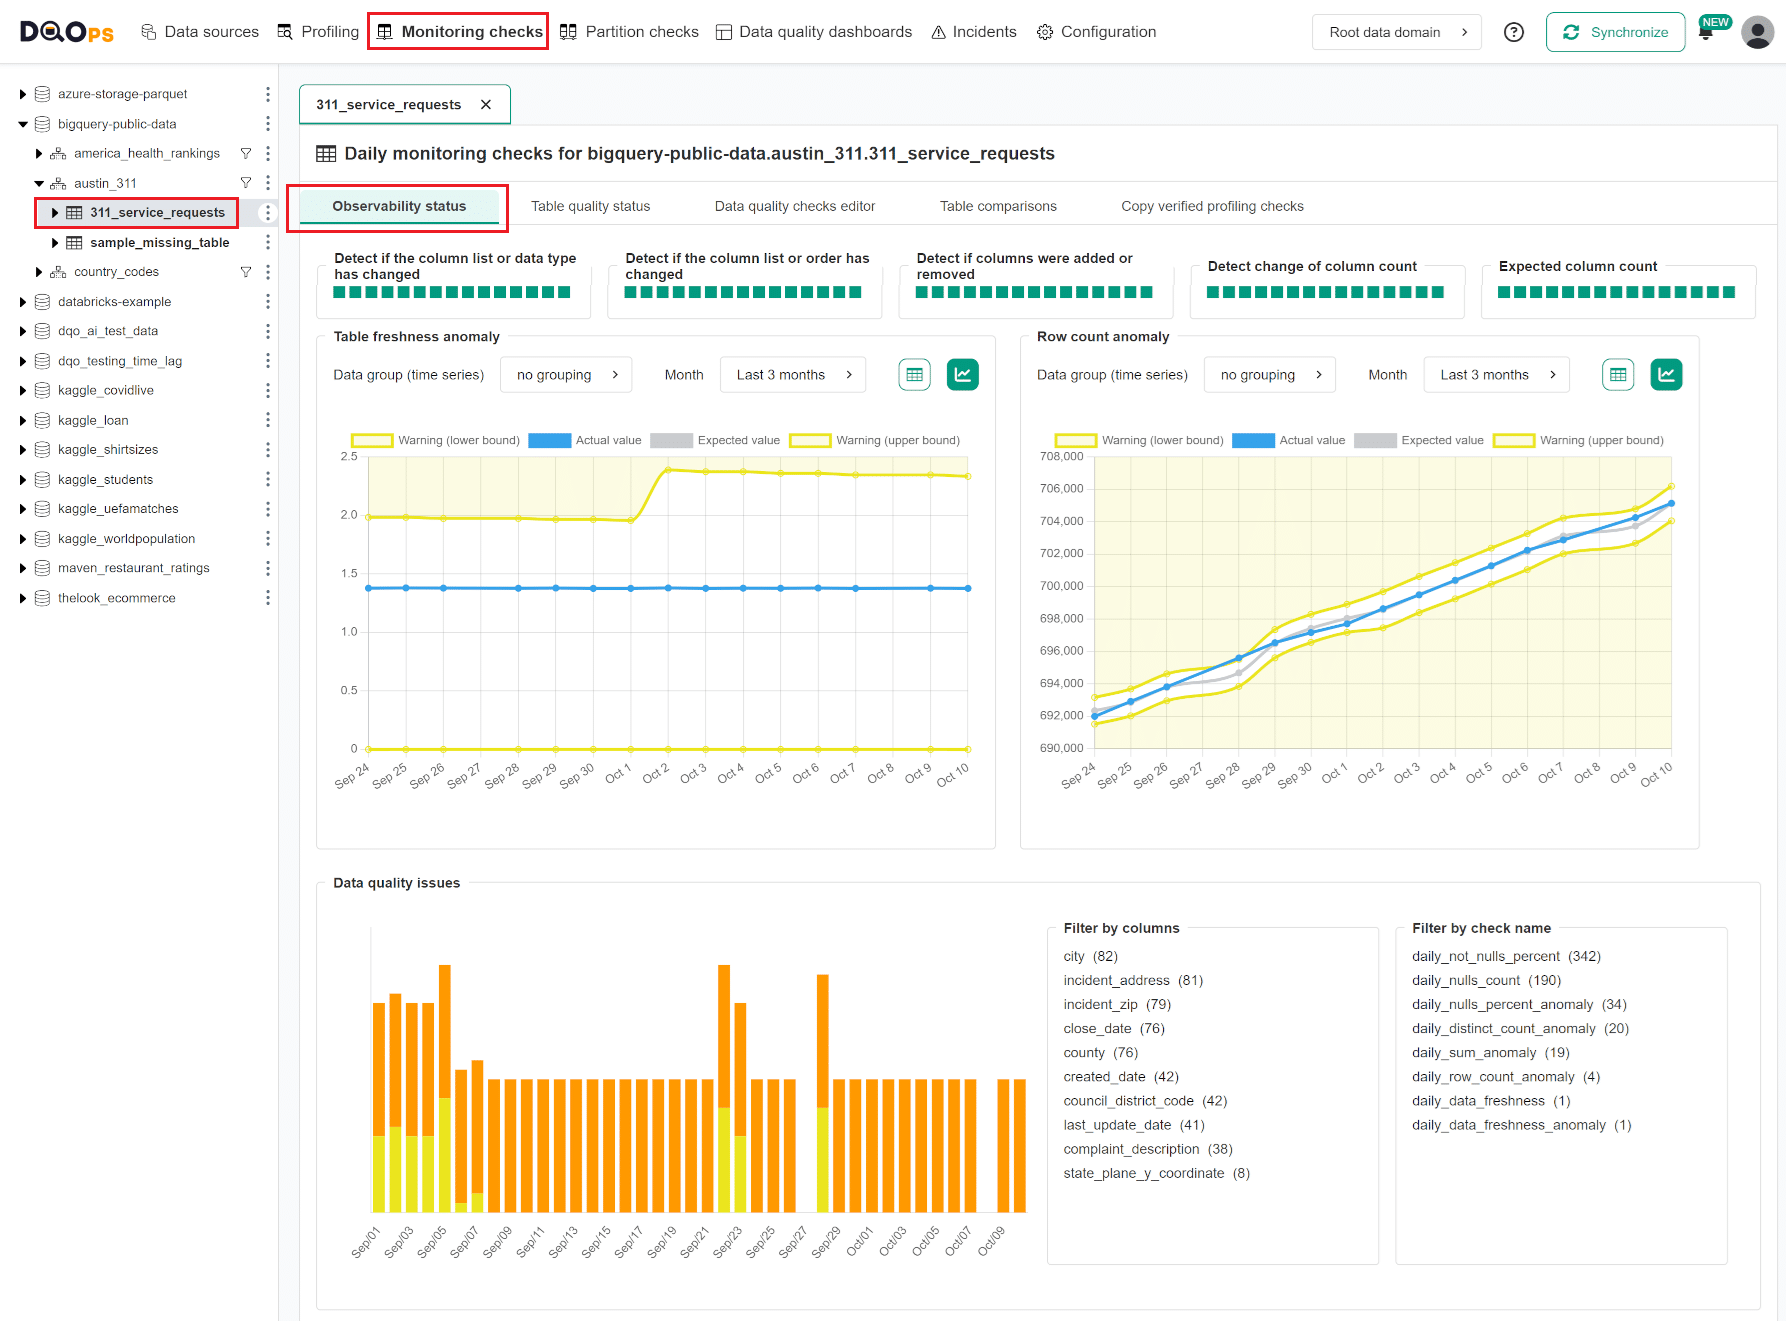
The number of elements on the screen depends on which checks have been activated. The 5 blocks at the top of the screen show the last 15 results from 5 checks in the schema category:
- Detect if the column list or data type has changed (daily_column_types_changed check)
- Detect if column list or order has changed (daily_column_list_or_order_changed check)
- Detect if columns were added or removed (daily_column_list_changed check)
- Detect change of column count (daily_column_count_changed check)
- Expected column count (daily_column_count check)
The results are displayed as squares with colors indicating the result of the run check:
- Green for a correct result
- Yellow for a warning
- Orange for an error
- Red for a fatal error
- Black for execution error
Below are line graphs that display table freshness and volume anomalies:
- Table freshness anomaly (daily_data_freshness_anomaly check)
- Row count anomaly (daily_row_count_anomaly check)
Towards the bottom of the screen, there is a column chart that provides a summary of data quality issues for the selected table.
The Observability status screen at the table level in the Partition checks section displays a line graph showing Partition row count anomaly with data from the daily_partition_row_count_anomaly check and a column chart showing data quality issues.
Column-level observability status
To access Observability status at the column level, click on the Monitoring checks or Partition checks sections. Then, select the column of interest and select the Observability status tab.
The screen below provides an example of the Observability status screen at the column level in the Monitoring section.
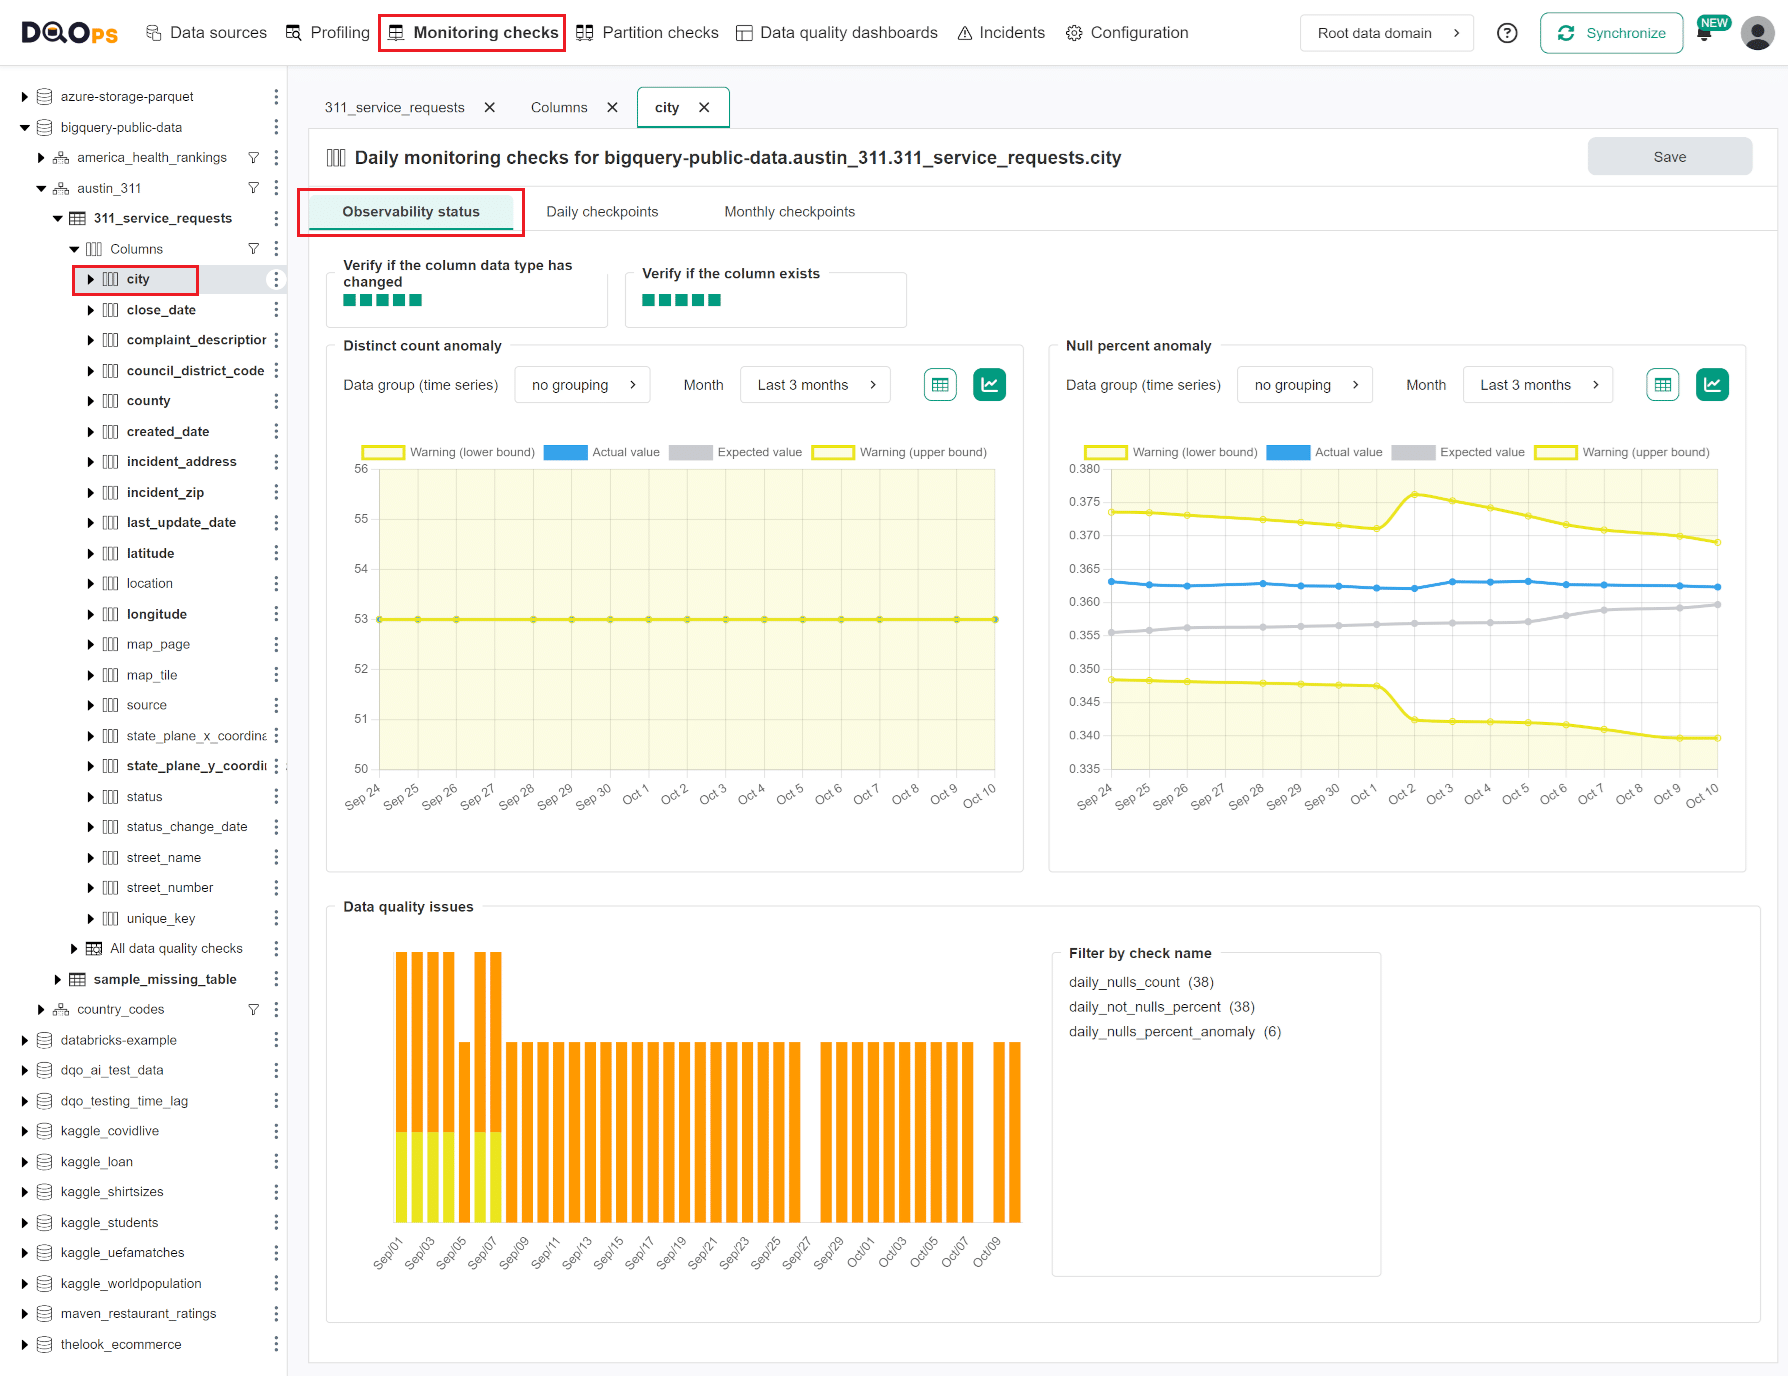
The two blocks at the top of the screen display the last 15 results from two checks in the schema category:
- Verify if the column exists (daily_column_exists check)
- Verify if the column data type has changed (daily_column_type_changed check)
Below, there are line graphs that show anomalies in distinct count and nulls percent:
- Distinct count anomaly (daily_distinct_count_anomaly check)
- Null percent anomaly (daily_nulls_percent_anomaly check)
At the bottom of the screen, there is a column chart summarizing data quality issues for the selected column.
The Observability status screen at the column level in the Partition checks section displays two line graphs for Null percent anomaly (daily_partition_nulls_percent_anomaly check) and Distinct count anomaly (daily_partition_distinct_count_anomaly check), as well as a column chart showing data quality issues.
Target tables and columns
DQOps supports creating multiple data quality check configurations, named check policies or patterns. Each policy file contains an optional target table or target column filter for columns or tables on which the checks are activated.
The filters for the target table or the target column are defined in an optional target node.
The filters support simple prefix and suffix filters, such as *, *_id, fact_*.
Default data quality check policy
The default policy files <policy_name>.dqocolumnpattern.yaml and <policy_name>.dqotablespattern.yaml do not have the configuration of the target table and column. They are applied to all tables and columns.
Target table
All supported filters for table-level check patterns are shown below.
When a filter parameter is not configured, or the value is *, DQOps skips the filter parameter.
The target table parameters are listed in the following table.
| Filter parameter | Description |
|---|---|
connection |
The target connection name (data source name). |
schema |
The target schema name. |
table |
The target table name. |
label |
This filter matches any label applied on the data source or the table. |
stage |
This filter matches the stage field of a table. |
table_priority |
This filter matches tables at a given priority or with a higher priority (which means a lower value of the priority field). |
Target column
The configuration of target columns for column-level check patterns is similar. All table-level filters are supported. The additional filters are specific to columns.
- The label fields supports labels defined on the data source, table or column.
The target column parameters are listed in the following table.
| Filter parameter | Description |
|---|---|
column |
The target column name. |
data_type |
The physical data type of the target column, if it is stored in the type_snapshot.column_type field. |
data_type_category |
The category of the data type detected by DQOps. DQOps detects a database independent category of the data type. |
Targeting multiple data assets
All filters support targeting multiple objects, except the data_type_category parameter, which uses well-known values from an enumeration. Targeting multiple data assets, such as multiple connections, schemas, tables, columns, labels, or data types, is supported by providing all the target data names separated by a comma.
The following example shows how to target multiple tables.
The following example shows how to target multiple columns.
Deactivating the policy
The configurations of data quality policies can be disabled. DQOps does not apply the disabled policies. Each checks configuration file has a disabled boolean flag. The following examples show how to turn off a policy.
The following example shows how to disable a table-level policy.
The following example shows how to disable a column-level policy.
Configuring check policies in UI
The configuration of the data quality check policies (patterns) in DQOps is found in the Data quality policies node of the Configuration section.
Table-level check policies
The list of data quality policies at the table level is located under the Table-level quality policies' node. The screen displays the table-level policies. The toggle buttons on the left side of the Quality policy name are used to activate or deactivate the policy. The list also shows connection, schema, and table search filters if they were set. You can add a new policy, by clicking on the Add data quality policy button.
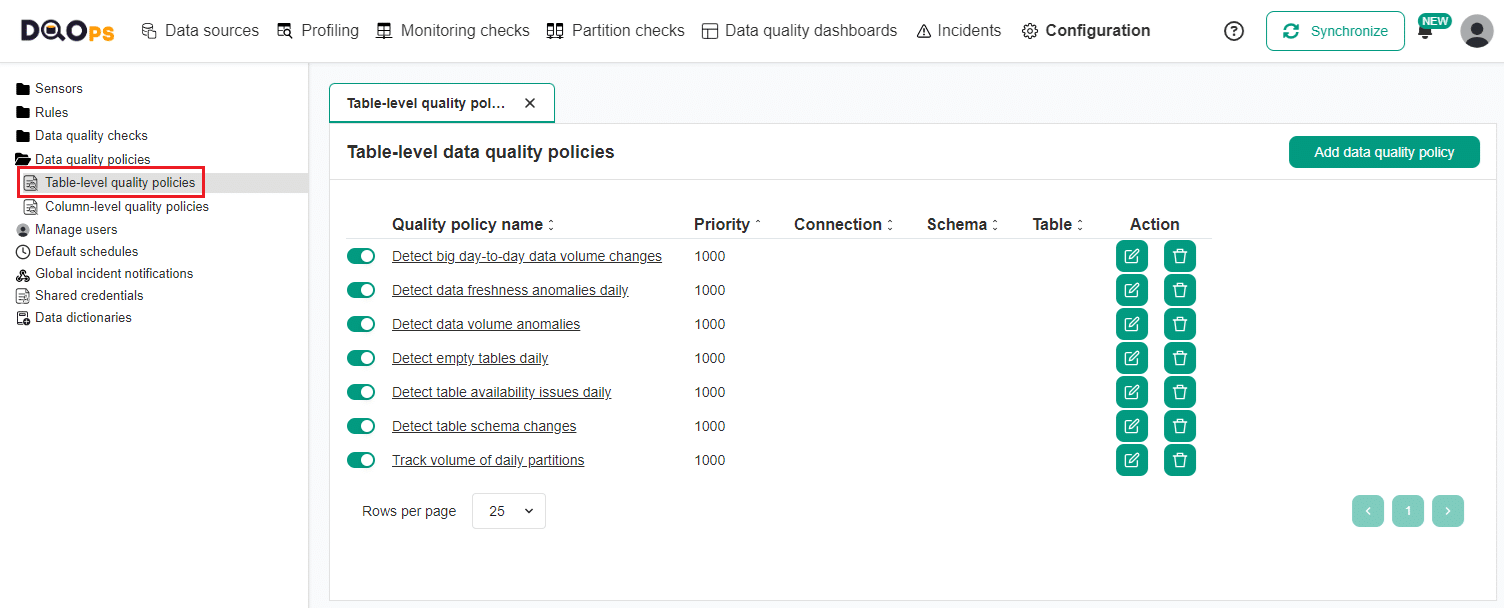
Clicking on the name of the policy or the Modify action button allows to modify the policy configuration. The search filter for the target patterns is configured on the Target table tab.
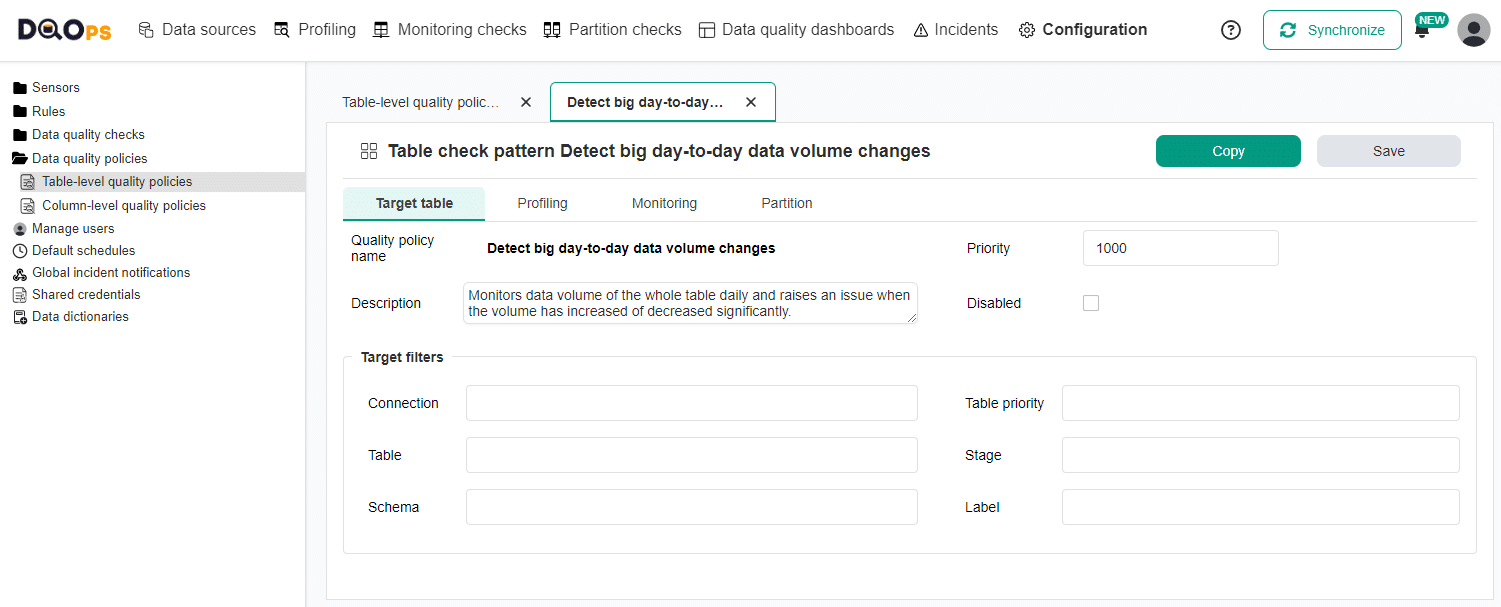
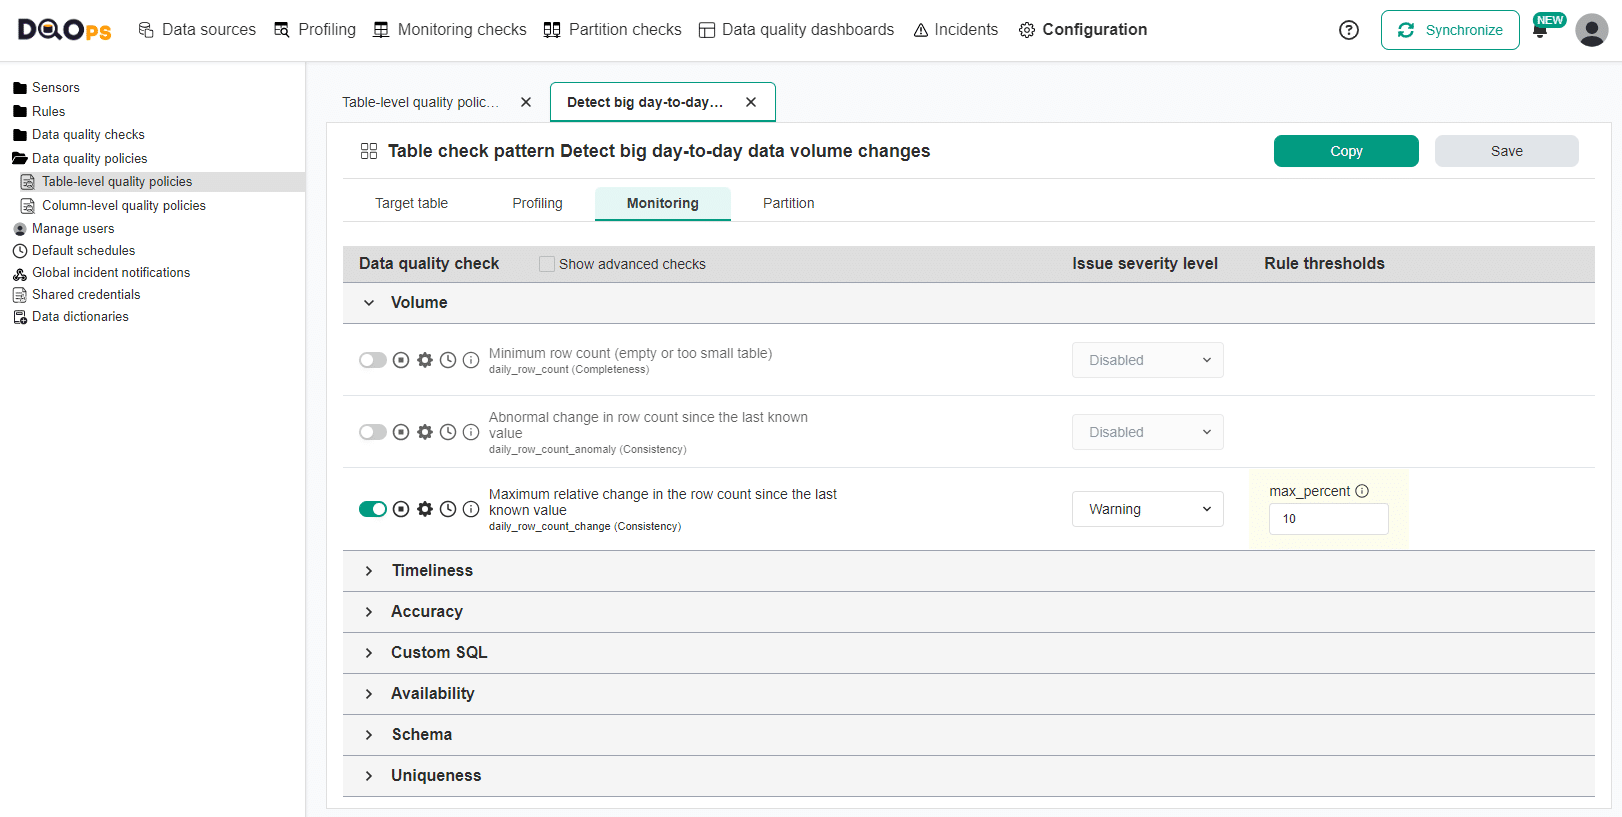
The Profiling, Monitoring, and Partition tabs show a data quality check configuration editor. The following screenshot shows the configuration of the Detect big day-to-day data volume changes policy with activated daily_row_count_change check.
Column-level check policies
The list of data quality check policies at the column level is located under the Column-level checks patterns node. The screen displays the column-level policies. The toggle buttons on the left side of the Quality policy name are used to activate or deactivate the policy. The list also shows connection, schema, and table search filters if they were set. You can add a new policy, by clicking on the Add data quality policy button.
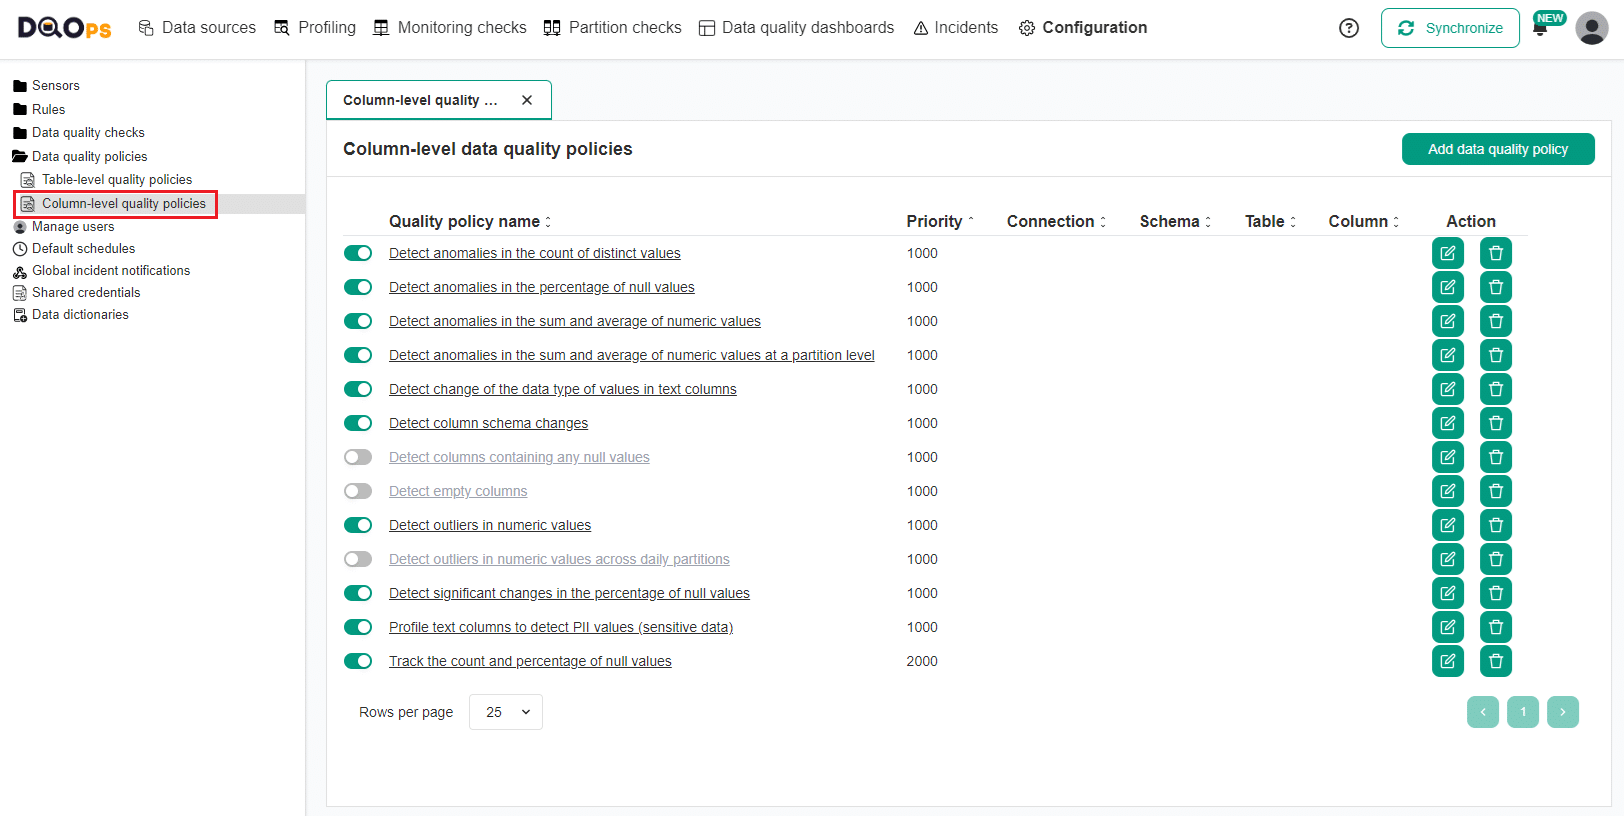
Clicking on the name of the policy or the Modify action button allows to modify the policy configuration. The search filter for the target patterns is configured on the Target table tab.
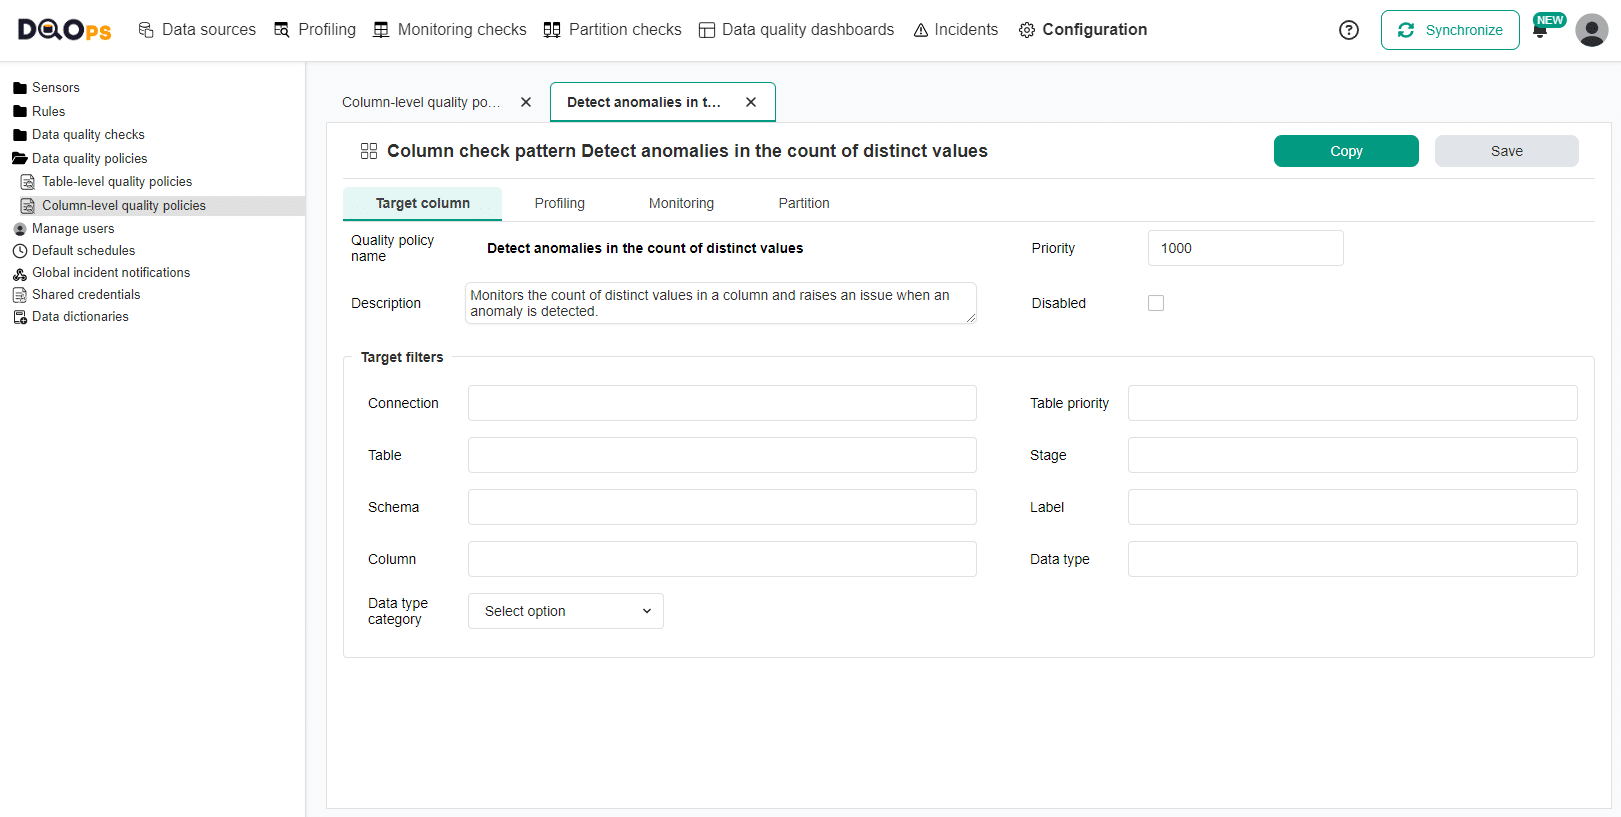 Detect anomalies in the count of distinct values
The Profiling, Monitoring, and Partition tabs show a data quality check configuration editor. The following screenshot shows the default configuration of the Detect anomalies in the count of distinct values policy with activated daily_distinct_count_anomaly check.
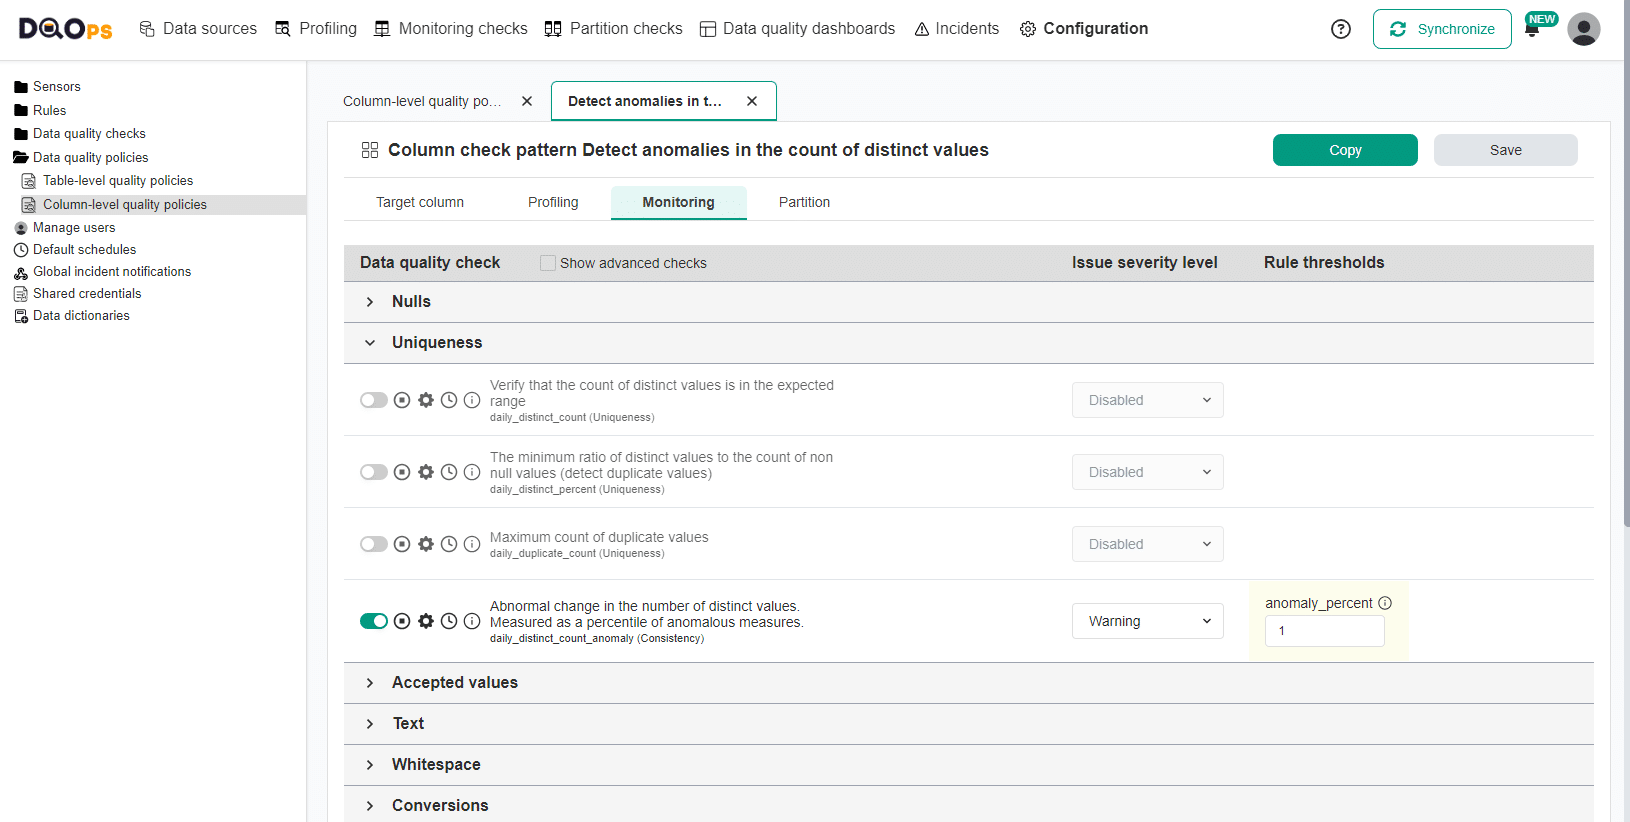
Table-level policies
The policies that DQOps can activate on all tables are described below.
The configuration can be changed using a policy editor screen in the Configuration section of the DQOps user interface. or by editing the patterns/<policy_name>.dqotablepattern.yaml file directly or
Detect big day-to-day data volume changes
Monitors data volume of the whole table daily and raises an issue when the volume has increased of decreased significantly.
This policy is disabled by default.
The table below provides a description of the checks activated by this policy.
| Category | Data quality check | Description | Data quality rule |
|---|---|---|---|
| volume | daily_row_count_change |
Detects significant changes in the table volume measured as a percentage increase or decrease in the row count. | Raises a warning severity issue when the increase or decrease in row count since yesterday (or the last known row count) is above 10%. |
Detect data freshness anomalies daily
Monitors data freshness anomalies daily.
This policy is activated by default.
The table below provides a description of the checks activated by this policy.
| Category | Data quality check | Description | Data quality rule |
|---|---|---|---|
| timeliness | daily_data_freshness_anomaly |
Measures the freshness of the table and detects anomalous (outstanding) delays in data freshness. The table must be properly configured to support timeliness checks. | Raises a warning severity issue when the data is outdated and the delay is in the top 1% of the longest delays. |
Detect data volume anomalies
Monitors data volume of the whole table (using daily monitoring checks) and for each daily partition, using daily partition checks.
This policy is activated by default.
The table below provides a description of the checks activated by this policy.
| Category | Data quality check | Description | Data quality rule |
|---|---|---|---|
| volume | daily_row_count_anomaly |
Detects anomalies in table volume (table's row count). Identifies the most significant volume increases or decreases since the previous day or the last known row count. | Raises a warning severity issue when the increase or decrease in row count is in the top 1% of the biggest day-to-day changes. |
| volume | daily_partition_row_count_anomaly |
Detects anomalies in volume of daily partitions (table's row count). Identifies the most significant volume increases or decreases since the previous day or the last known row count. | Raises a warning severity issue when the increase or decrease in row count is in the top 1% of the biggest day-to-day changes. |
Detect empty tables daily
Detects empty tables using daily monitoring checks.
This policy is activated by default.
The table below provides a description of the checks activated by this policy.
| Category | Data quality check | Description | Data quality rule |
|---|---|---|---|
| volume | daily_row_count |
Captures the daily row count of the table and identifies empty tables. | Raises a warning severity issue when an empty table is detected. |
Detect table availability issues daily
Monitors table availability issues daily
This policy is activated by default.
The table below provides a description of the checks activated by this policy.
| Category | Data quality check | Description | Data quality rule |
|---|---|---|---|
| availability | daily_table_availability |
Verifies the availability of the table by running a simple query. Detects when the table is missing or not accessible due to invalid credentials or missing permission issues | Raises a warning severity issue when the table is not available, the table is missing, or the credentials are outdated. |
Detect table schema changes
Monitors the table schema and raises issues when the schema of the table was changed.
This policy is activated by default.
The table below provides a description of the checks activated by this policy.
| Category | Data quality check | Description | Data quality rule |
|---|---|---|---|
| schema | daily_column_count_changed |
Monitors the table's schema and detects when the column count has changed since the previous day or the last known column count. | Raises a warning severity issue when the column count has changed since the last known column count value. |
| schema | daily_column_list_changed |
Monitors the table's schema and detects when the list of columns has changed. Detects that new columns were added or removed since the previous day or the last known column list but does not care about the order of columns. | Raises a warning severity issue when any columns are added or removed. |
| schema | daily_column_list_or_order_changed |
Monitors the table's schema and detects when the list or order of columns has changed. Detects that new columns were added, reordered or removed since the previous day or the last known column list. | Raises a warning severity issue when any columns are added or removed or any column changes the position in the table. |
| schema | daily_column_types_changed |
Monitors the table's schema and detects when the physical data types of columns have changed. It also detects whether columns were added or removed since the previous day or the last known column list. This check does not care about the order of columns. | Raises a warning severity issue when any columns are added or removed or the physical data type of any column is changed. |
Track volume of daily partitions
Monitors volume (row count) of daily partitions.
This policy is activated by default.
The table below provides a description of the checks activated by this policy.
| Category | Data quality check | Description | Data quality rule |
|---|---|---|---|
| volume | daily_partition_row_count |
Captures the volume (row count) of daily partitions. The partition volume can be reviewed on the DQOps data quality dashboards. | no rules (use the dashboards to review the results) |
Column-level policies
The policies that DQOps can activate on all columns are described below.
The configuration can be changed using a policy editor screen in the Configuration section of the DQOps user interface or by editing the patterns/<policy_name>.dqocolumnpattern.yaml files directly.
Detect anomalies in the count of distinct values
Monitors the count of distinct values in a column and raises an issue when an anomaly is detected.
This policy is activated by default.
The table below provides a description of the checks activated by this policy.
| Category | Data quality check | Description | Data quality rule |
|---|---|---|---|
| uniqueness | daily_distinct_count_anomaly |
Detects anomalies in the count of distinct (unique) values. Identifies the most significant increases or decreases in the count of distinct values since the previous day or the last known value. | Raises a warning severity issue when the increase or decrease in the count of distinct values is in the top 1% of the most significant day-to-day changes. |
| uniqueness | daily_partition_distinct_count_anomaly |
Detects anomalies in the count of distinct (unique) values of daily partitions. Identifies the most significant increases or decreases in the count of distinct values since the previous day or the last known value. | Raises a warning severity issue when the increase or decrease in the count of distinct values is in the top 1% of the most significant day-to-day changes. |
Detect anomalies in the percentage of null values
Monitors the scale of null values in columns and raises an issue when the day-to-day change is significant.
This policy is activated by default.
The table below provides a description of the checks activated by this policy.
| Category | Data quality check | Description | Data quality rule |
|---|---|---|---|
| nulls | daily_nulls_percent_anomaly |
Detects anomalies in the percentage of null values. Identifies the most significant increases or decreases in the rate of null values since the previous day or the last known value. | Raises a warning severity issue when the increase or decrease in the percentage of nulls is in the top 1% of the biggest day-to-day changes. |
| nulls | daily_partition_nulls_percent_anomaly |
Detects anomalies in the percentage of null values in daily partitions. Identifies the most significant increases or decreases in the rate of null values since the previous day or the last known value. | Raises a warning severity issue when the increase or decrease in the percentage of nulls is in the top 1% of the biggest day-to-day changes. |
Detect anomalies in the sum and average of numeric values
Monitors the sum and average (mean) aggregated values of numeric values and raises a data quality issue when the value changes too much day-to-day.
This policy is activated by default.
The table below provides a description of the checks activated by this policy.
| Category | Data quality check | Description | Data quality rule |
|---|---|---|---|
| anomaly | daily_sum_anomaly |
Detects anomalies in the sum of numeric values. Identifies the most significant increases or decreases in the sum of values since the previous day or the last known value. DQOps activates this check only on numeric columns. | Raises a warning severity issue when the increase or decrease in the sum of numeric values is in the top 1% of the most significant day-to-day changes. |
| anomaly | daily_mean_anomaly |
Detects anomalies in the mean (average) of numeric values. Identifies the most significant increases or decreases in the mean of values since the previous day or the last known value. DQOps activates this check only on numeric columns. | Raises a warning severity issue when the increase or decrease in the mean of numeric values is in the top 1% of the most significant day-to-day changes. |
Detect anomalies in the sum and average of numeric values at a partition level
Monitors the sum and average (mean) aggregated values of numeric values and raises a data quality issue when the value changes too much between daily partitions.
This policy is activated by default.
The table below provides a description of the checks activated by this policy.
| Category | Data quality check | Description | Data quality rule |
|---|---|---|---|
| anomaly | daily_partition_sum_anomaly |
Detects anomalies in the sum of numeric values in daily partitions. Identifies the most significant increases or decreases in the sum of values since the previous day or the last known value. DQOps activates this check only on numeric columns. | Raises a warning severity issue when the increase or decrease in the sum of numeric values in daily partition is in the top 1% of the most significant day-to-day changes. |
| anomaly | daily_partition_mean_anomaly |
Detects anomalies in the mean (average) of numeric values in daily partitions. Identifies the most significant increases or decreases in the mean of values since the previous day or the last known value. DQOps activates this check only on numeric columns. | Raises a warning severity issue when the increase or decrease in the mean of numeric values in daily partition is in the top 1% of the most significant day-to-day changes. |
Detect change of the data type of values in text columns
Detects when the values stored in a text column change their type. This policy should be activated on raw tables in the landing zones for table that store all values (also numeric an dates) in text columns.
This policy is activated by default.
The table below provides a description of the checks activated by this policy.
| Category | Data quality check | Description | Data quality rule |
|---|---|---|---|
| datatype | daily_detected_datatype_in_text_changed |
Analyzes values in text columns to detect if all values are convertible to the same data type (boolean, numeric, date, etc). DQOps activates this check only on text columns. | Raises a warning severity issue when the values found in a text column are in a different format or a new value that is not convertible to the previously detected data type is found. For example, the column customer_id in the landing zone table always contained integer values, and a non-numeric value appeared. |
| datatype | daily_partition_detected_datatype_in_text_changed |
Analyzes values in text columns to detect if all values are convertible to the same data type (boolean, numeric, date, etc). DQOps activates this check only on text columns. | Raises a warning severity issue when the values found in a text column are in a different format or a new value that is not convertible to the previously detected data type is found. For example, the column customer_id in the landing zone table always contained integer values, and a non-numeric value appeared. |
Detect column schema changes
Monitors the schema of columns registered in DQOps. Raises a data quality issue when the column is missing, or its data has changed.
This policy is activated by default.
The table below provides a description of the checks activated by this policy.
| Category | Data quality check | Description | Data quality rule |
|---|---|---|---|
| schema | daily_column_exists |
Verifies that the column exists in the monitored table. | Raises a warning severity issue when the column is missing. |
| schema | daily_column_type_changed |
Detects changes to the physical data type of the column since the last known data type. DQOps detects a change in the data type, length, precision, scale, and nullability. | Raises a warning severity issue when the physical data type of the column is changed since the last known data type. |
Detect columns containing any null values
Detects columns containing any null values using both monitoring checks and daily partitioned checks.
This policy is disabled by default.
The table below provides a description of the checks activated by this policy.
| Category | Data quality check | Description | Data quality rule |
|---|---|---|---|
| nulls | daily_nulls_count |
Counts null values in a monitored column. Detects partially incomplete columns that contain any null values. | Raises a warning severity issue when an empty row is detected in a table. |
| nulls | daily_partition_nulls_count |
Counts null values in a monitored column in daily partition. Detects partially incomplete columns that contain any null values. | Raises a warning severity issue when an empty row is detected in a table. |
Detect empty columns
Detects empty columns using both monitoring checks an daily partitioned checks.
This policy is disabled by default.
The table below provides a description of the checks activated by this policy.
| Category | Data quality check | Description | Data quality rule |
|---|---|---|---|
| nulls | daily_empty_column_found |
Detects empty columns that contain only null values. | Raises a warning severity issue when an empty column is found. |
| nulls | daily_partition_empty_column_found |
Detects empty columns that contain only null values. | Raises a warning severity issue when an empty column is found. |
Detect outliers in numeric values
Monitors numeric columns to detect new smallest (min) or biggest (max) value, which must be an anomaly.
This policy is disabled by default.
The table below provides a description of the checks activated by this policy.
| Category | Data quality check | Description | Data quality rule |
|---|---|---|---|
| anomaly | daily_min_anomaly |
Detects anomalies in the minimum numeric values. Identifies the most significant increases or decreases in the min values since the previous day or the last known value. DQOps activates this check only on numeric columns. | Raises a warning severity issue when the increase or decrease in the minimum of numeric values is in the top 1% of the most significant day-to-day changes. |
| anomaly | daily_max_anomaly |
Detects anomalies in the maximum numeric values. Identifies the most significant increases or decreases in the max values since the previous day or the last known value. DQOps activates this check only on numeric columns. | Raises a warning severity issue when the increase or decrease in the maximum of numeric values is in the top 1% of the most significant day-to-day changes. |
Detect outliers in numeric values across daily partitions
Monitors numeric columns to detect new smallest (min) or biggest (max) value for each daily partition. Raises a data quality issue when the partition contains a big or small value that exceeds regular ranges.
This policy is activated by default.
The table below provides a description of the checks activated by this policy.
| Category | Data quality check | Description | Data quality rule |
|---|---|---|---|
| anomaly | daily_partition_min_anomaly |
Detects anomalies in the minimum numeric values. Identifies the most significant increases or decreases in the min values since the previous day or the last known value. DQOps activates this check only on numeric columns. | Raises a warning severity issue when the increase or decrease in the minimum of numeric values is in the top 1% of the most significant day-to-day changes. |
| anomaly | daily_partition_max_anomaly |
Detects anomalies in the maximum numeric values. Identifies the most significant increases or decreases in the max values since the previous day or the last known value. DQOps activates this check only on numeric columns. | Raises a warning severity issue when the increase or decrease in the maximum of numeric values is in the top 1% of the most significant day-to-day changes. |
Detect significant changes in the percentage of null values
Monitors the percentage of null values in columns and raises an issue when the day-to-day change is above a threshold.
This policy is activated by default.
The table below provides a description of the checks activated by this policy.
| Category | Data quality check | Description | Data quality rule |
|---|---|---|---|
| nulls | daily_nulls_percent_change |
Detects significant changes in the percentage of null values measured as a percentage increase or decrease in the rate of null values compared to the previous day. | Raises a warning severity issue when the increase or decrease in the percentage of nulls since yesterday (or the last known nulls percentage) is above 10%. |
| nulls | daily_partition_nulls_percent_change |
Detects significant changes in the percentage of null values in daily partitions measured as a percentage increase or decrease in the rate of null values compared to the previous day. | Raises a warning severity issue when the increase or decrease in the percentage of nulls since yesterday (or the last known nulls percentage) is above 10%. |
Profile text columns to detect PII values (sensitive data)
Activates data profiling checks on all text columns to detect if they contain sensitive data (emails, phone numbers). Enabling this policy allows the data quality rule miner to set up PII checks when sensitive values are identified.
This policy is activated by default.
The table below provides a description of the checks activated by this policy.
| Category | Data quality check | Description | Data quality rule |
|---|---|---|---|
| pii | profile_contains_usa_phone_percent |
Detects USA phone numbers inside text columns. | no rules |
| pii | profile_contains_email_percent |
Detects emails inside text columns. | no rules |
Track the count and percentage of null values
Monitors the count and the percentage of null values without raising data quality issues.
This policy is activated by default.
The table below provides a description of the checks activated by this policy.
| Category | Data quality check | Description | Data quality rule |
|---|---|---|---|
| nulls | daily_nulls_count |
Counts null values in a monitored column. Detects partially incomplete columns that contain any null values. | no rules (use the dashboards to review the results) |
| nulls | daily_nulls_percent |
Measures the percentage of null values in a column. | no rules (use the dashboards to review the results) |
| nulls | daily_partition_nulls_count |
Counts null values in a monitored column in daily partitions. Detects partially incomplete columns that contain any null values. | no rules (use the dashboards to review the results) |
| nulls | daily_partition_nulls_percent |
Measures the percentage of null values in a column in daily partitions. | no rules (use the dashboards to review the results) |
Next steps
- Learn how to monitor, review and react to data quality issues detected by the default data quality checks.
- You haven't installed DQOps yet? Check the detailed guide on how to install DQOps using pip or run DQOps as a Docker container.
- Check the sample which shows how to use the default DQOps data quality checks to detect empty tables and view the results on data quality dashboards.
- DQOps allows you to keep track of the issues that arise during data quality monitoring and send alert notifications directly to Slack. Learn more about incidents and notifications.
- DQOps provide you with summary statistics about your table and column. This information can be valuable in deciding which data quality checks and threshold levels should be set to monitor data quality. For more details about Basic data statistics, click here.